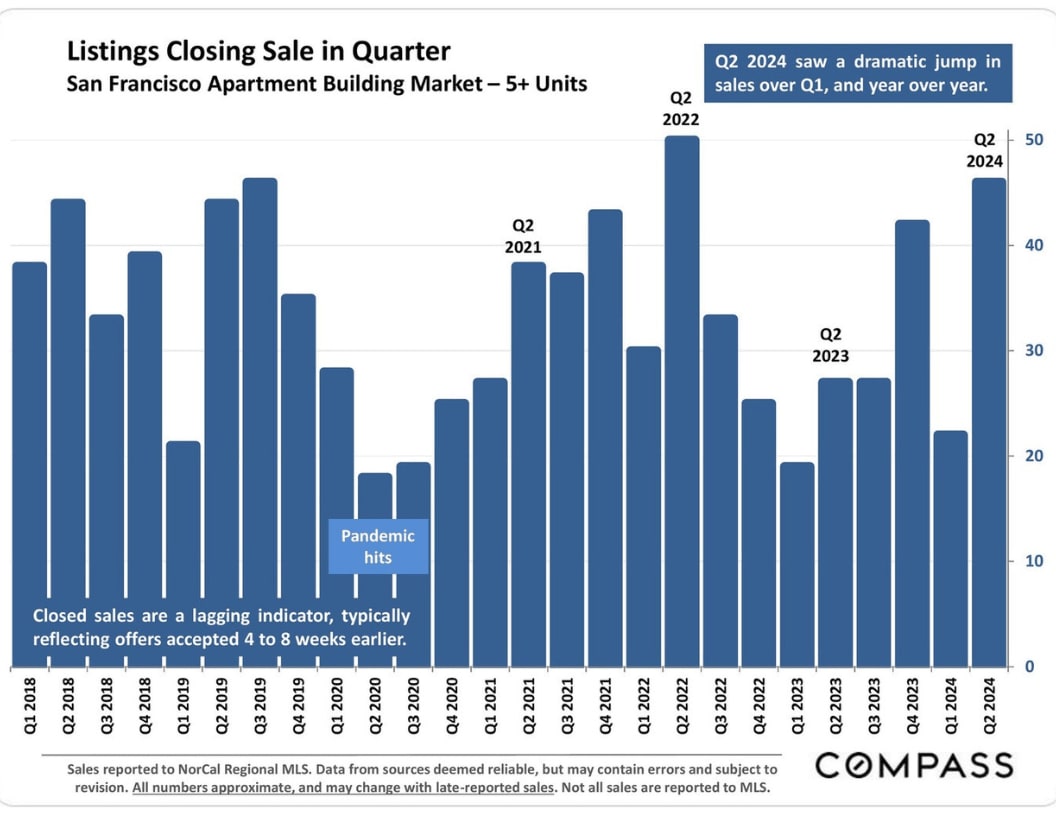
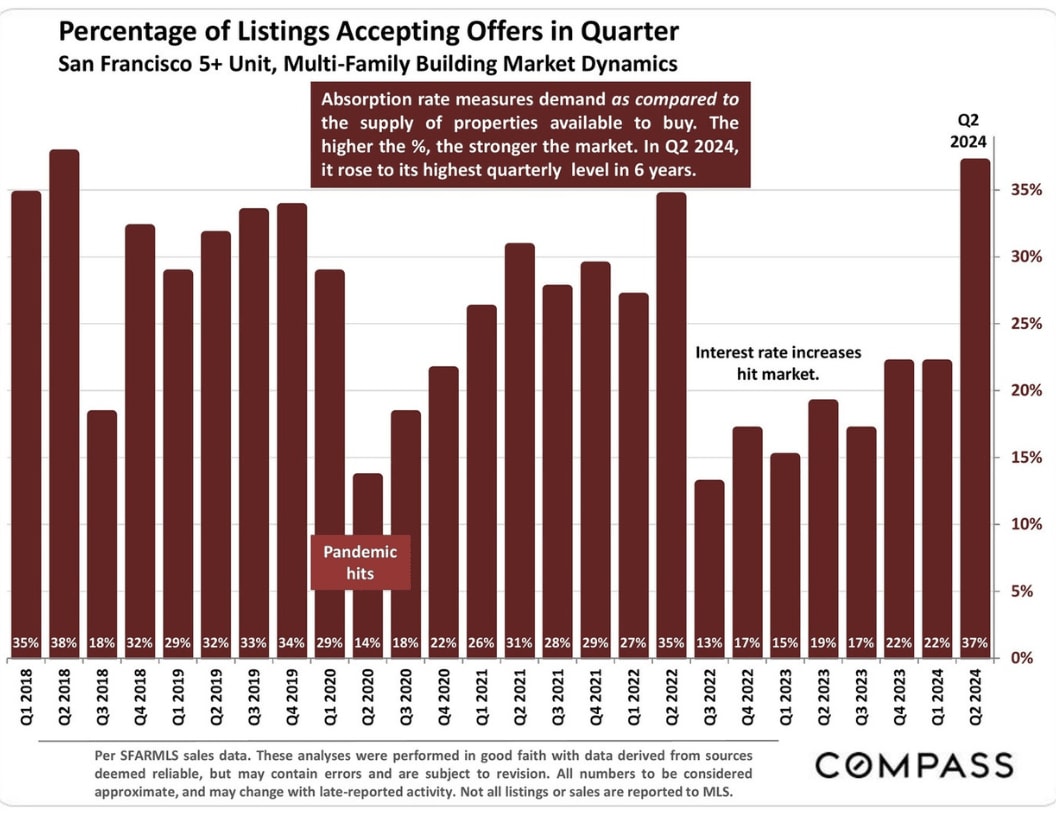
The number of 5+ unit multi-family building sales in Q2 2024 more than doubled from Q1, while the absorption rate the percentage of listings going into contract hit its highest quarterly percentage since 2018. The median days on market prior to acceptance of offer for properties sold in Q2 was 42 days.
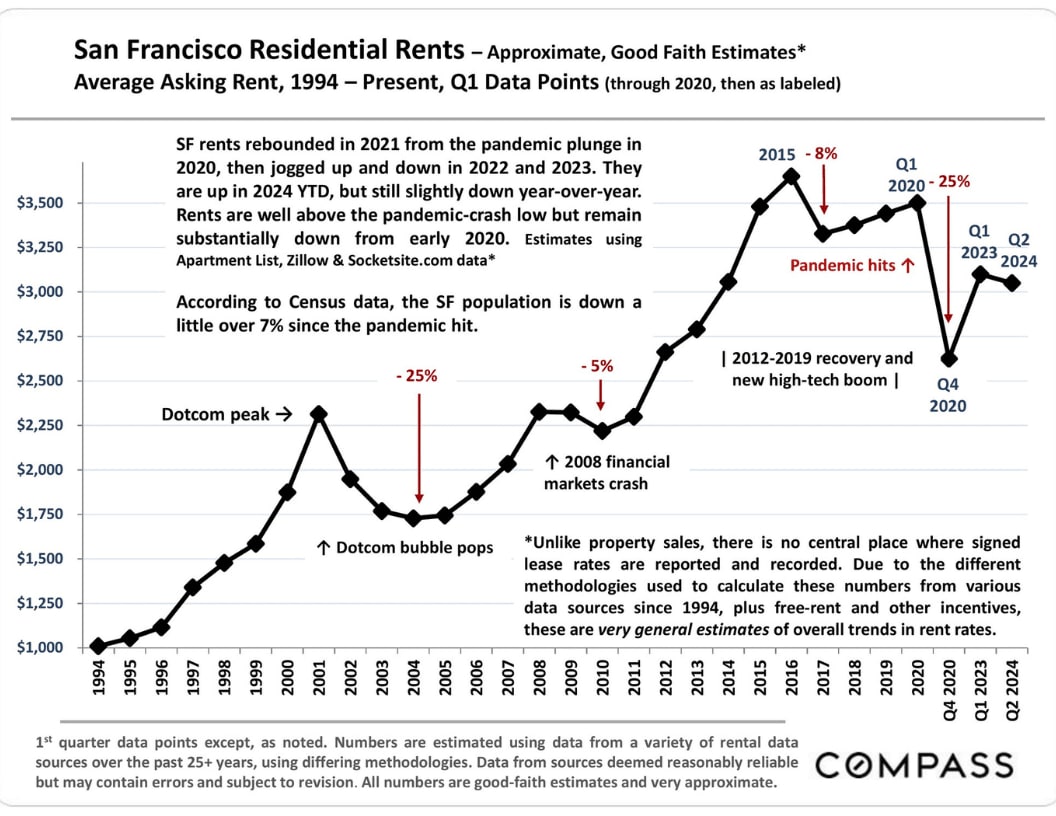
Virtually all standard metrics of value continue to reflect declines in values in 2024 YTD from previous years, especially from before the pandemic. Apartment rents have been ticking up in 2024, but are down year over year, and remain well below pre-pandemic rates.
The office-building vacancy rate is above 32%, and leasing rates have continued to fall. Office attendance rates remain down over 50% from pre-pandemic levels, a major factor in SF apartment demand and rent rates. Hopefully, this segment has hit bottom and will now begin to recover.
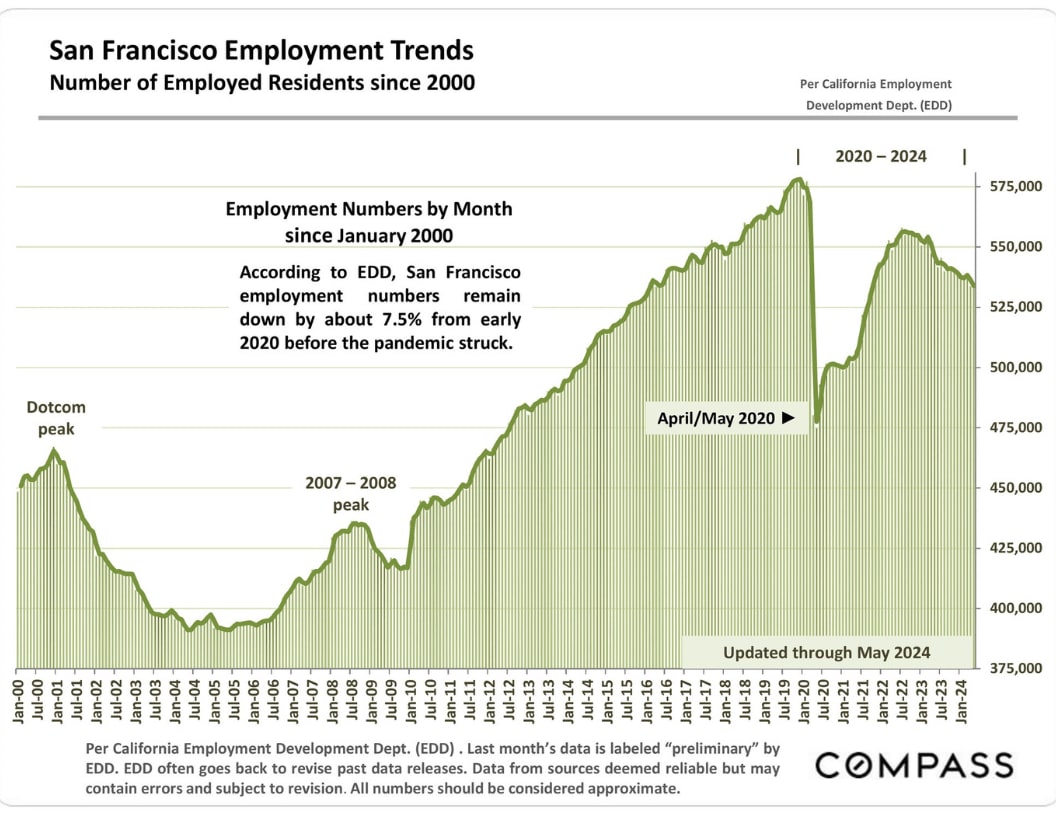
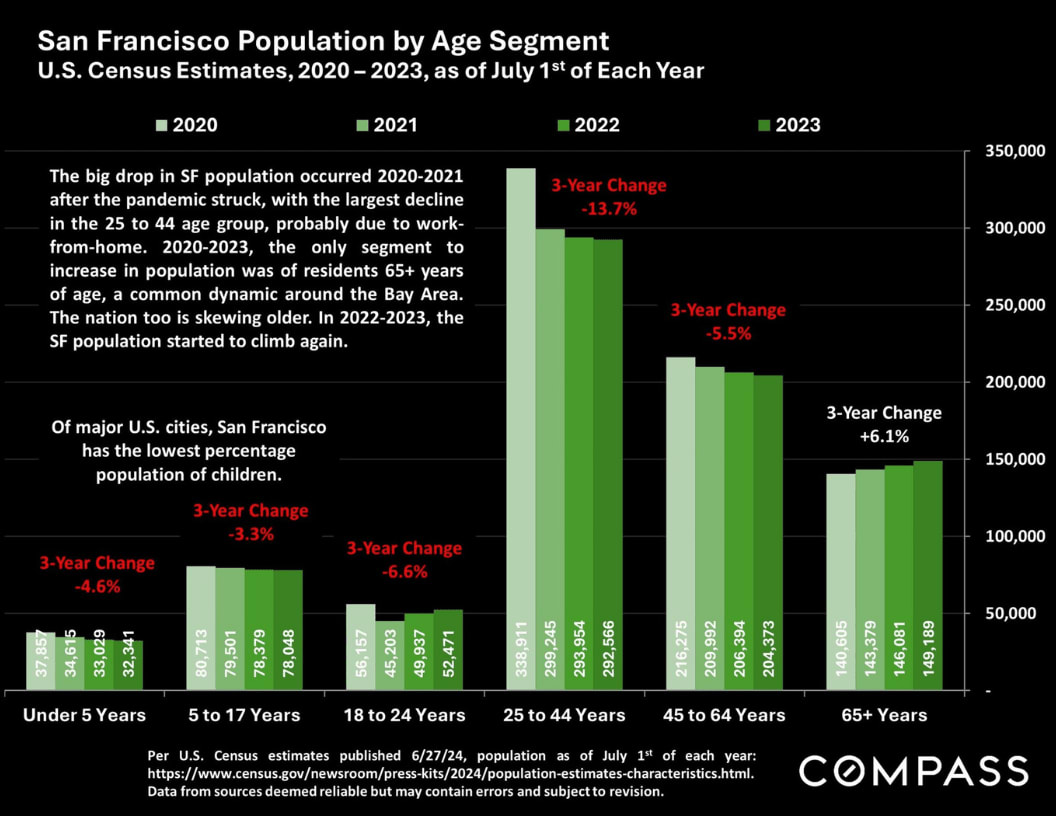
According to the CA Employment Development Department, the number of employed residents in San Francisco remains approximately 7.5% below the pre-pandemic count. The largest drop occurred in the 25 to 44 working-age segment, primarily due to the advent of work from home. However, according to media reports, hiring by SF AI companies continues to increase.
As of early July, there were 74 5+ unit apartment buildings listed for sale - with no offer accepted - with a median size of 6130 square feet, a median list price of $2,825,000, and a median days on market of 95 days: 58 of the 74 active listings were for buildings of 5 to 16 units. 29 properties were listed as being in contract, with a median building size of 9000 square feet, a median list price of $3,495,000, and a median days on market prior to offer acceptance of 41 days.
Listings Closing Sale in Quarter
San Francisco Apartment Building Market - 5+ Units
Percentage of Listings Accepting Offers in Quarter
San Francisco 5+ Unit, Multi-Family Building Market Dynamics
Absorption rate measures demand as compared to the supply of properties available to buy. The higher the %, the stronger the market. In Q2 2024, it rose to its highest quarterly level in 6 years.
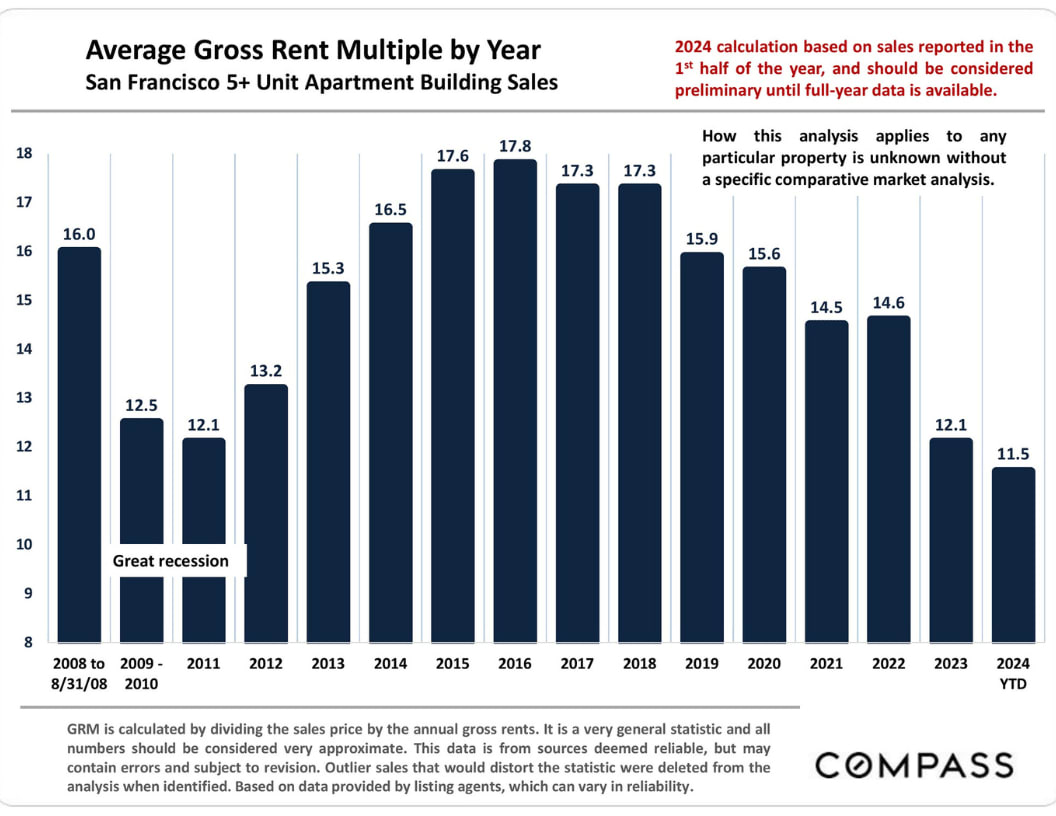
Average Gross Rent Multiple by Year
San Francisco 5+ Unit Apartment Building Sales
2024 calculation based on sales reported in the 1st half of the year, and should be considered preliminary until full-year data is available.
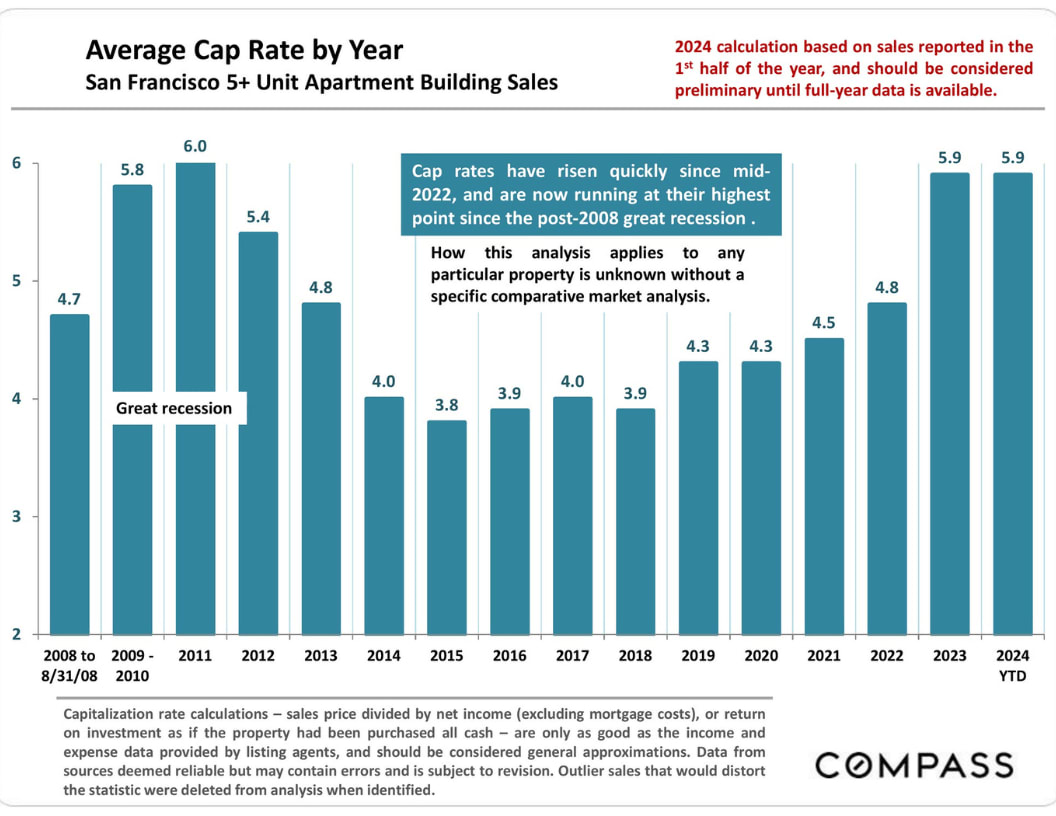
Average Cap Rate by Year
San Francisco 5+ Unit Apartment Building Sales
2024 calculation based on sales reported in the 1st half of the year, and should be considered preliminary until full-year data is available.
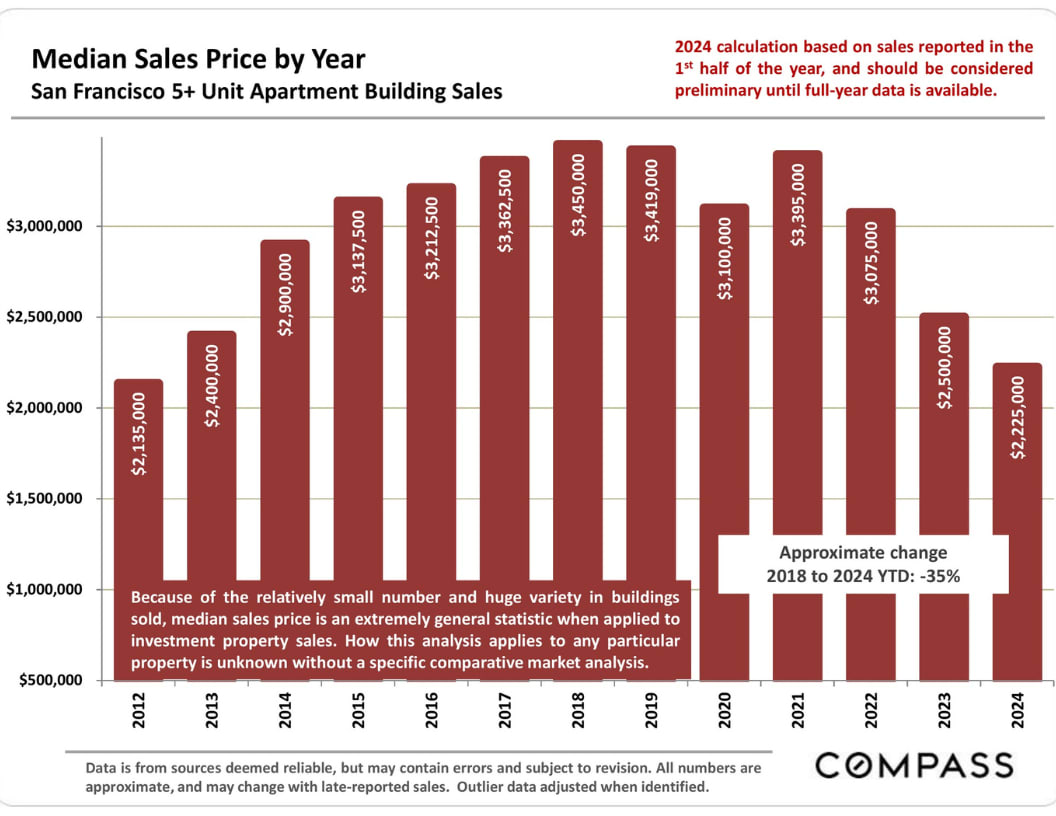
Median Sales Price by Year
San Francisco 5+ Unit Apartment Building Sales
2024 calculation based on sales reported in the 1st half of the year, and should be considered preliminary until full-year data is available.
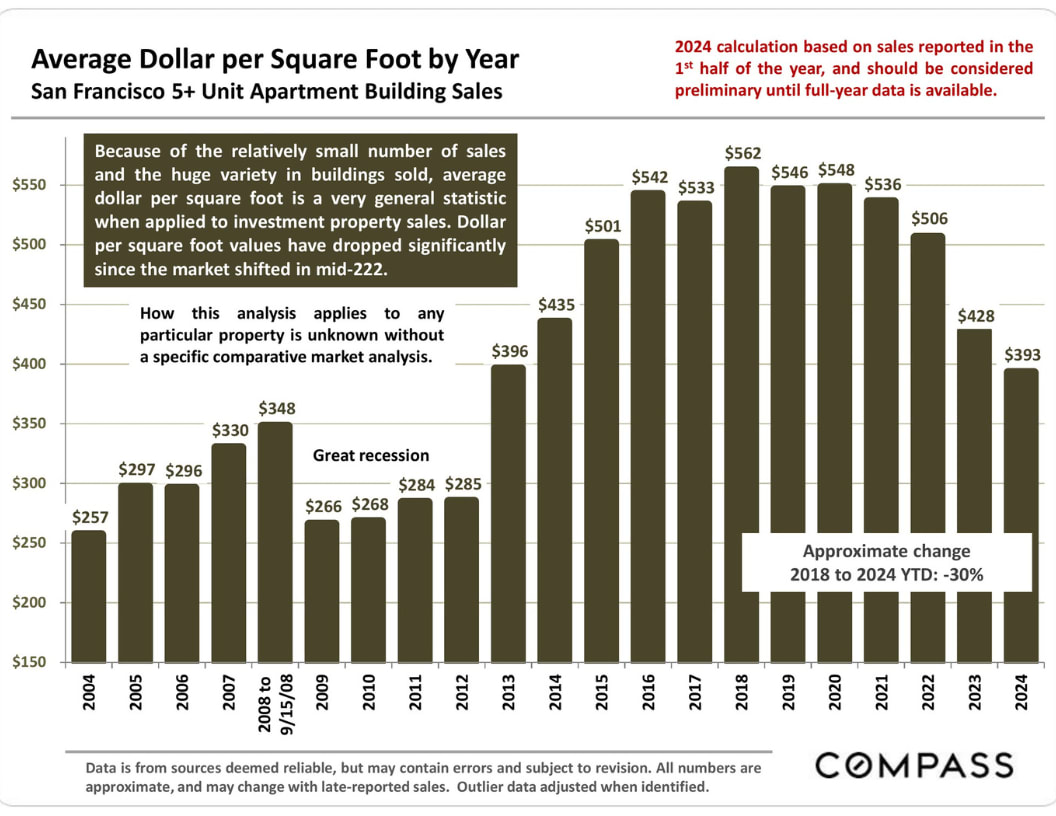
Average Dollar per Square Foot by Year
San Francisco 5+ Unit Apartment Building Sales
2024 calculation based on sales reported in the 1st half of the year, and should be considered preliminary until full-year data is available.
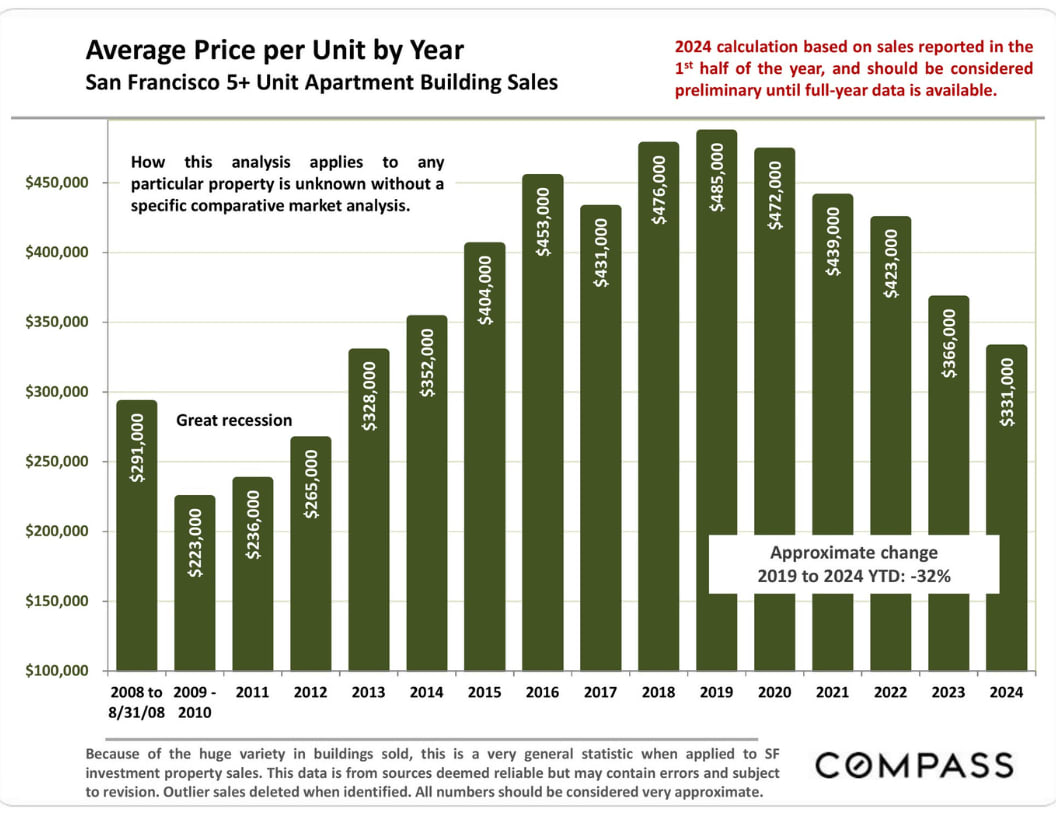
Average Price per Unit by Year
San Francisco 5+ Unit Apartment Building Sales
2024 calculation based on sales reported in the 1st half of the year, and should be considered preliminary until full-year data is available.
San Francisco Residential Rents -Approximate, Good Faith Estimates*
Average Asking Rent, 1994 - Present, Ql Data Points (through 2020, then as labeled)
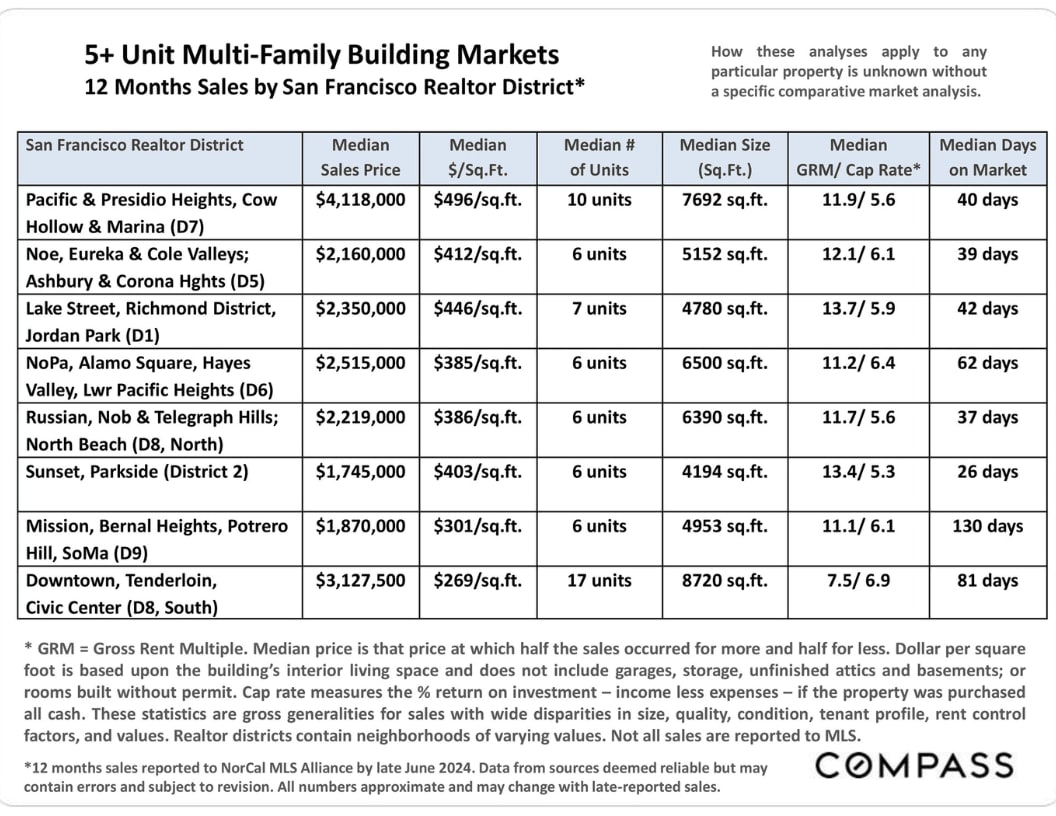
5+ Unit Multi-Family Building Markets
12 Months Sales by San Francisco Realtor District*
How these analyses apply to any particular property is unknown without a specific comparative market analysis.
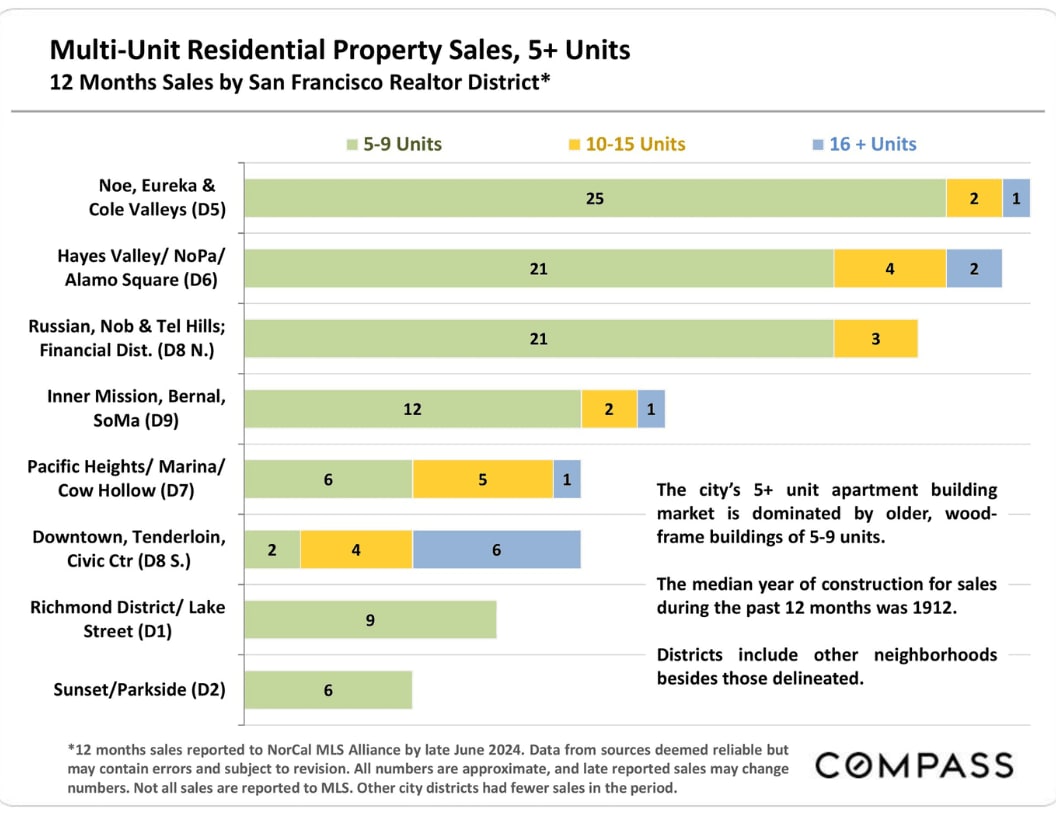
Multi-Unit Residential Property Sales, 5+ Units
12 Months Sales by San Francisco Realtor District*
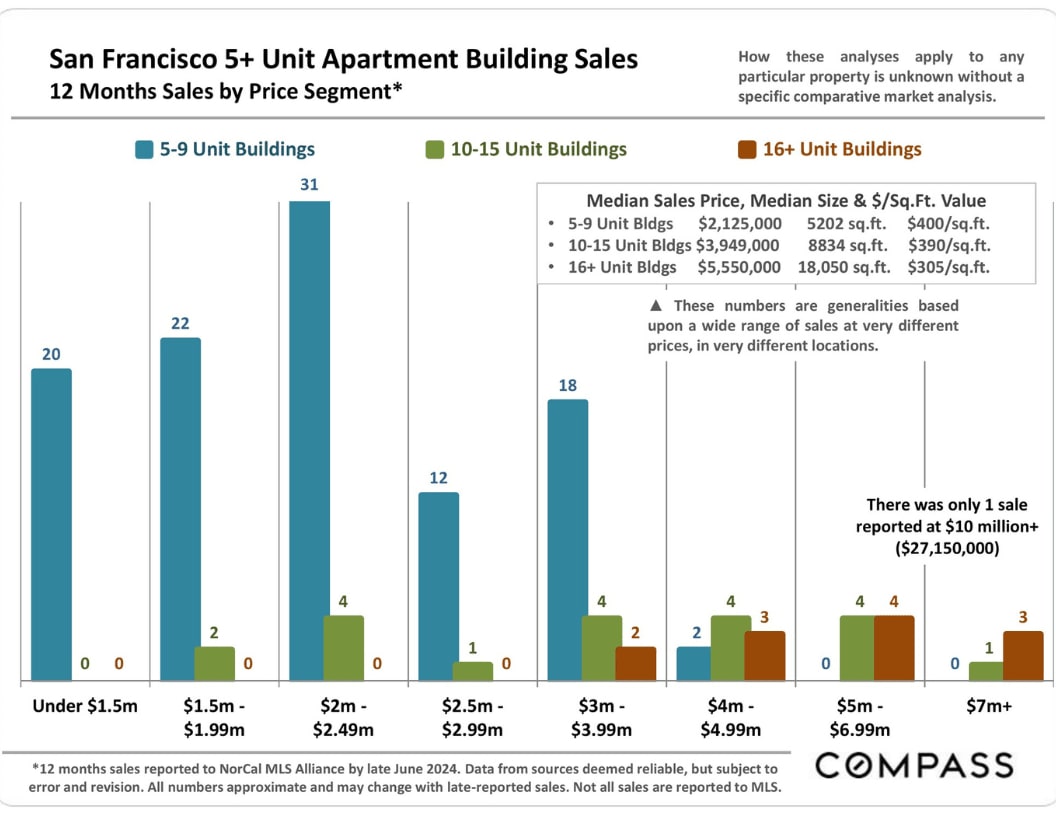
San Francisco 5+ Unit Apartment Building Sales
12 Months Sales by Price Segment*
San Francisco Employment Trends
Number of Employed Residents since 2000
San Francisco Population by Age Segment
U.S. Census Estimates, 2020-2023, as of July 1st of Each Year
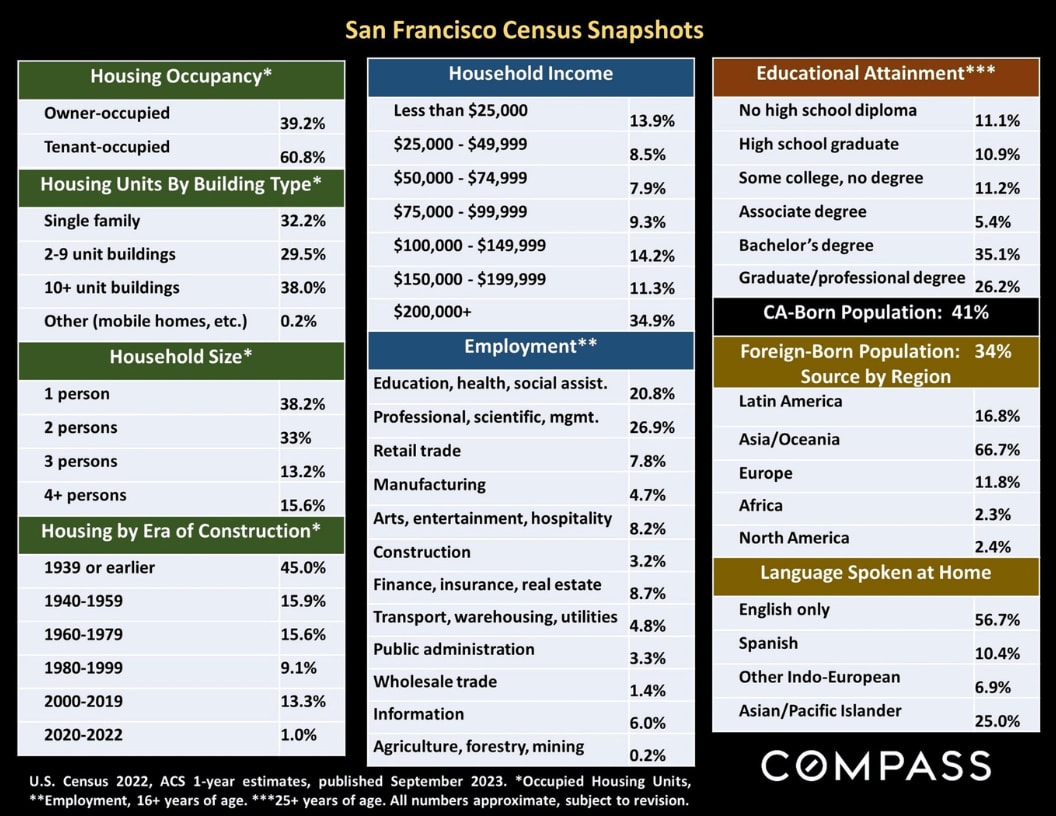
San Francisco Census Snapshots
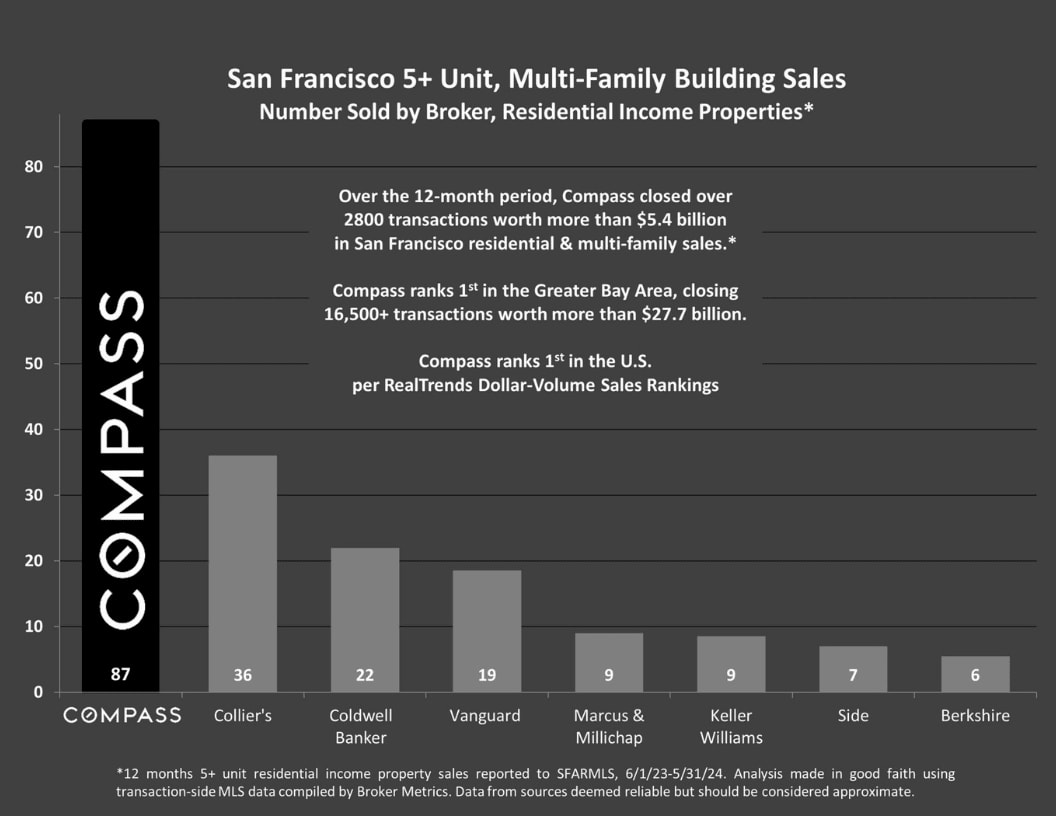
San Francisco 5+ Unit, Multi-Family Building Sales
Number Sold by Broker, Residential Income Properties*
Median Household Income
San Francisco County since 2000*
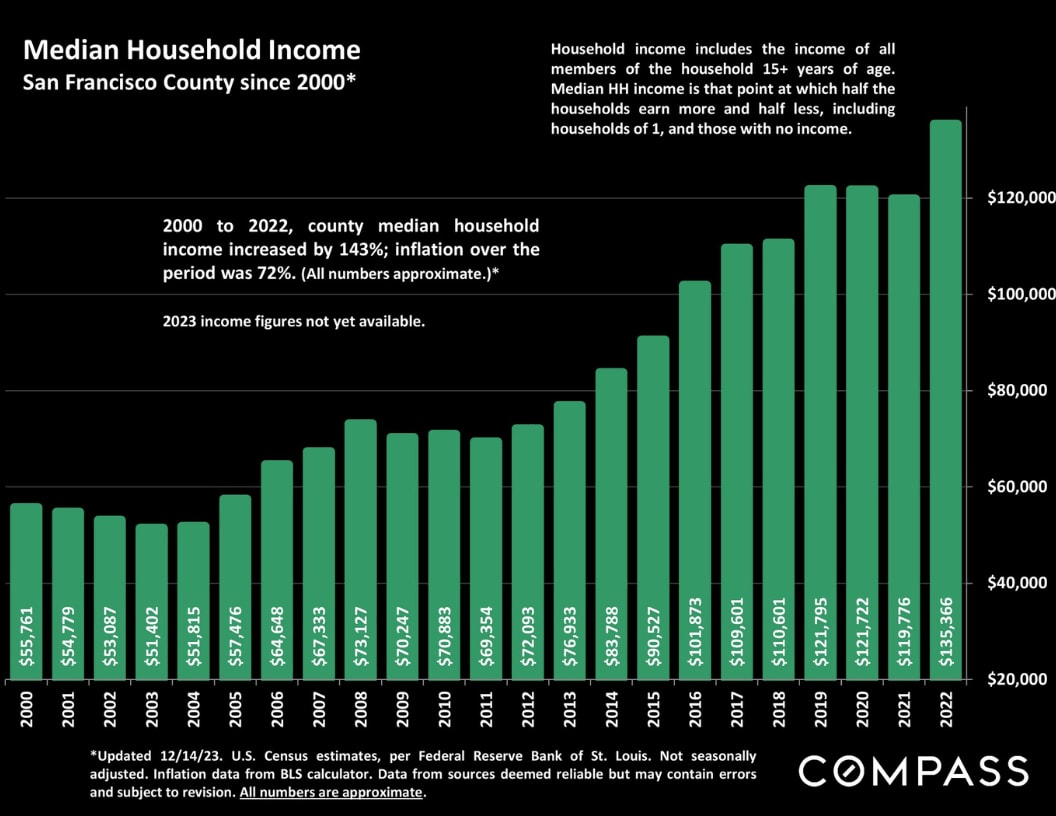
San Francisco Census Snapshots

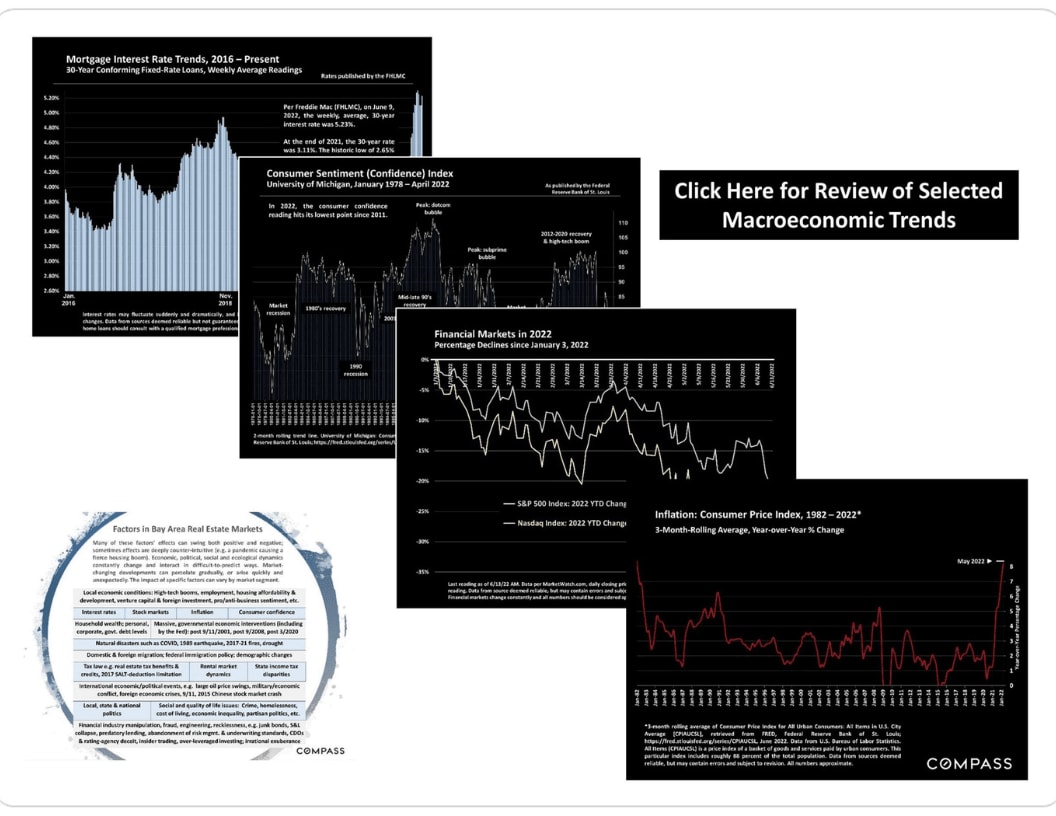
Bay Area Market Reports
Note that the quantity of sales in any given local submarket is usually relatively small and/or the number of sales that report the necessary financial information can be limited. Buildings of different ages, qualities and sizes selling in different periods can cause these average and median figures to fluctuate significantly. Furthermore, the reliability of some of these calculations depends upon the quality of the income and expense figures provided by the listing agents, and sometimes instead of actual numbers, much less meaningful projected or scheduled figures are used. Late reported listings and sales may change these statistics. Therefore, the above statistics should be considered very general indicators, and how they apply to any particular property without a specific comparative market analysis is unknown.
These analyses were made in good faith with data from sources deemed reliable, but they may contain errors and are subject to revision. Statistics are generalities and all numbers should be considered approximate. Numbers may change with late-reported sales activity.
Compass is a real estate broker licensed by the State of California, DRE 01527235. Equal Housing Opportunity. This report has been prepared solely for information purposes. The information herein is based on or derived from information generally available to the public and/or from sources believed to be reliable. No representation or warranty can be given with respect to the accuracy or completeness of the information. Compass disclaims any and all liability relating to this report, including without limitation any express or implied representations or warranties for statements contained in, and omissions from, the report. Nothing contained herein is intended to be or should be read as any regulatory, legal, tax, accounting or other advice and Compass does not provide such advice. All opinions are subject to change without notice. Compass makes no representation regarding the accuracy of any statements regarding any references to the laws, statutes or regulations of any state are those of the author(s). Past performance is no guarantee of future results.
© 2024 Compass
