Blog

The San Francisco 2-4 Unit Apartment Building Market

January 2026 Report

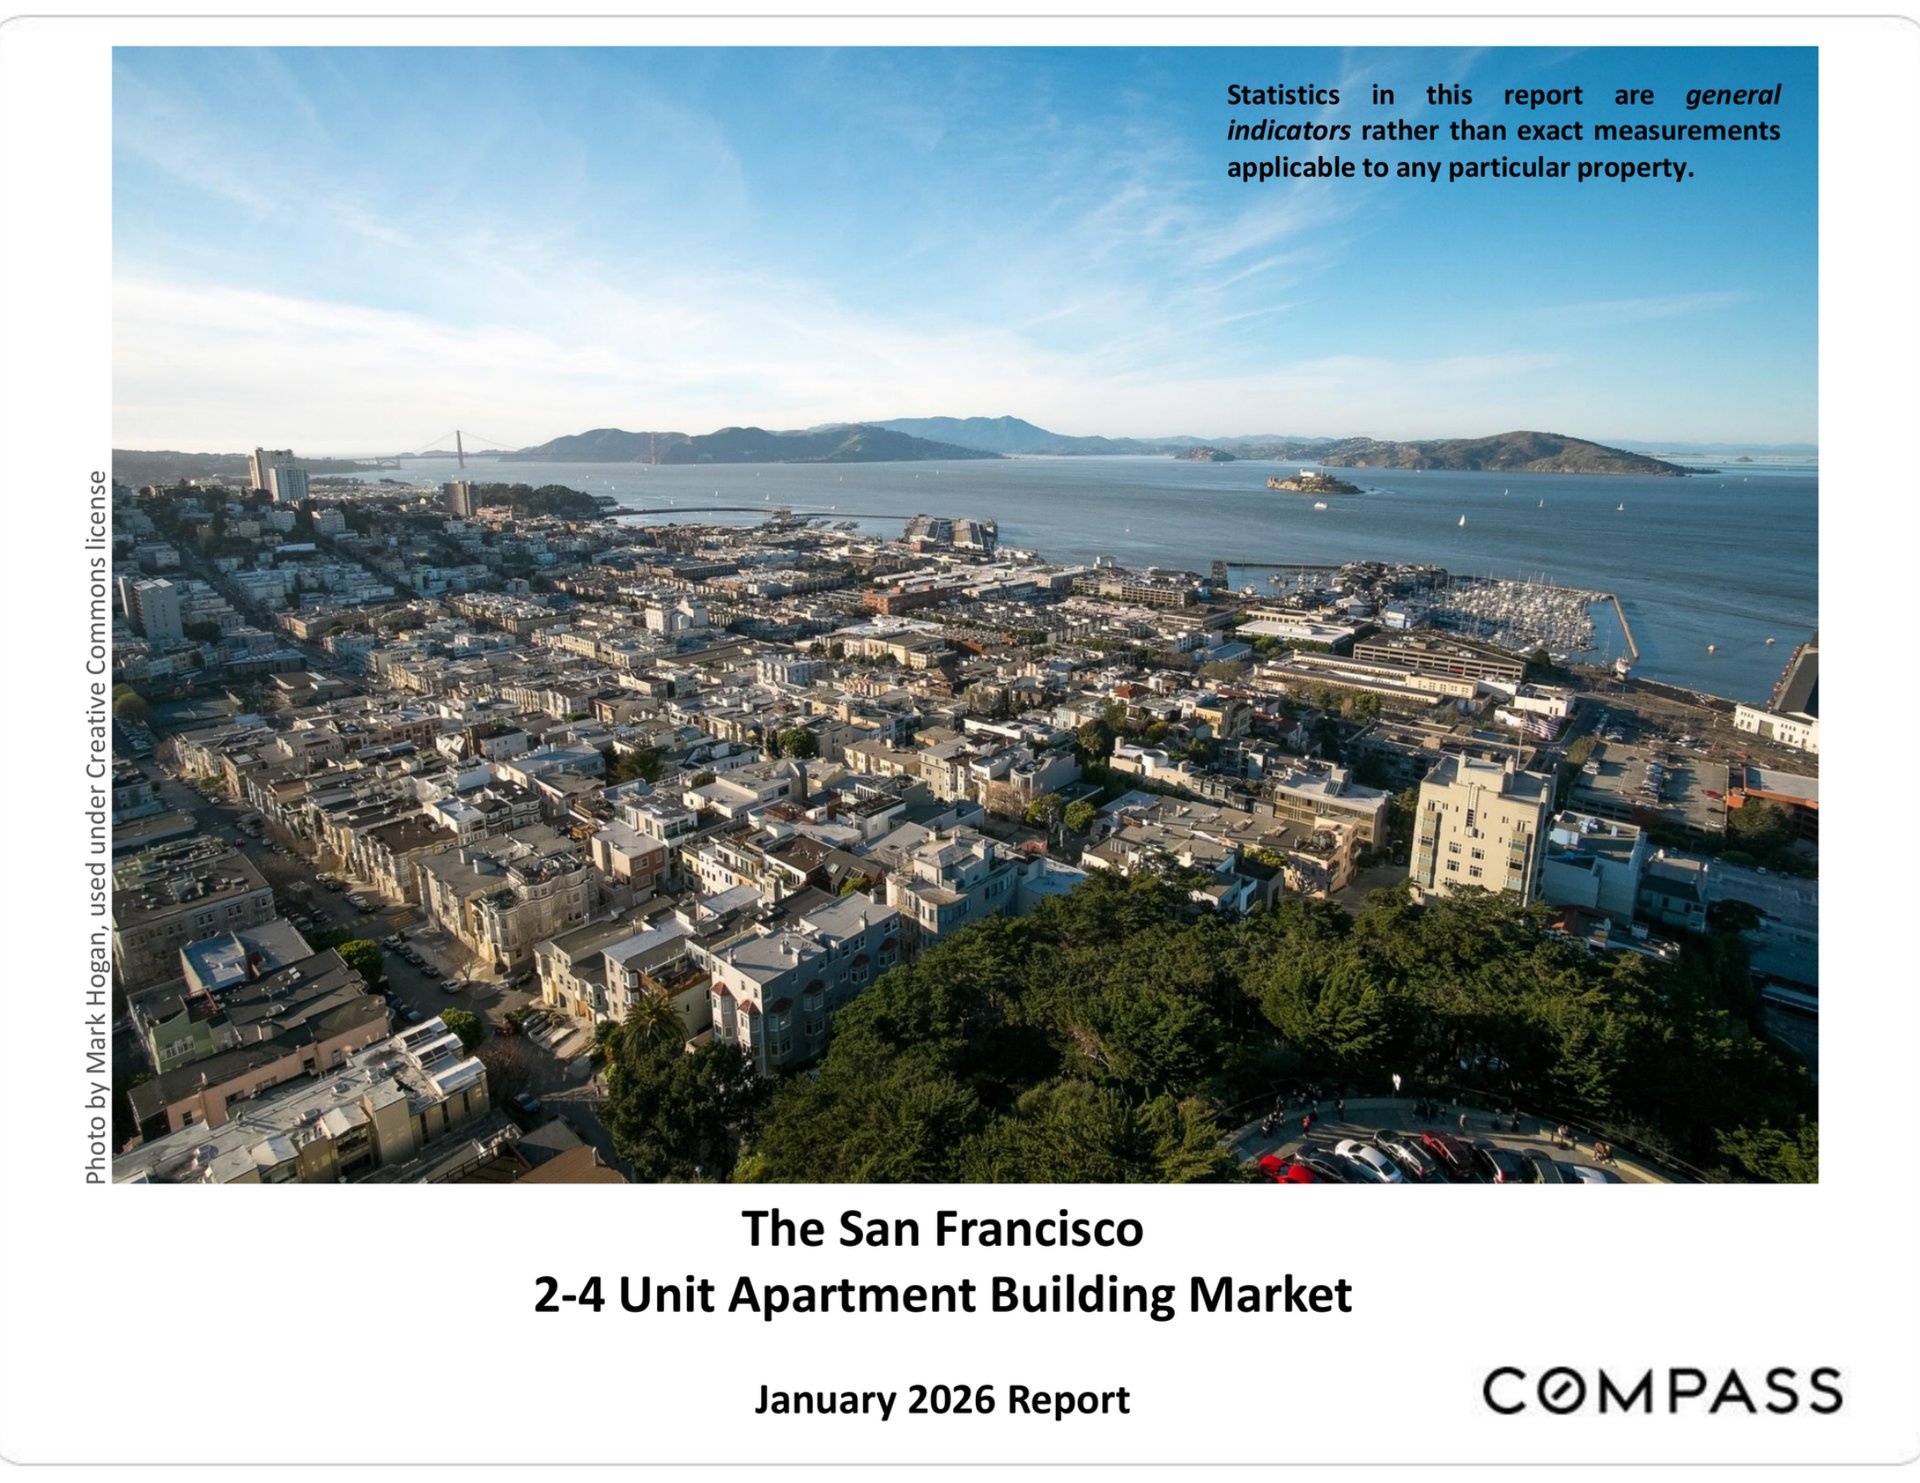
San Francisco 2-4 Unit Apartment Building Market, January 2026 Report cover with an aerial view of the city and bay.

Market report graphic describing San Francisco residential income market recovery, with Compass branding.

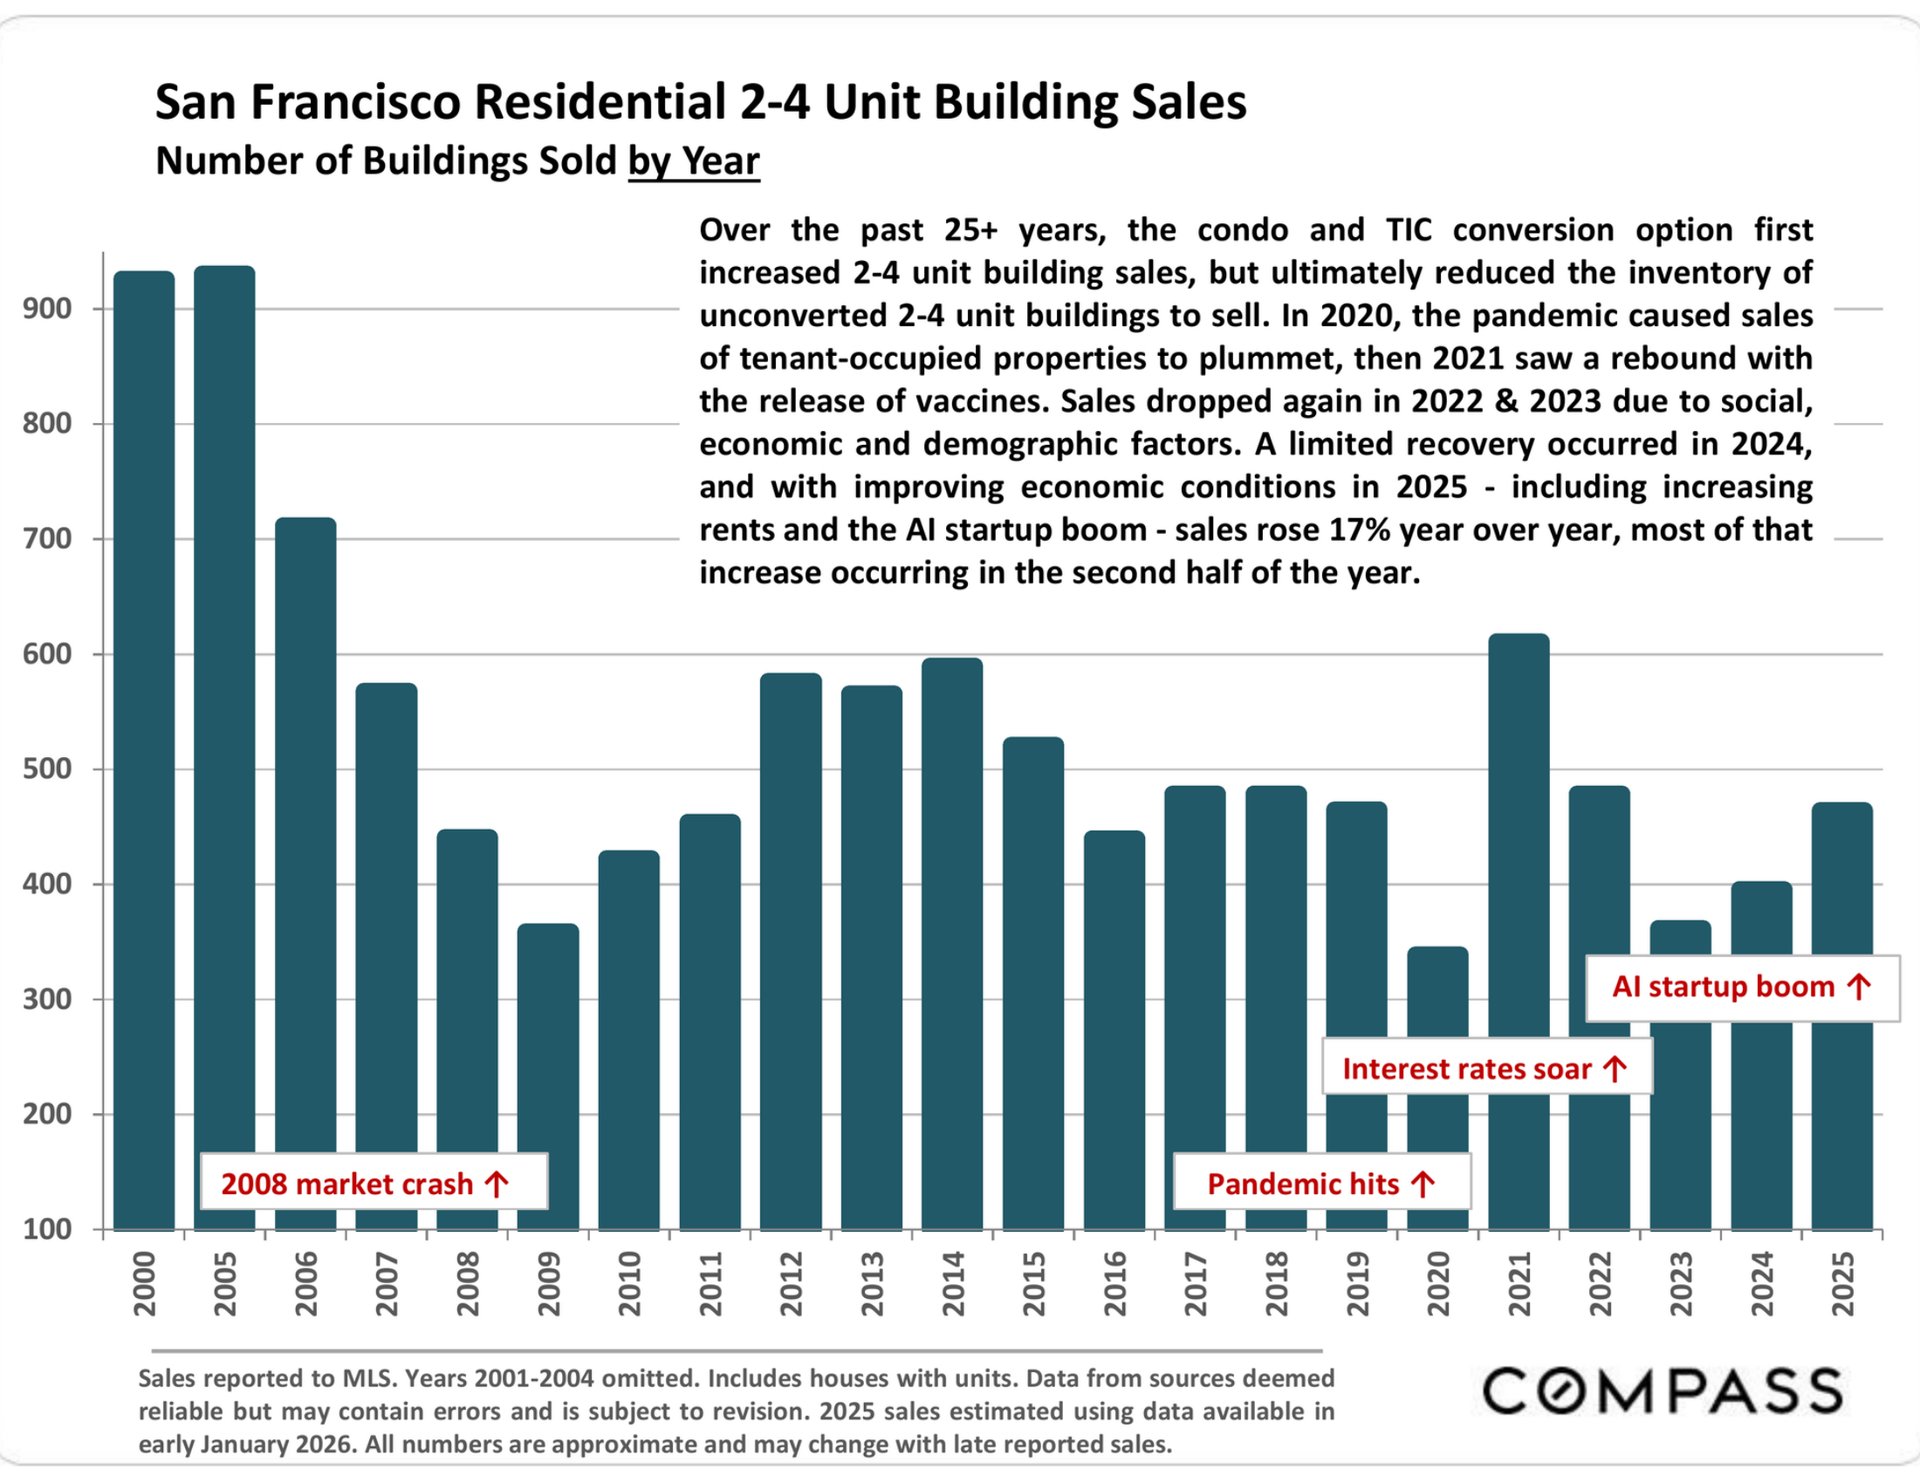
Chart of San Francisco 2–4 unit building sales by year, with sales history from 2000 to 2025 and market-event annotations.

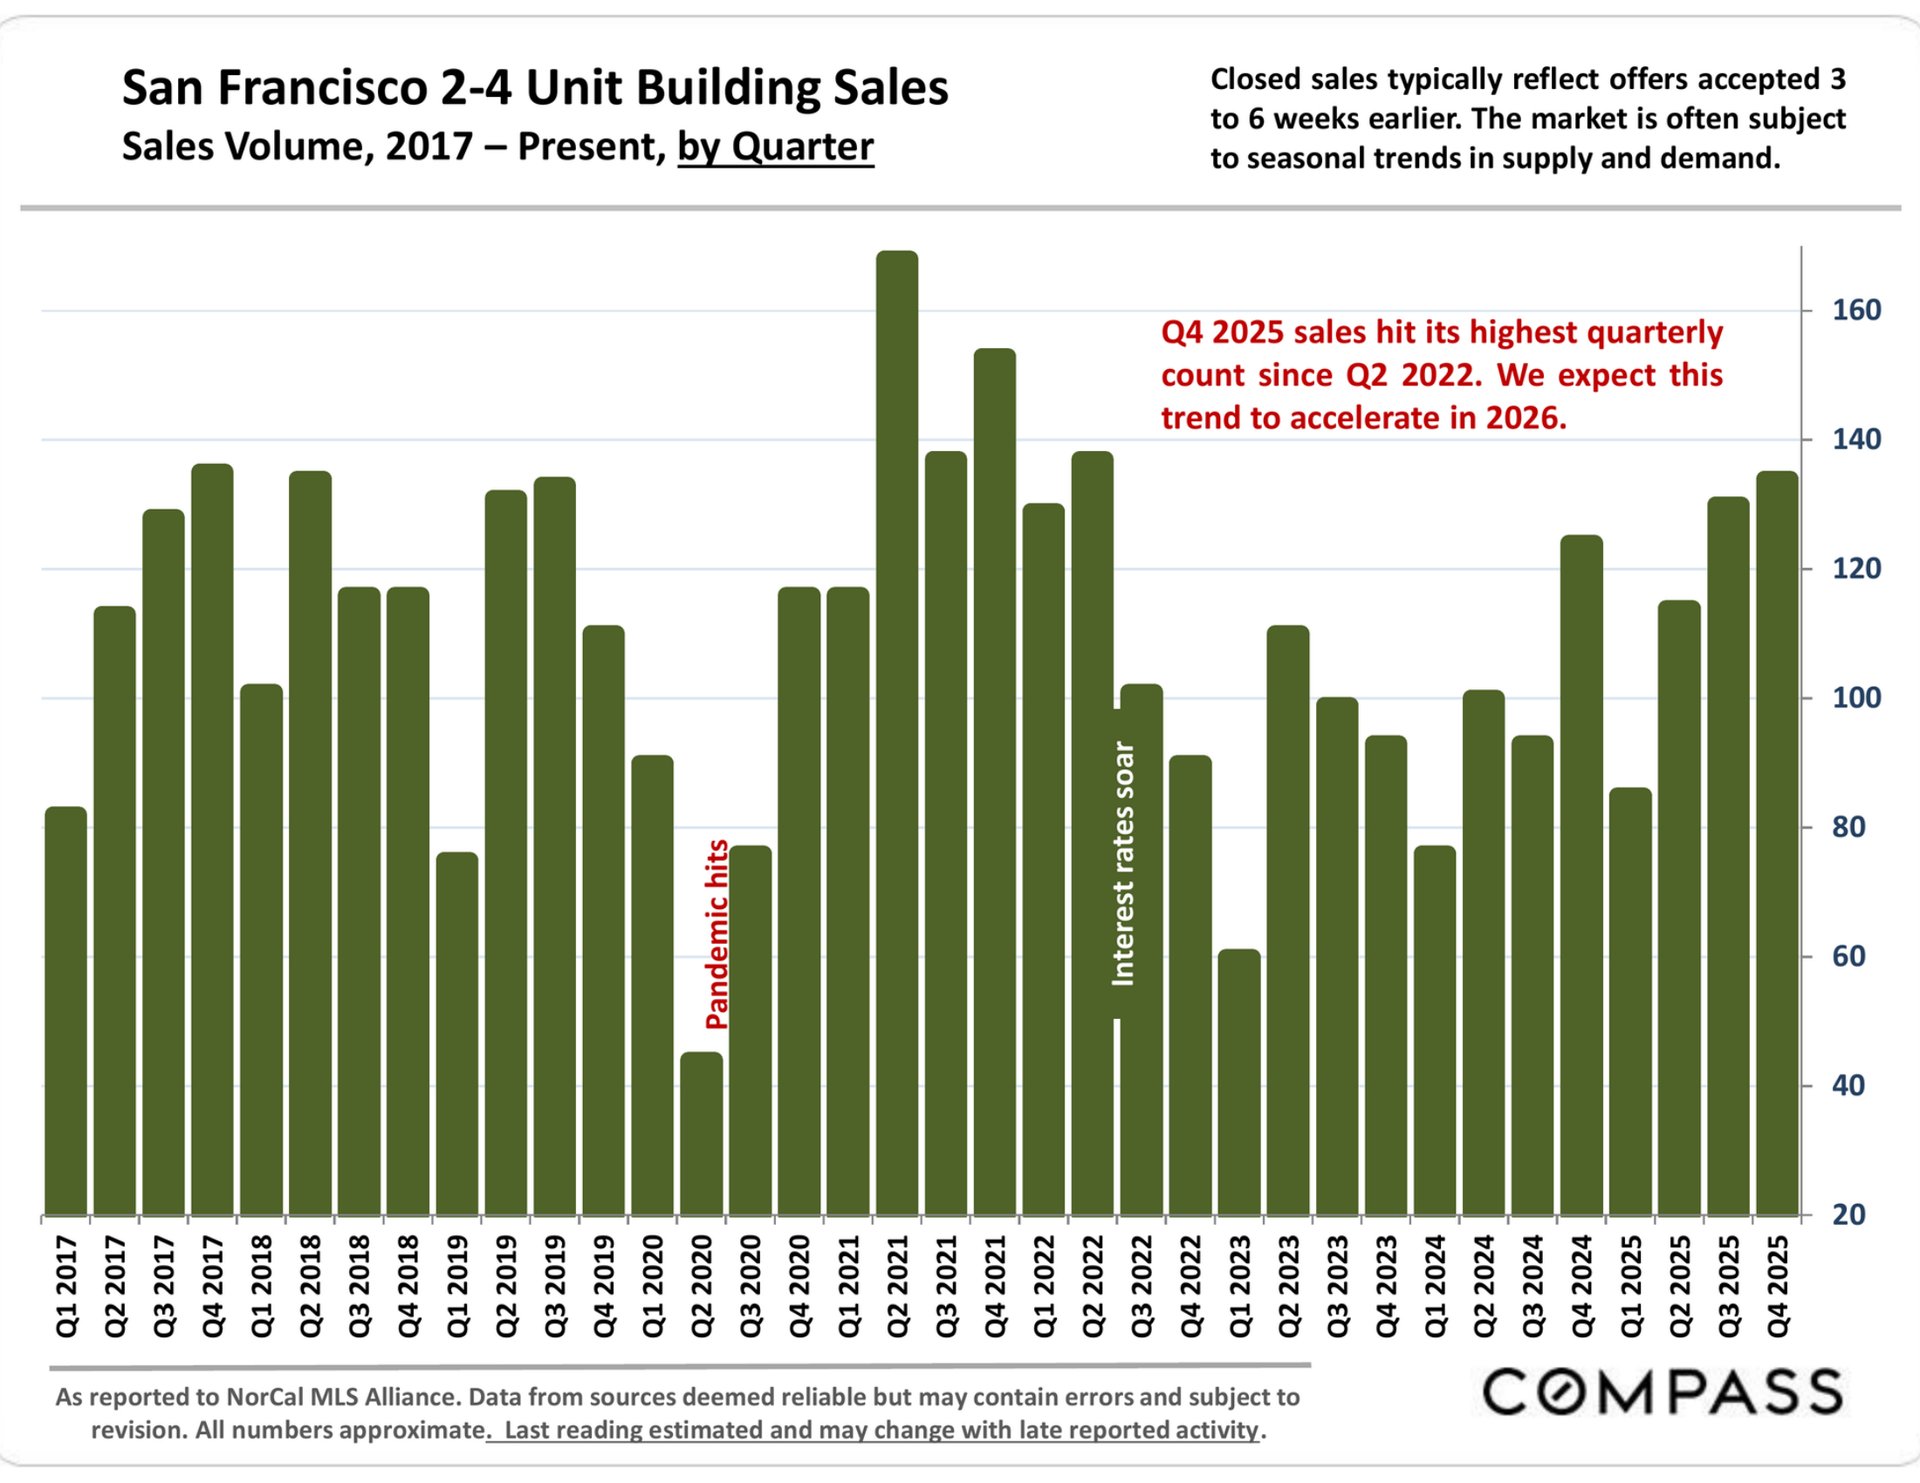
Chart of quarterly San Francisco 2–4 unit building sales from 2017 through Q4 2025, with pandemic and rate annotations.

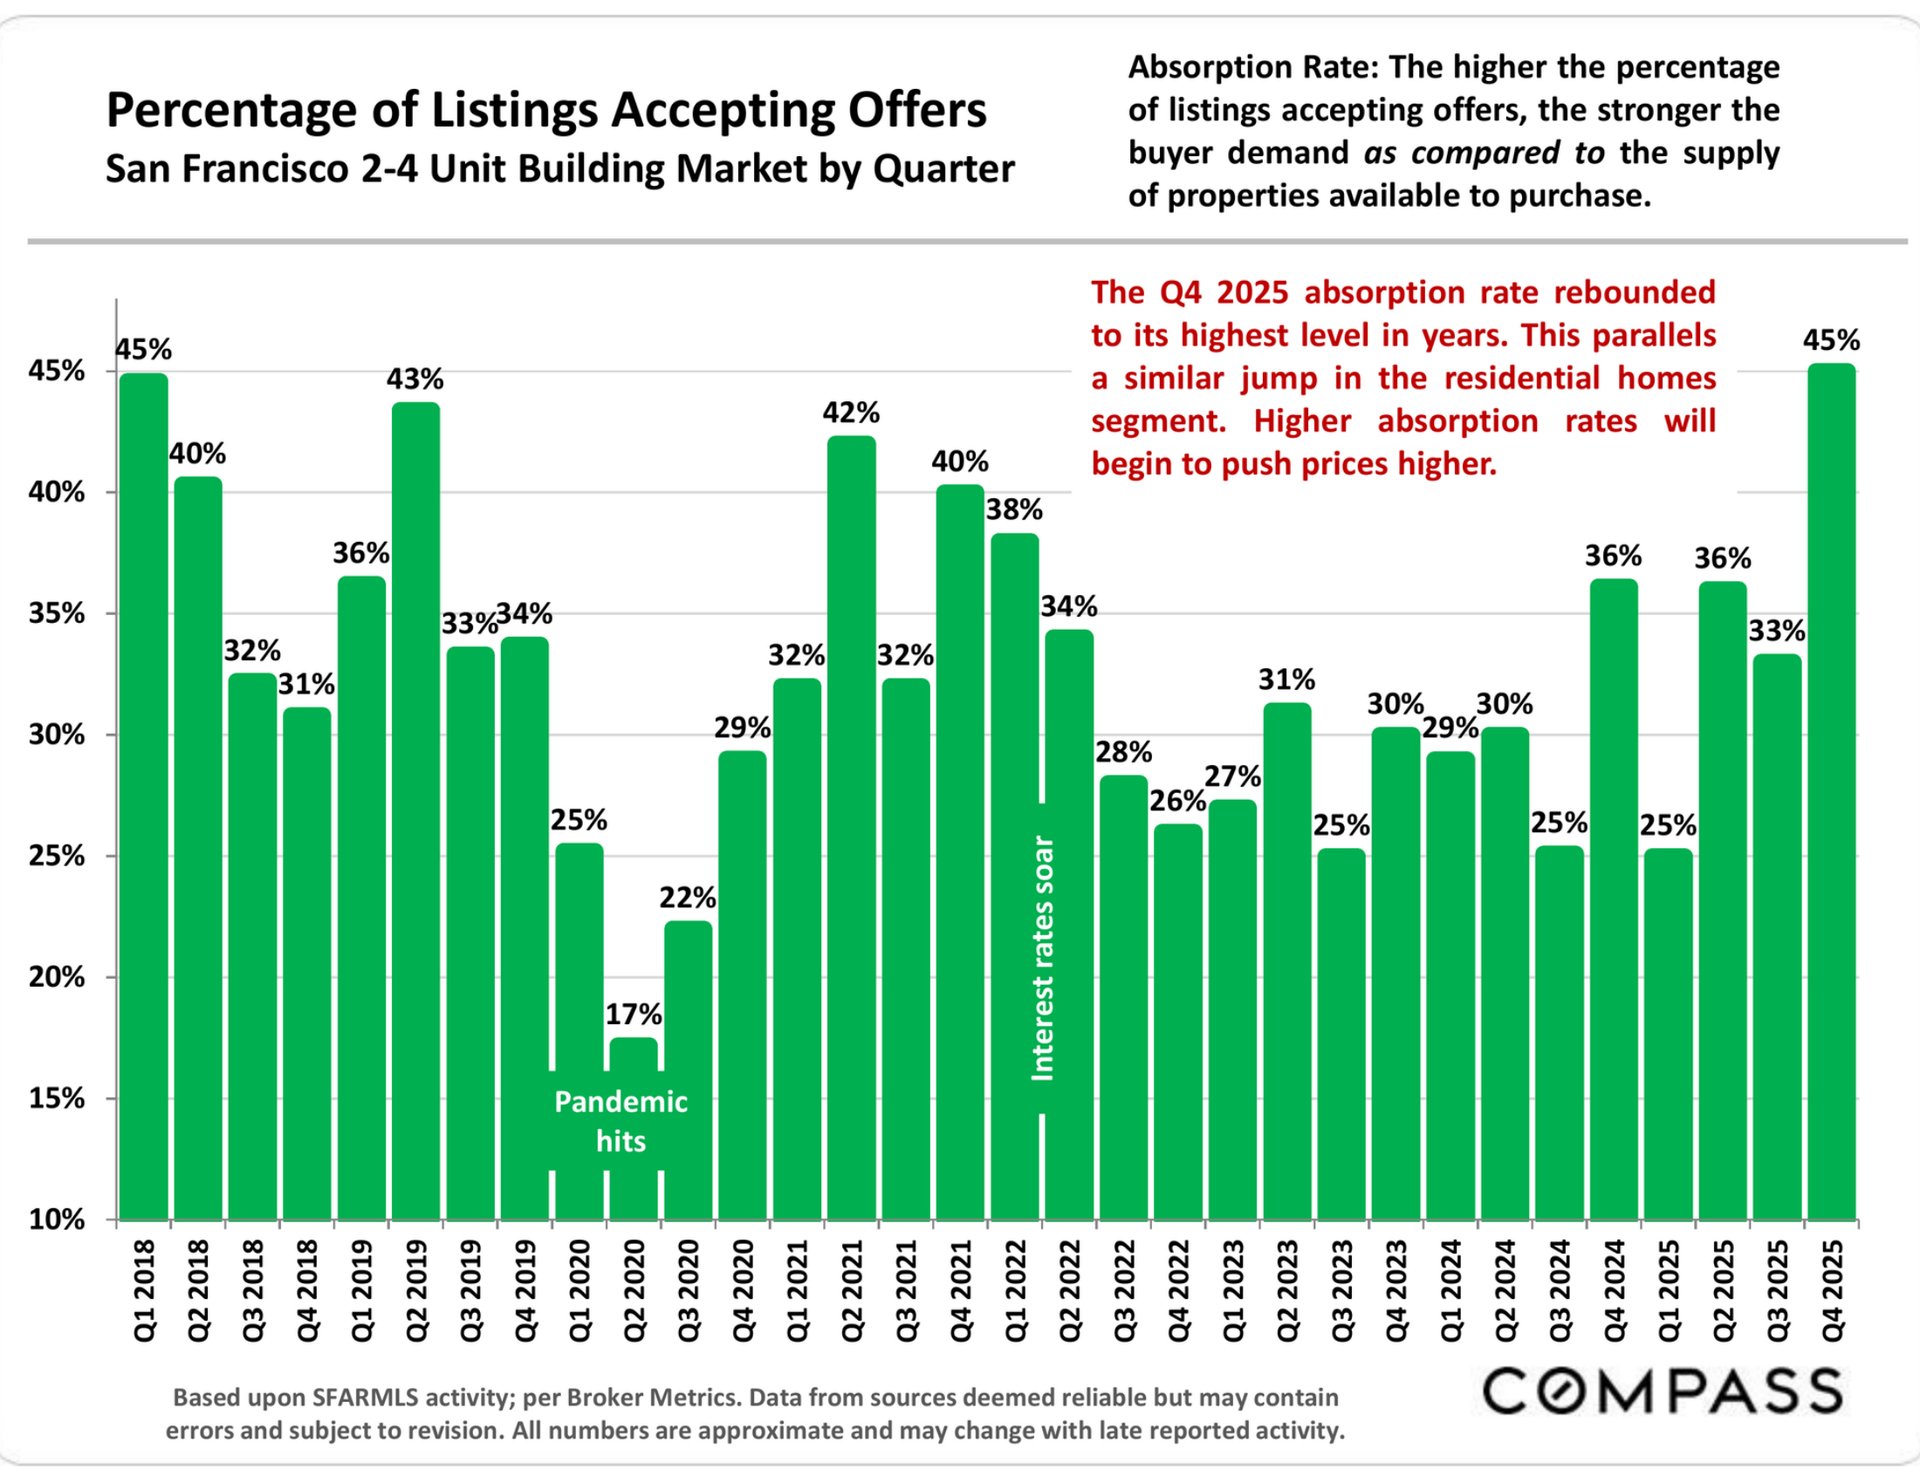
Chart of San Francisco 2–4 unit listings accepting offers by quarter; the rate rebounded to 45% in Q4 2025.

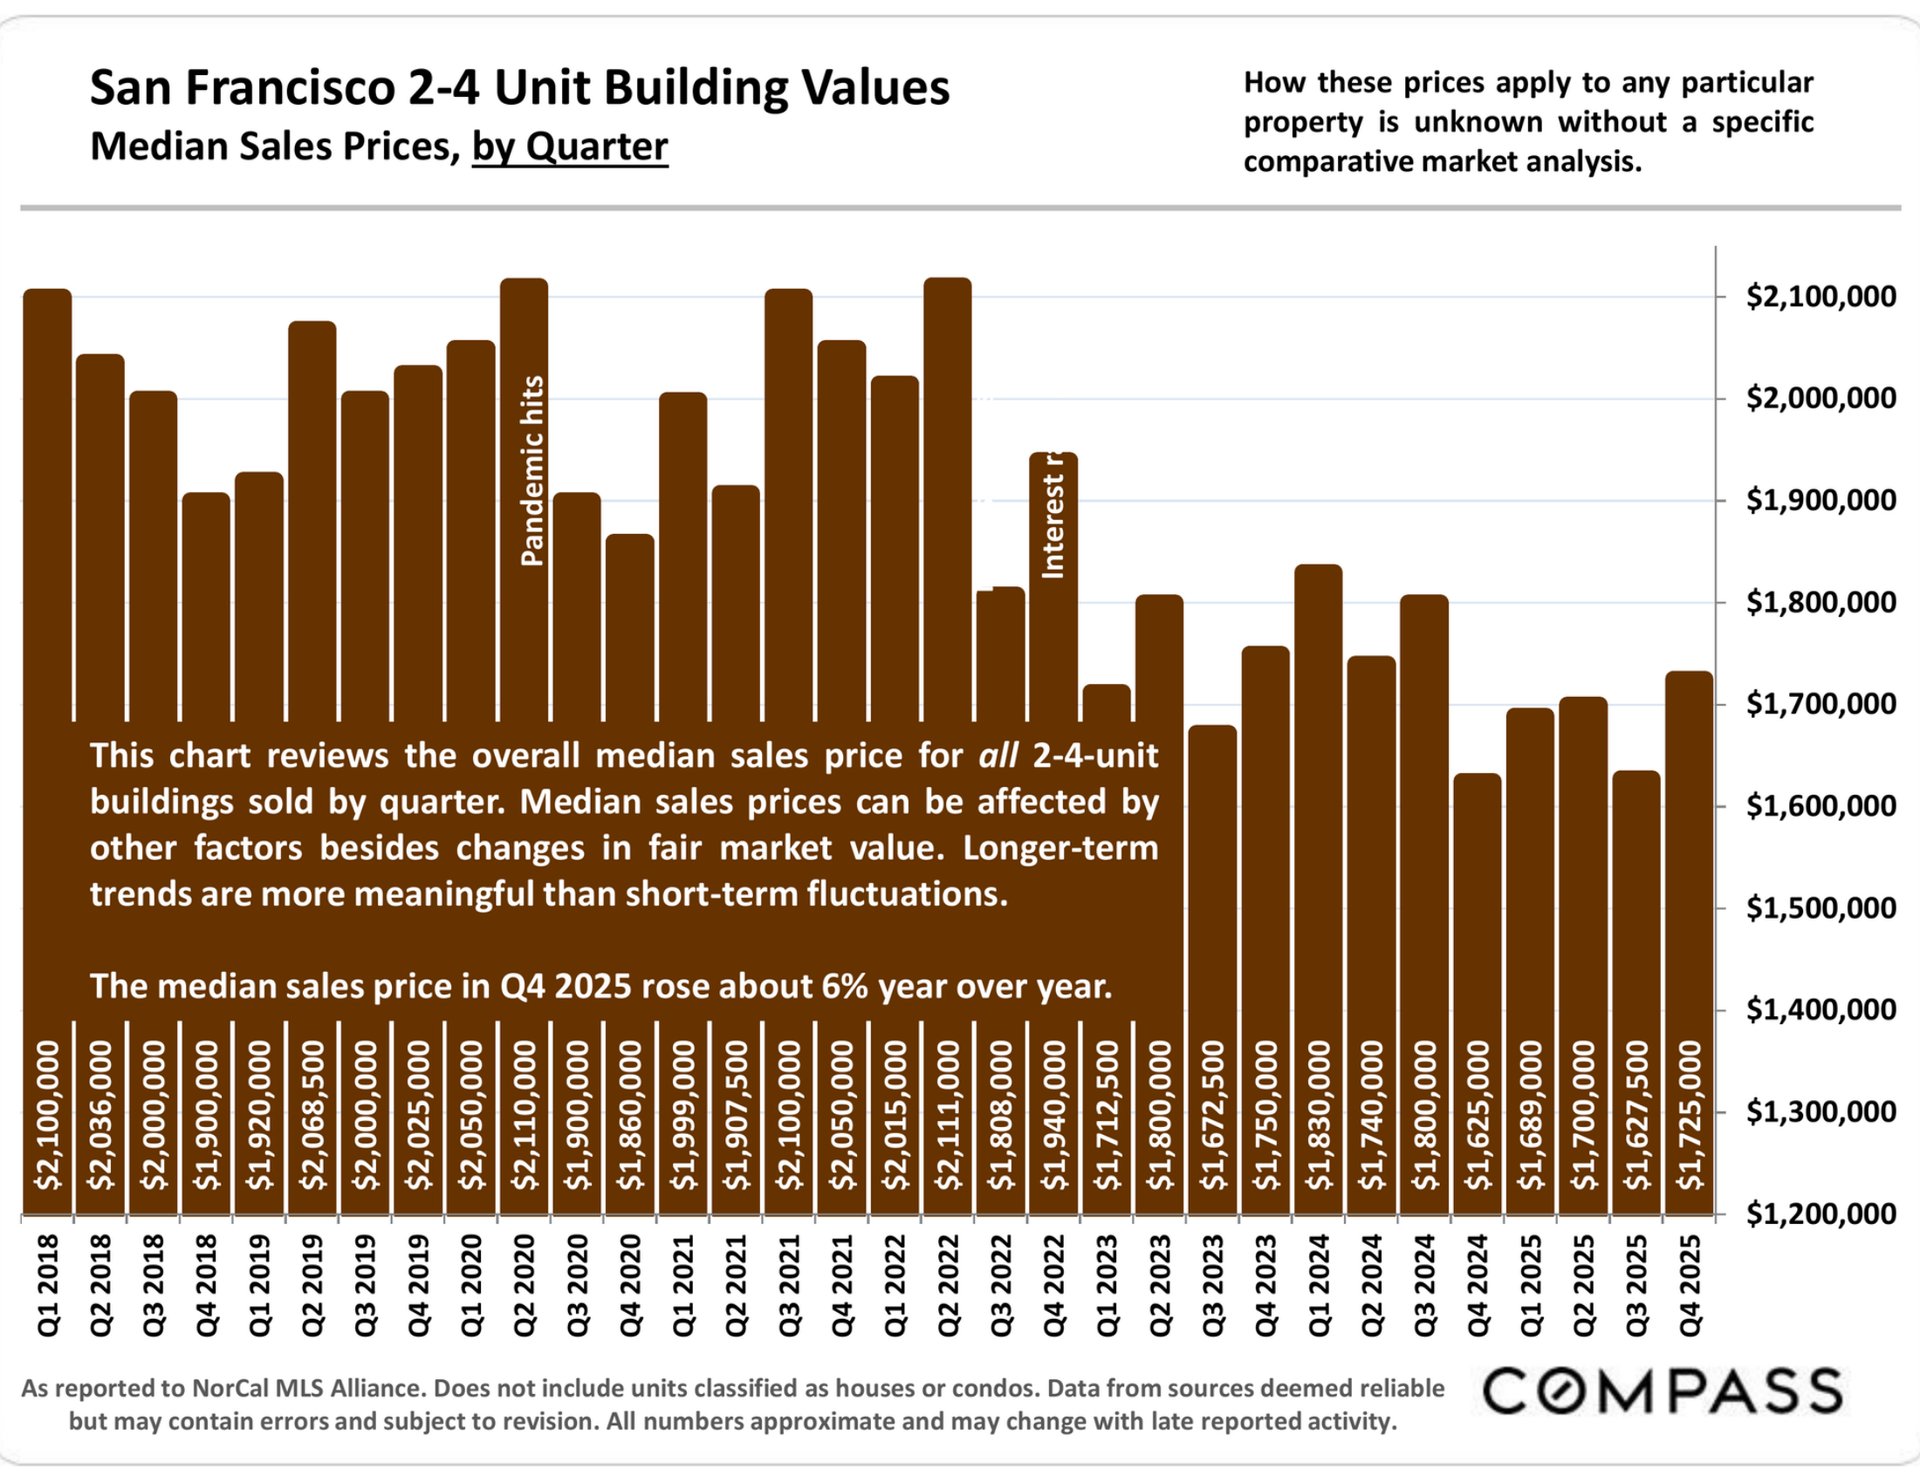
Chart of San Francisco 2-4-unit building median sale prices by quarter, 2018–2025; Q4 2025 rose about 6% year over year.

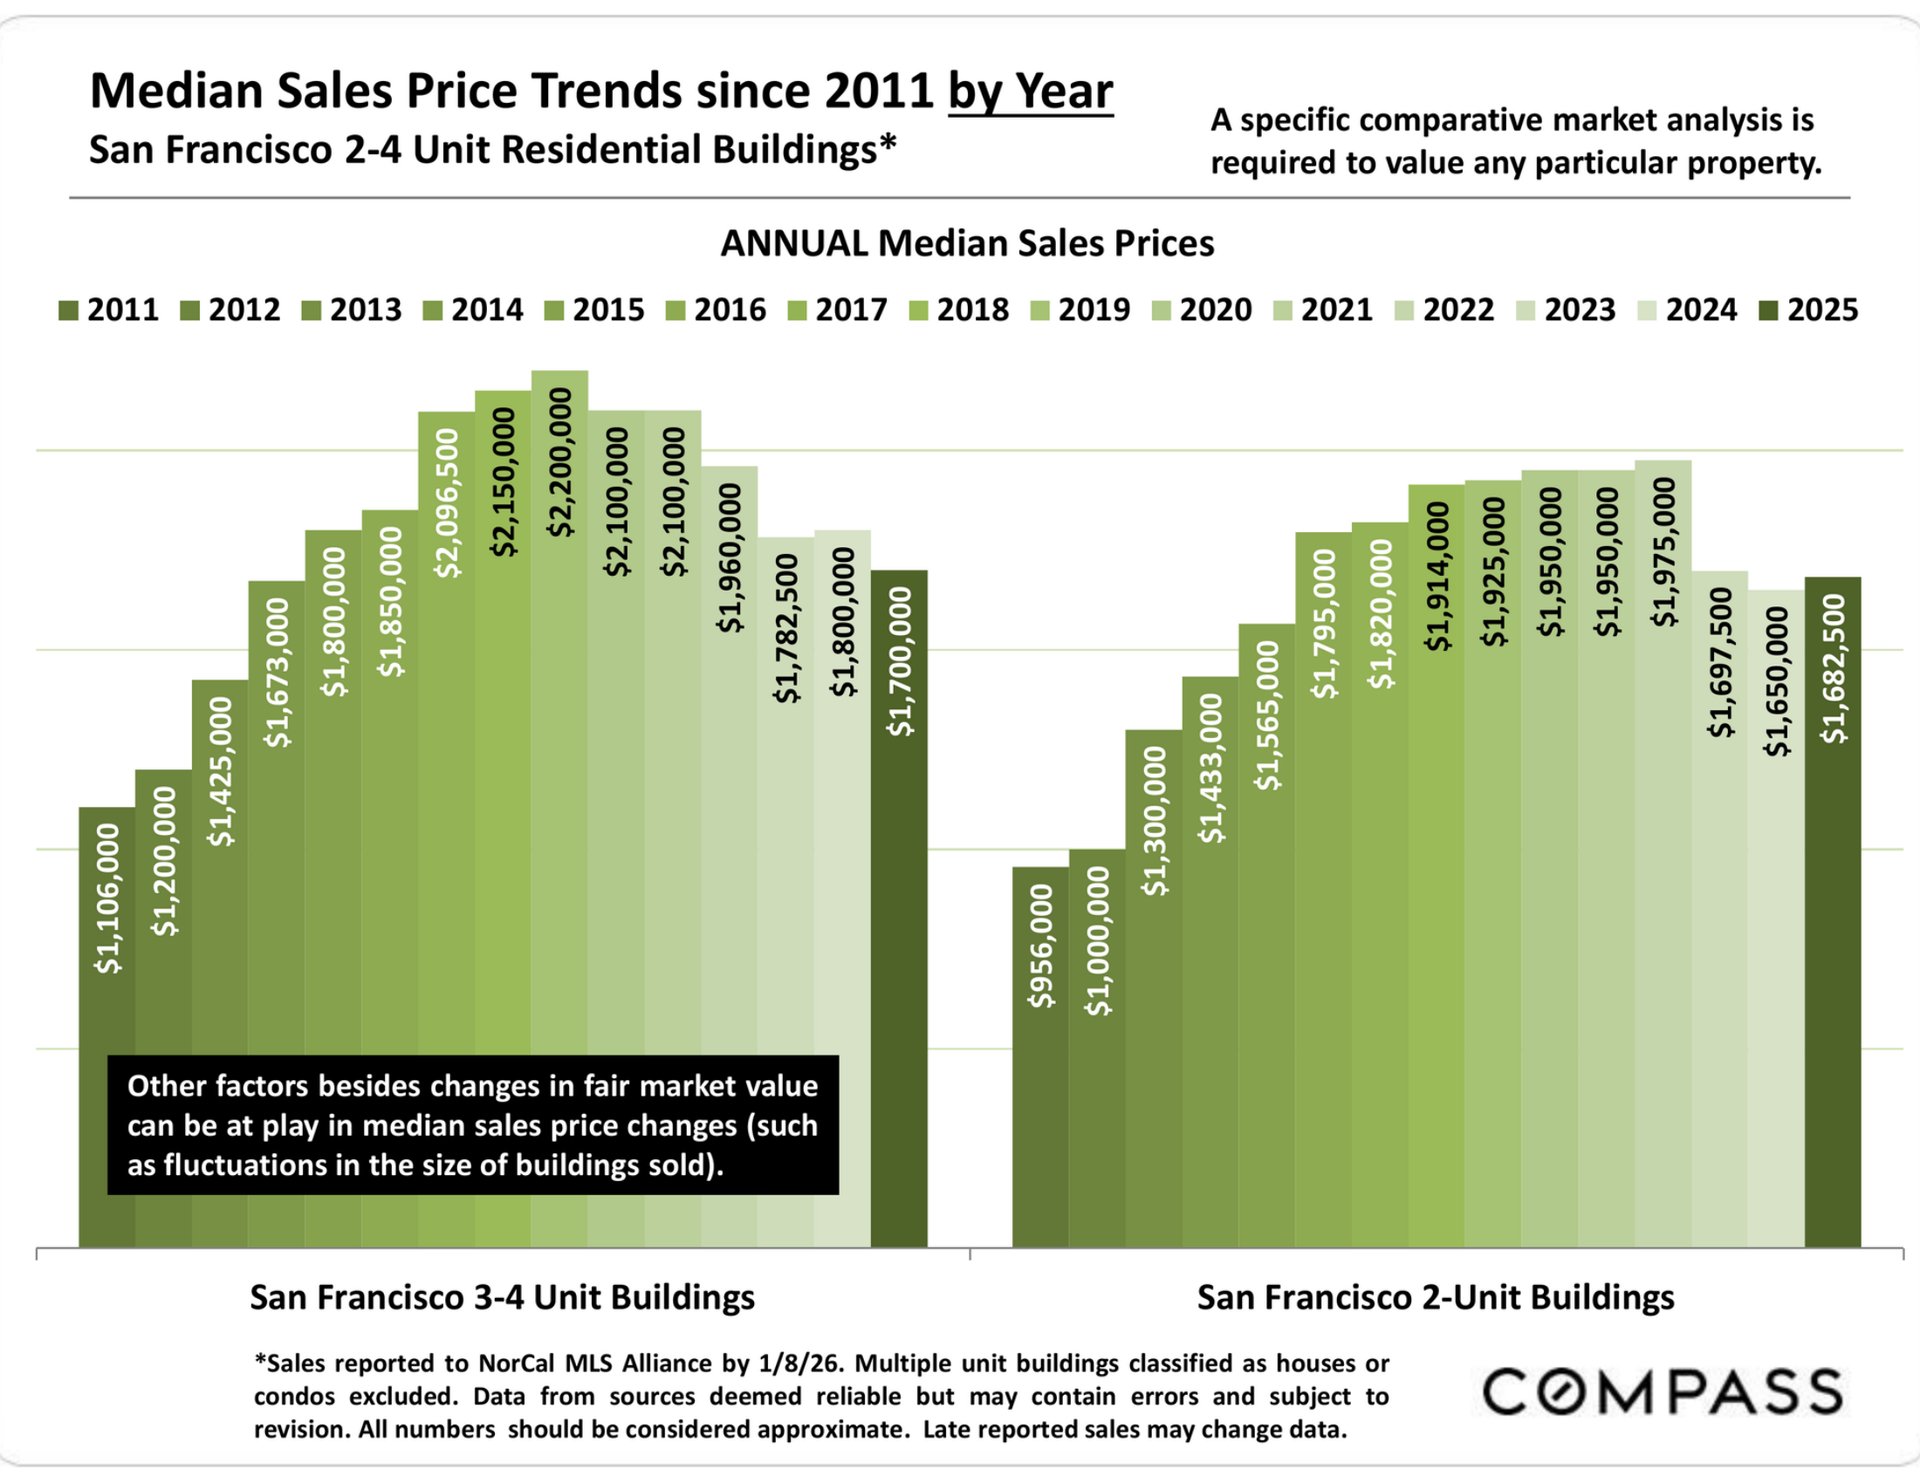
Chart comparing annual median sale prices for San Francisco 3–4-unit and 2-unit buildings, 2011–2025.

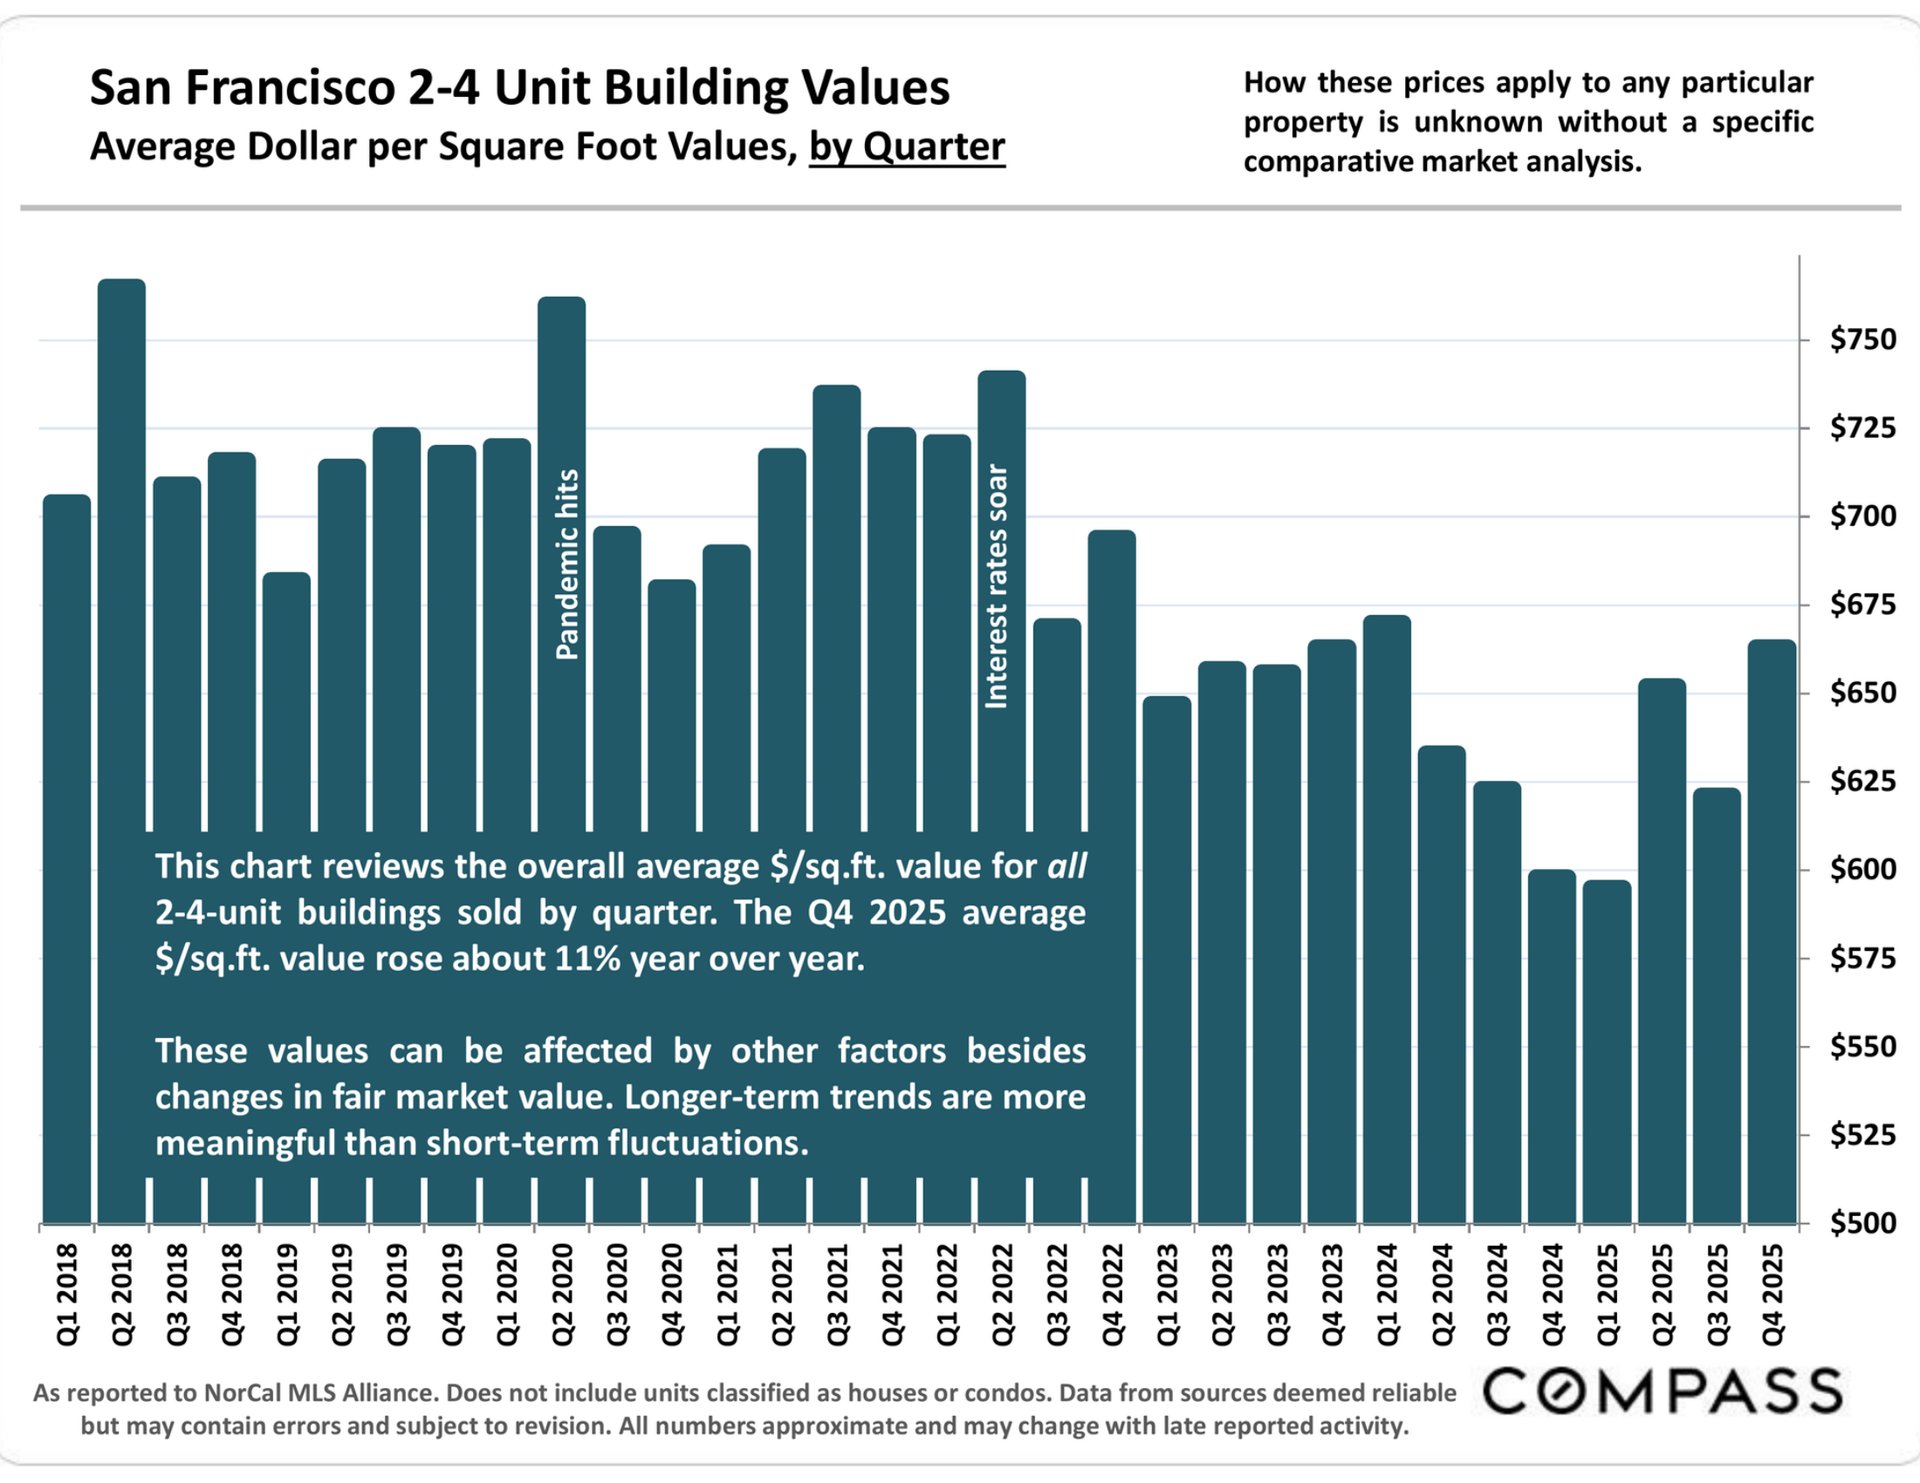
Chart of average San Francisco 2-4-unit building value per square foot by quarter, 2018–2025, with a 2025 rebound.

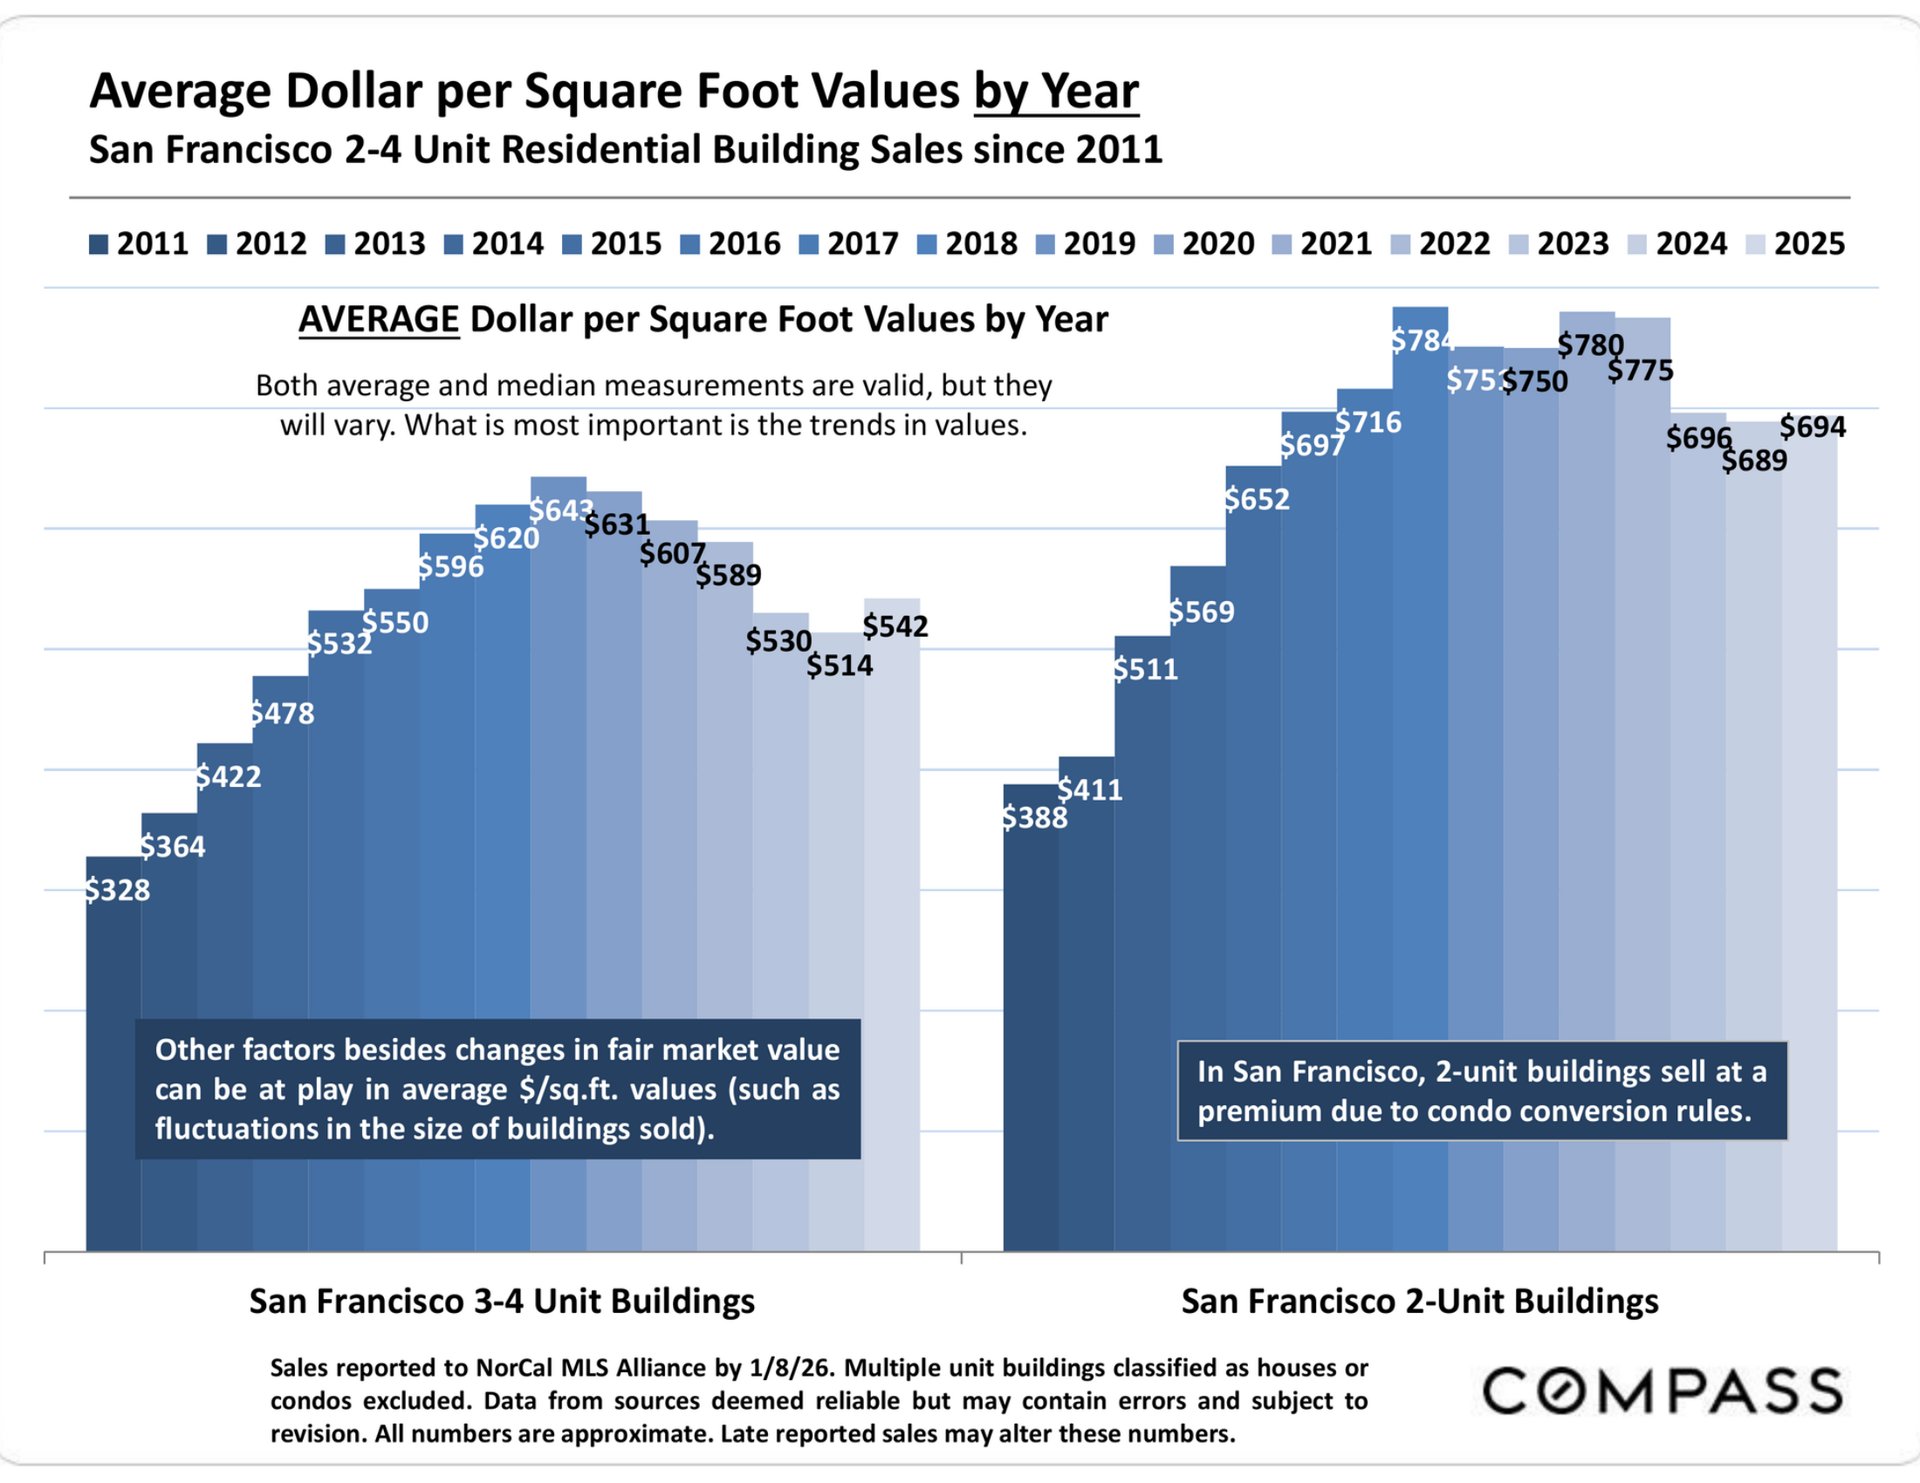
Chart comparing average price per square foot for San Francisco two-unit and three-to-four-unit buildings, 2011–2025.

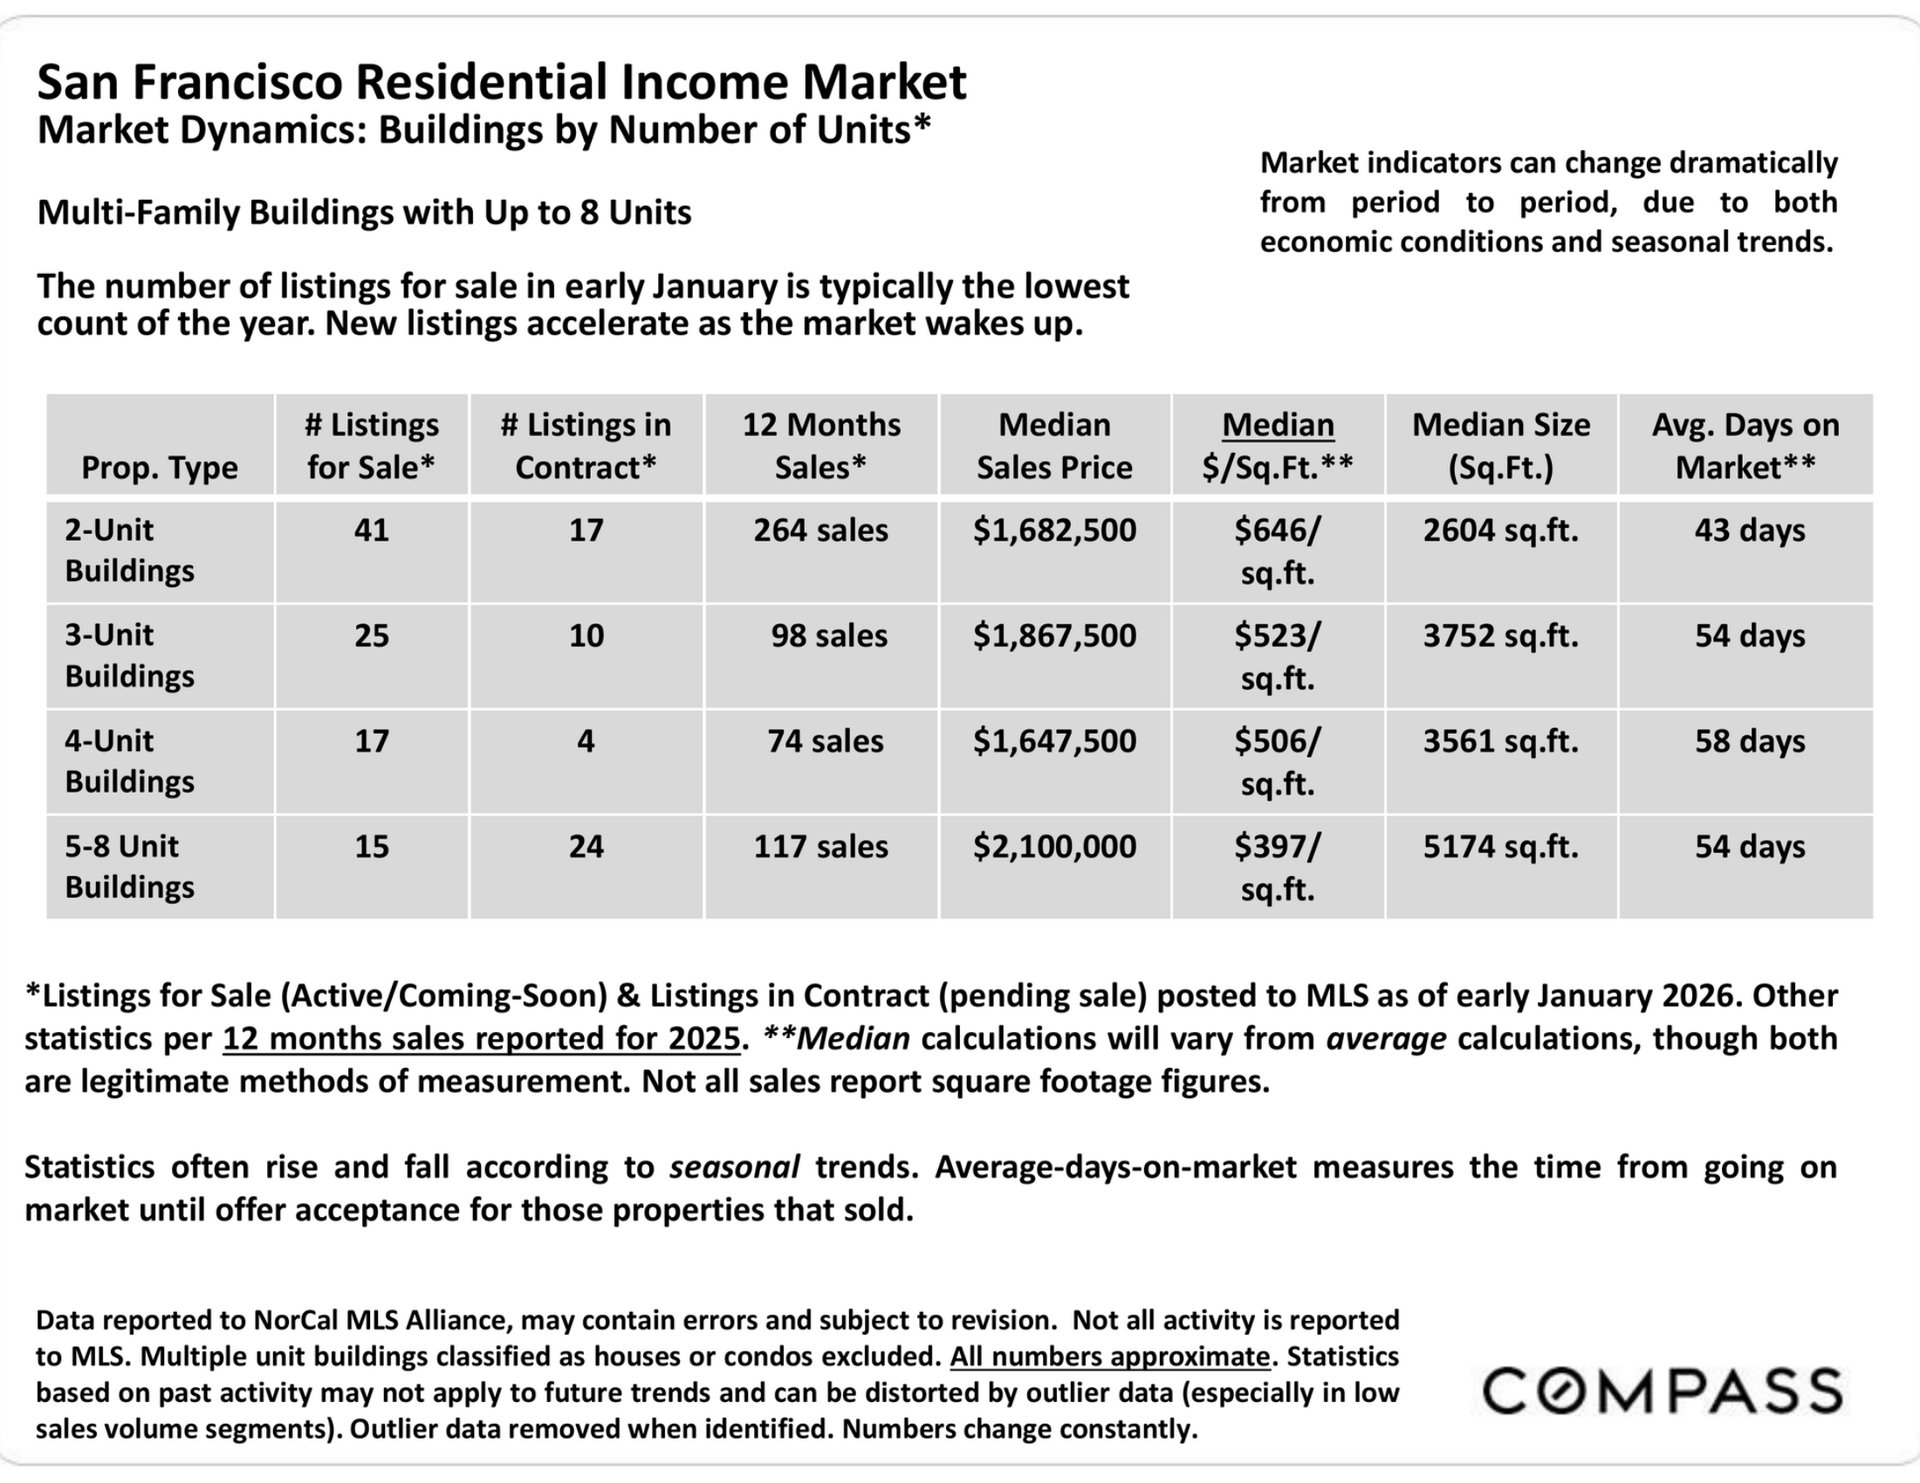
San Francisco multifamily market report table comparing listings, sales, prices, sizes, and days on market.

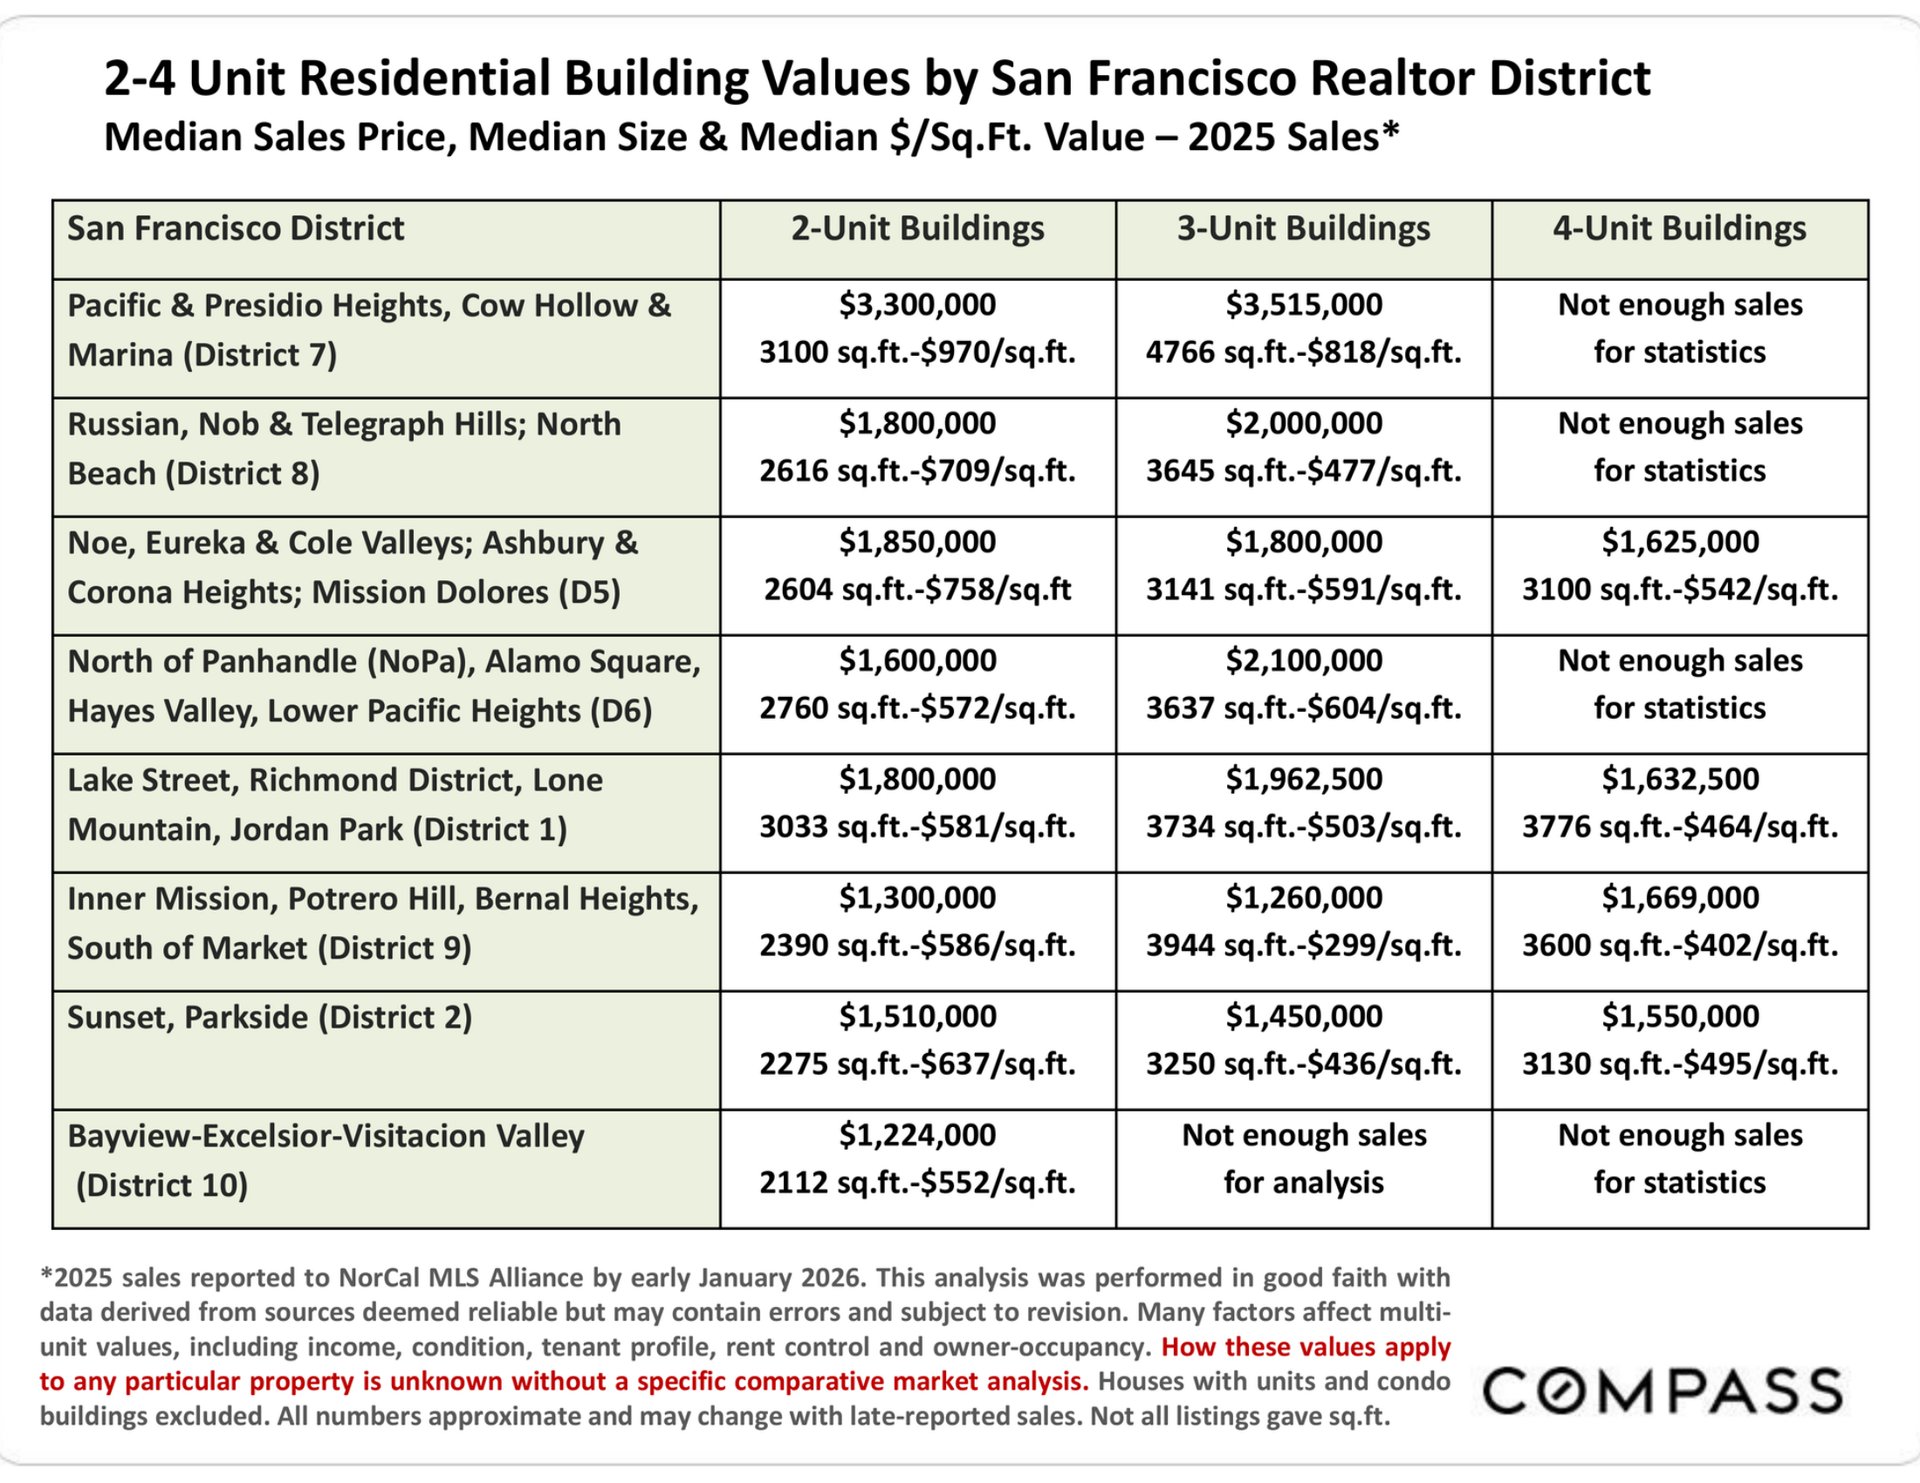
San Francisco 2025 two- to four-unit building sales table by district, with median prices, sizes, and price per square foot.

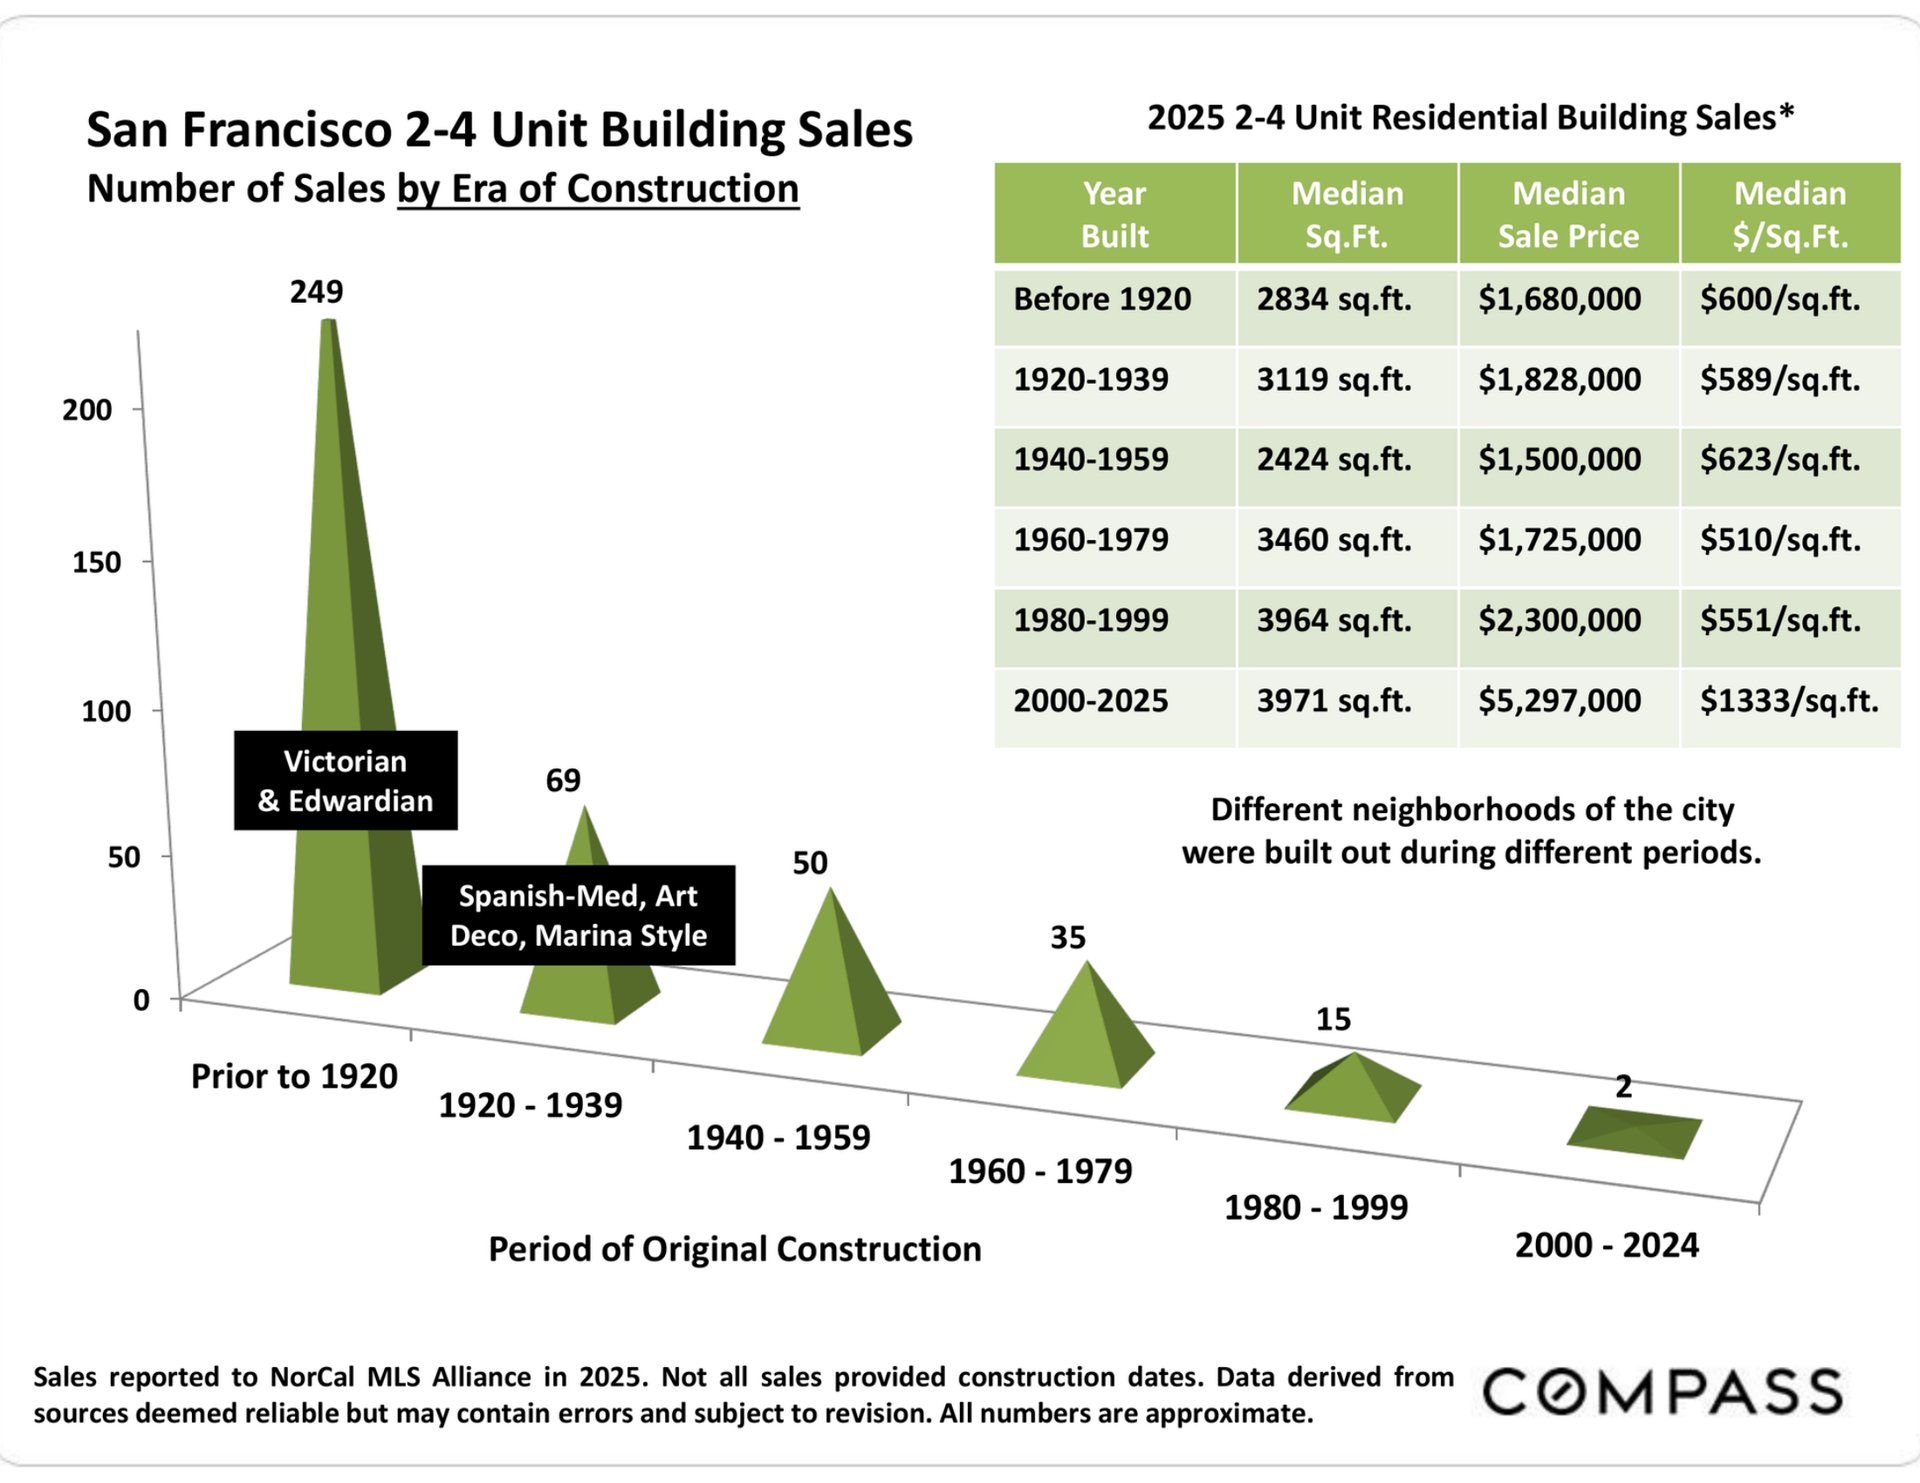
San Francisco 2–4 unit building sales infographic with construction-era chart and 2025 median price table.

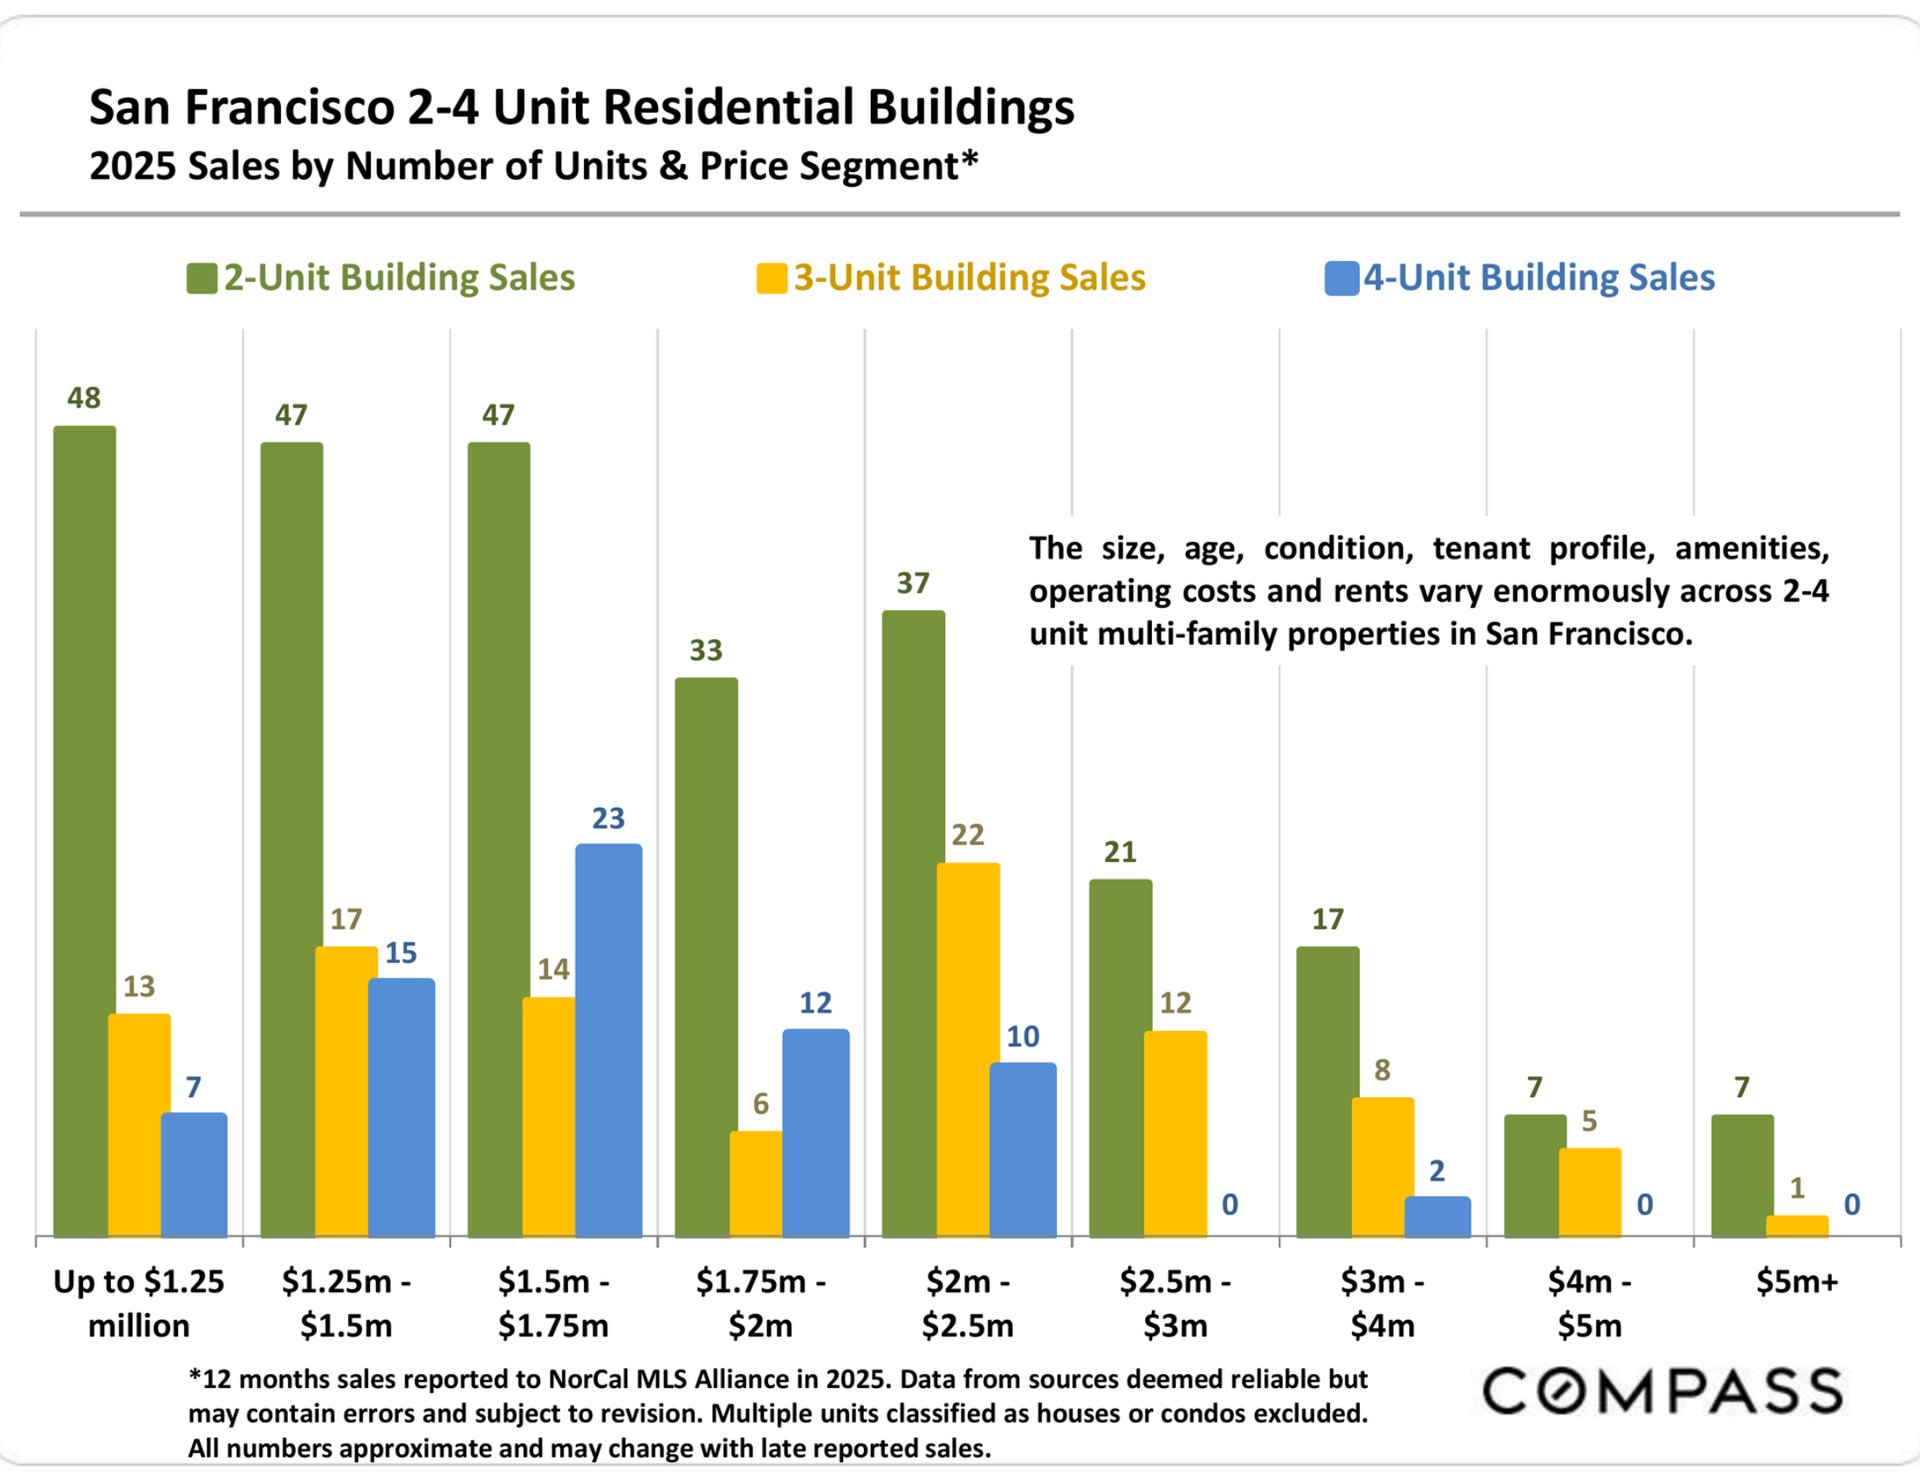
Chart comparing 2025 San Francisco 2-, 3-, and 4-unit building sales across price ranges.

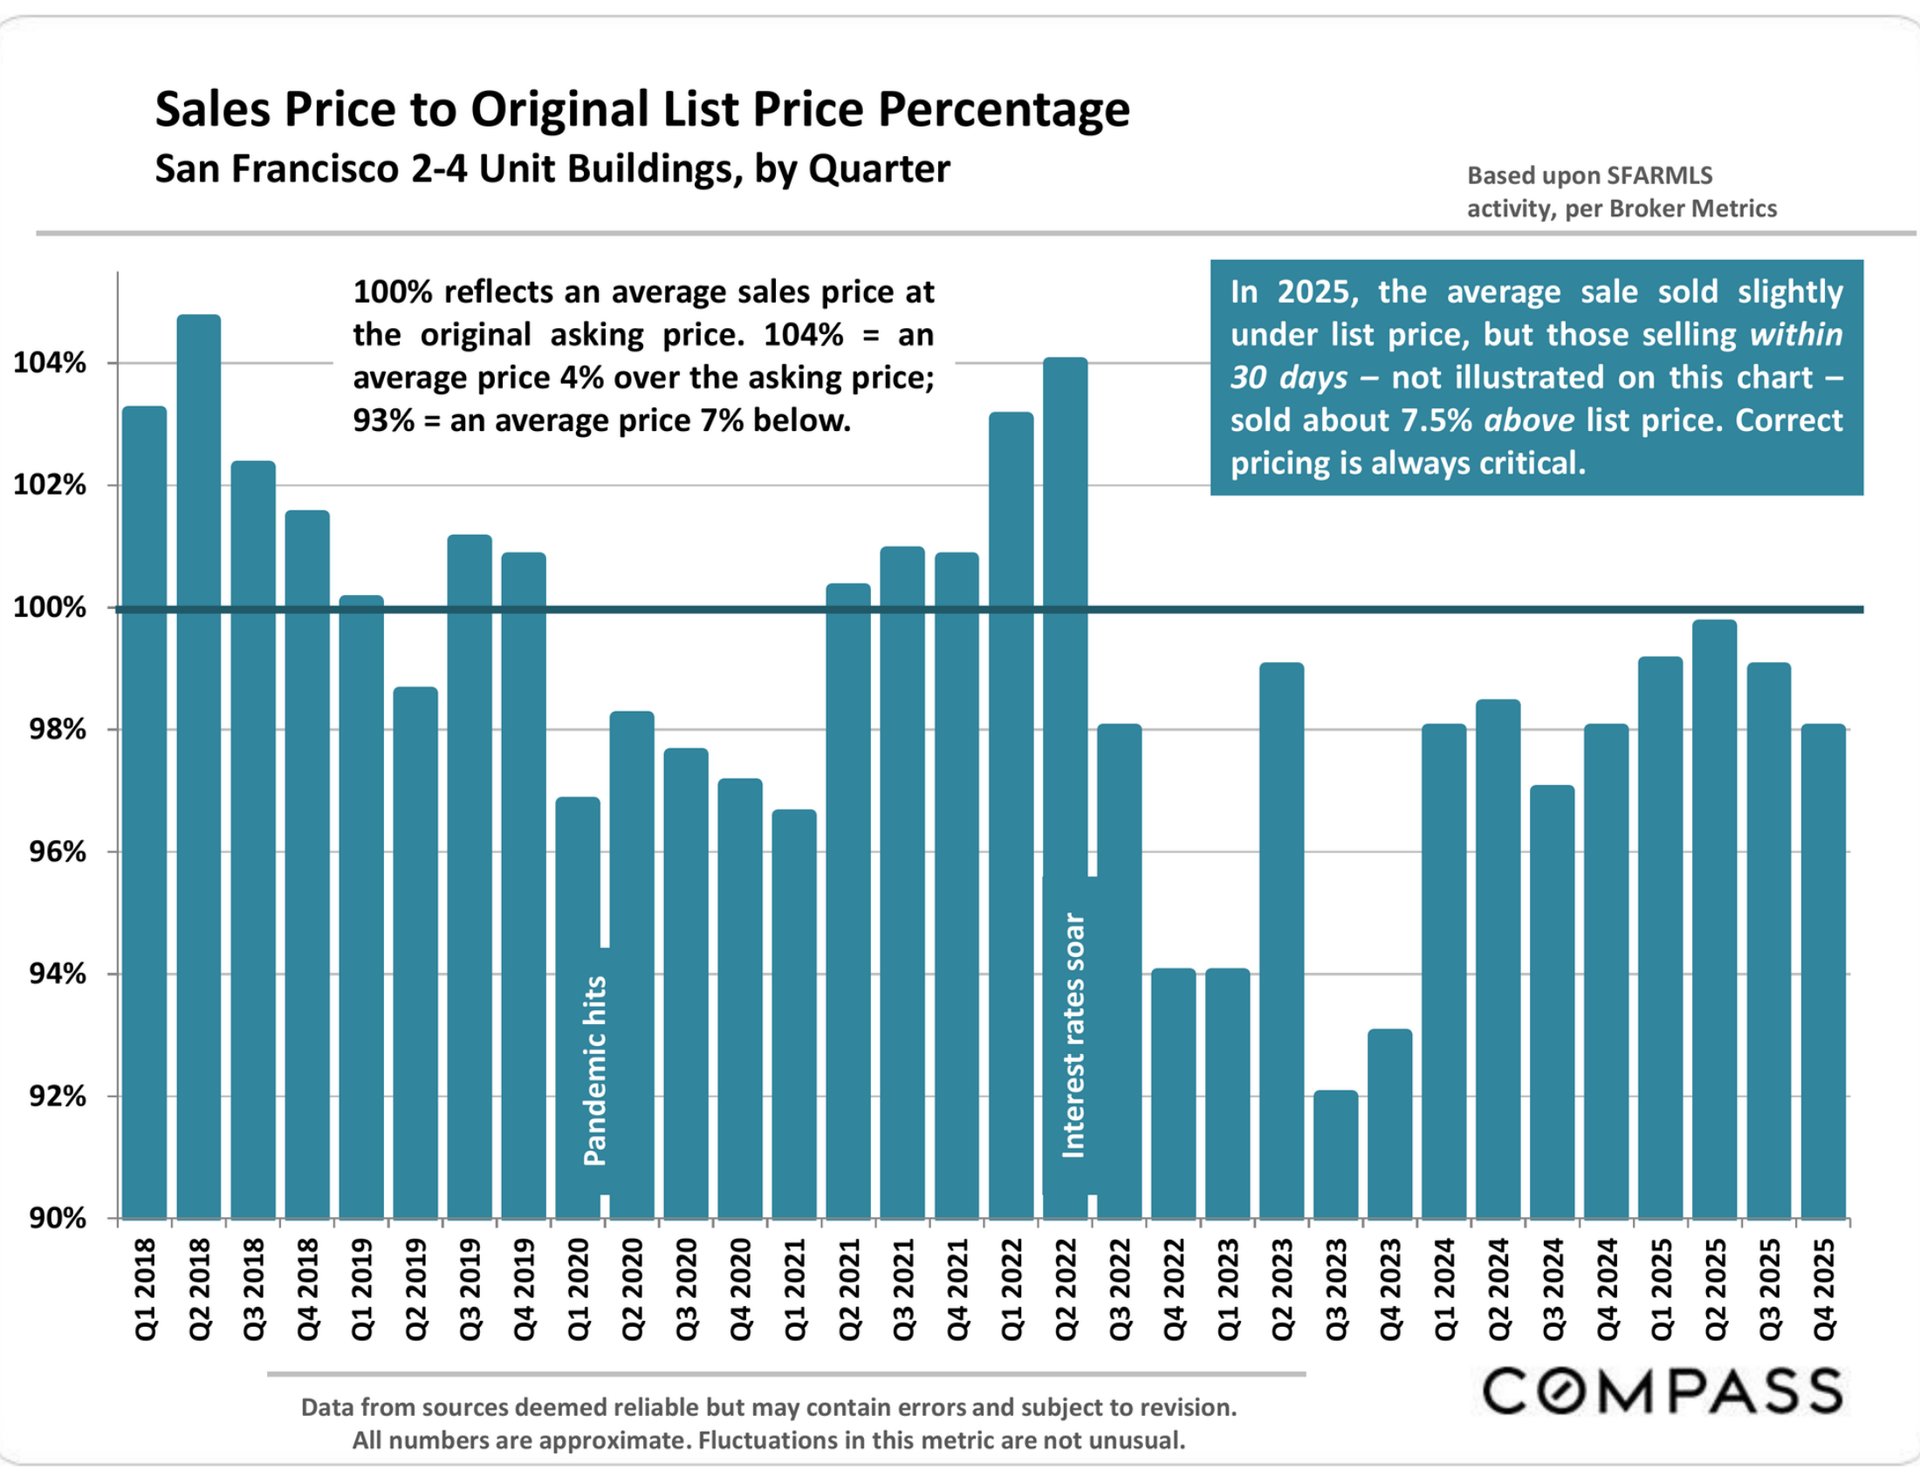
Quarterly San Francisco 2–4 unit building sale prices as a percentage of original list price, 2018–2025.

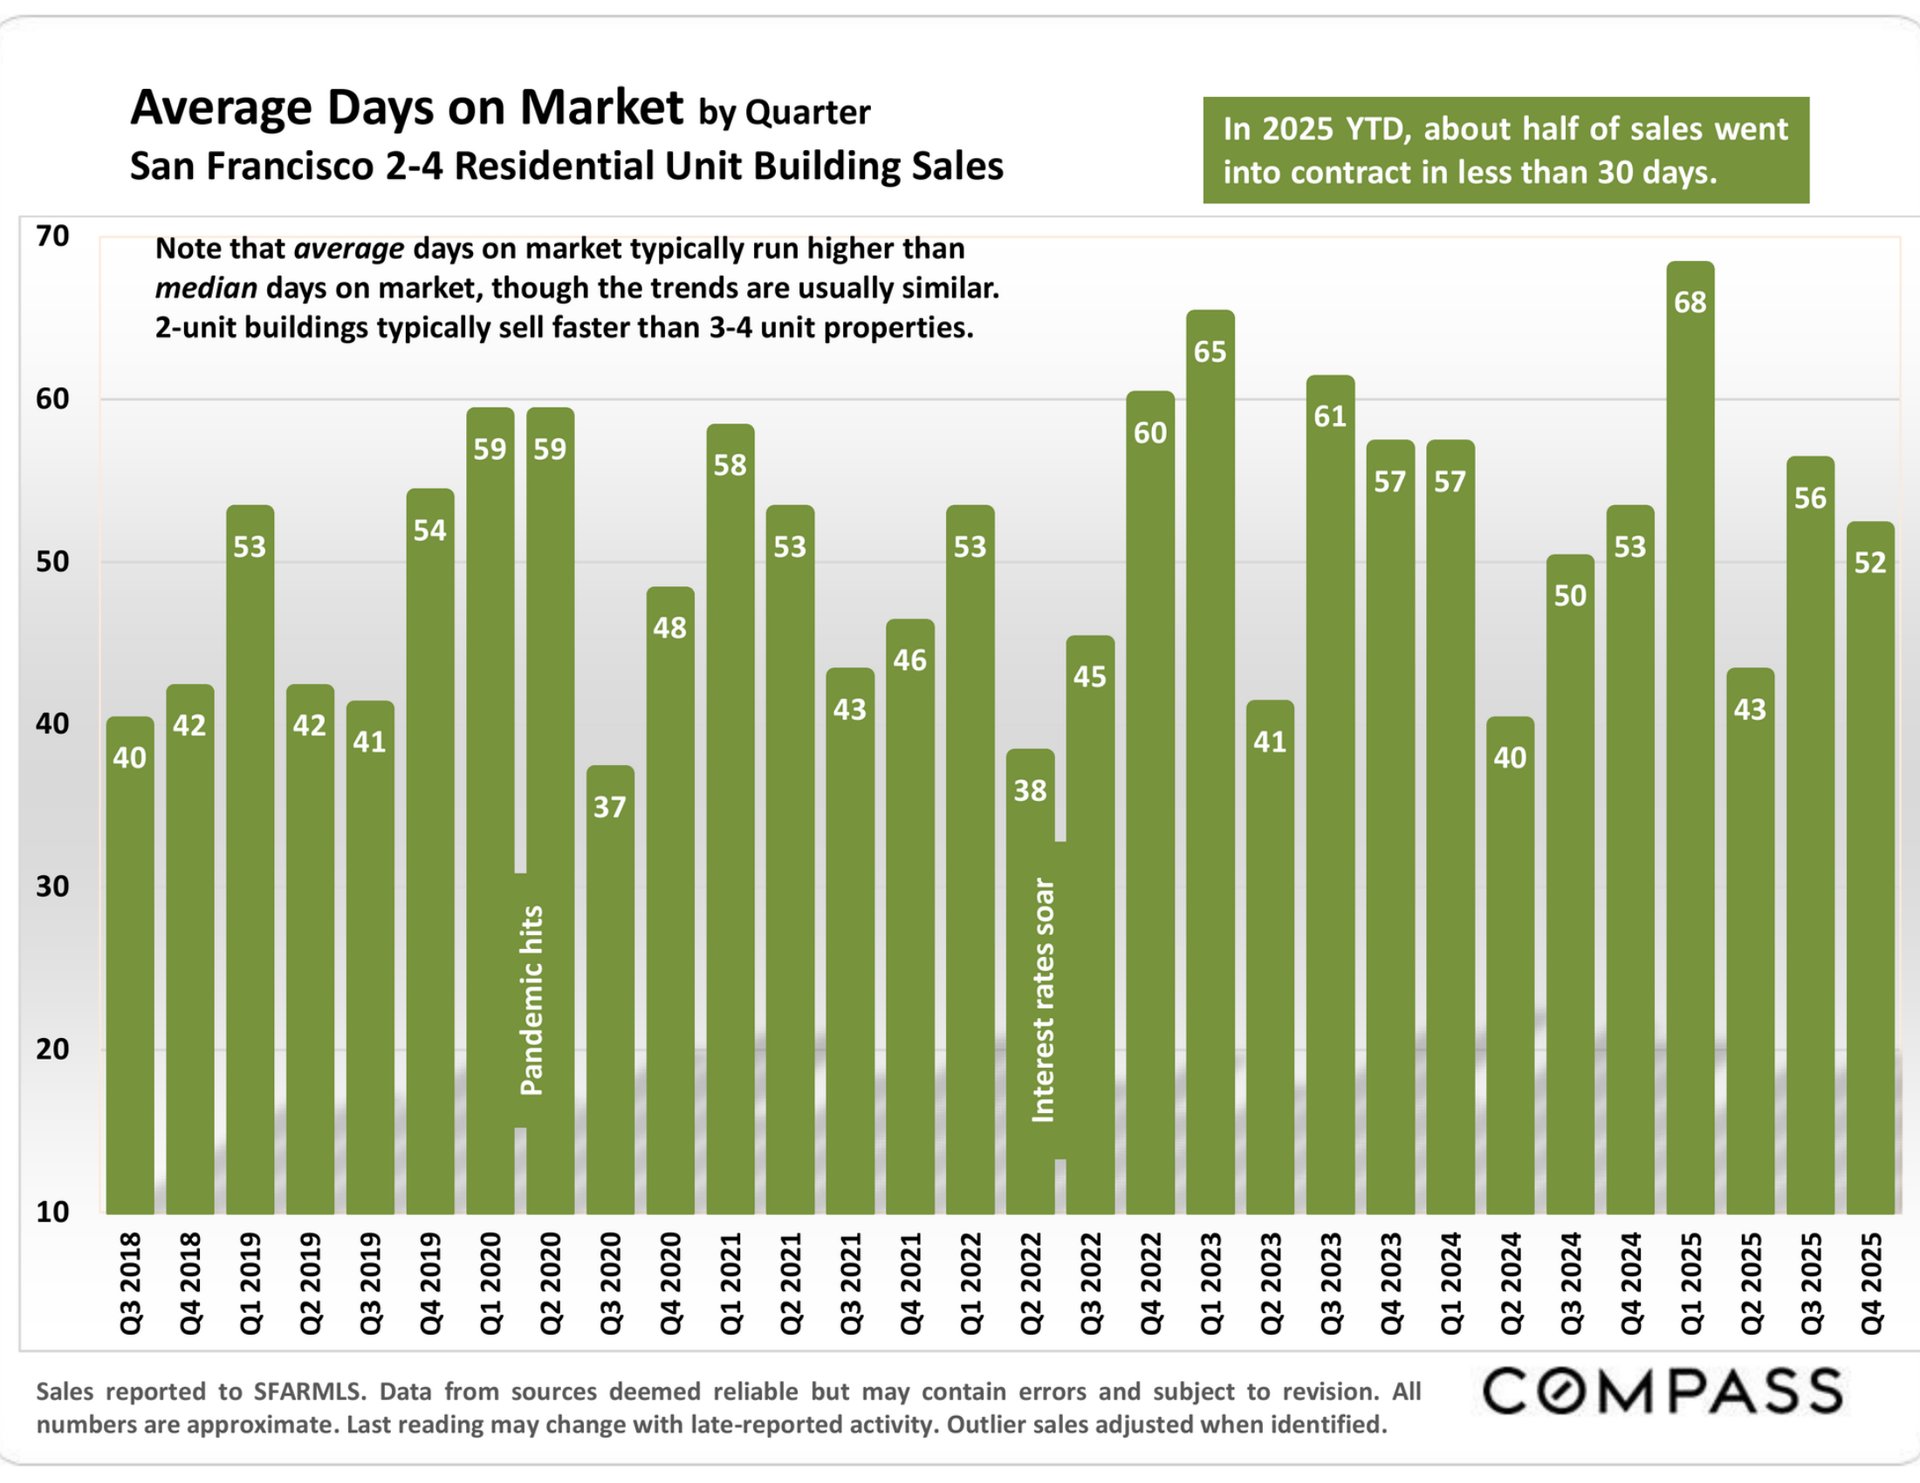
Chart of average days on market for San Francisco 2–4 unit building sales, Q3 2018–Q4 2025.

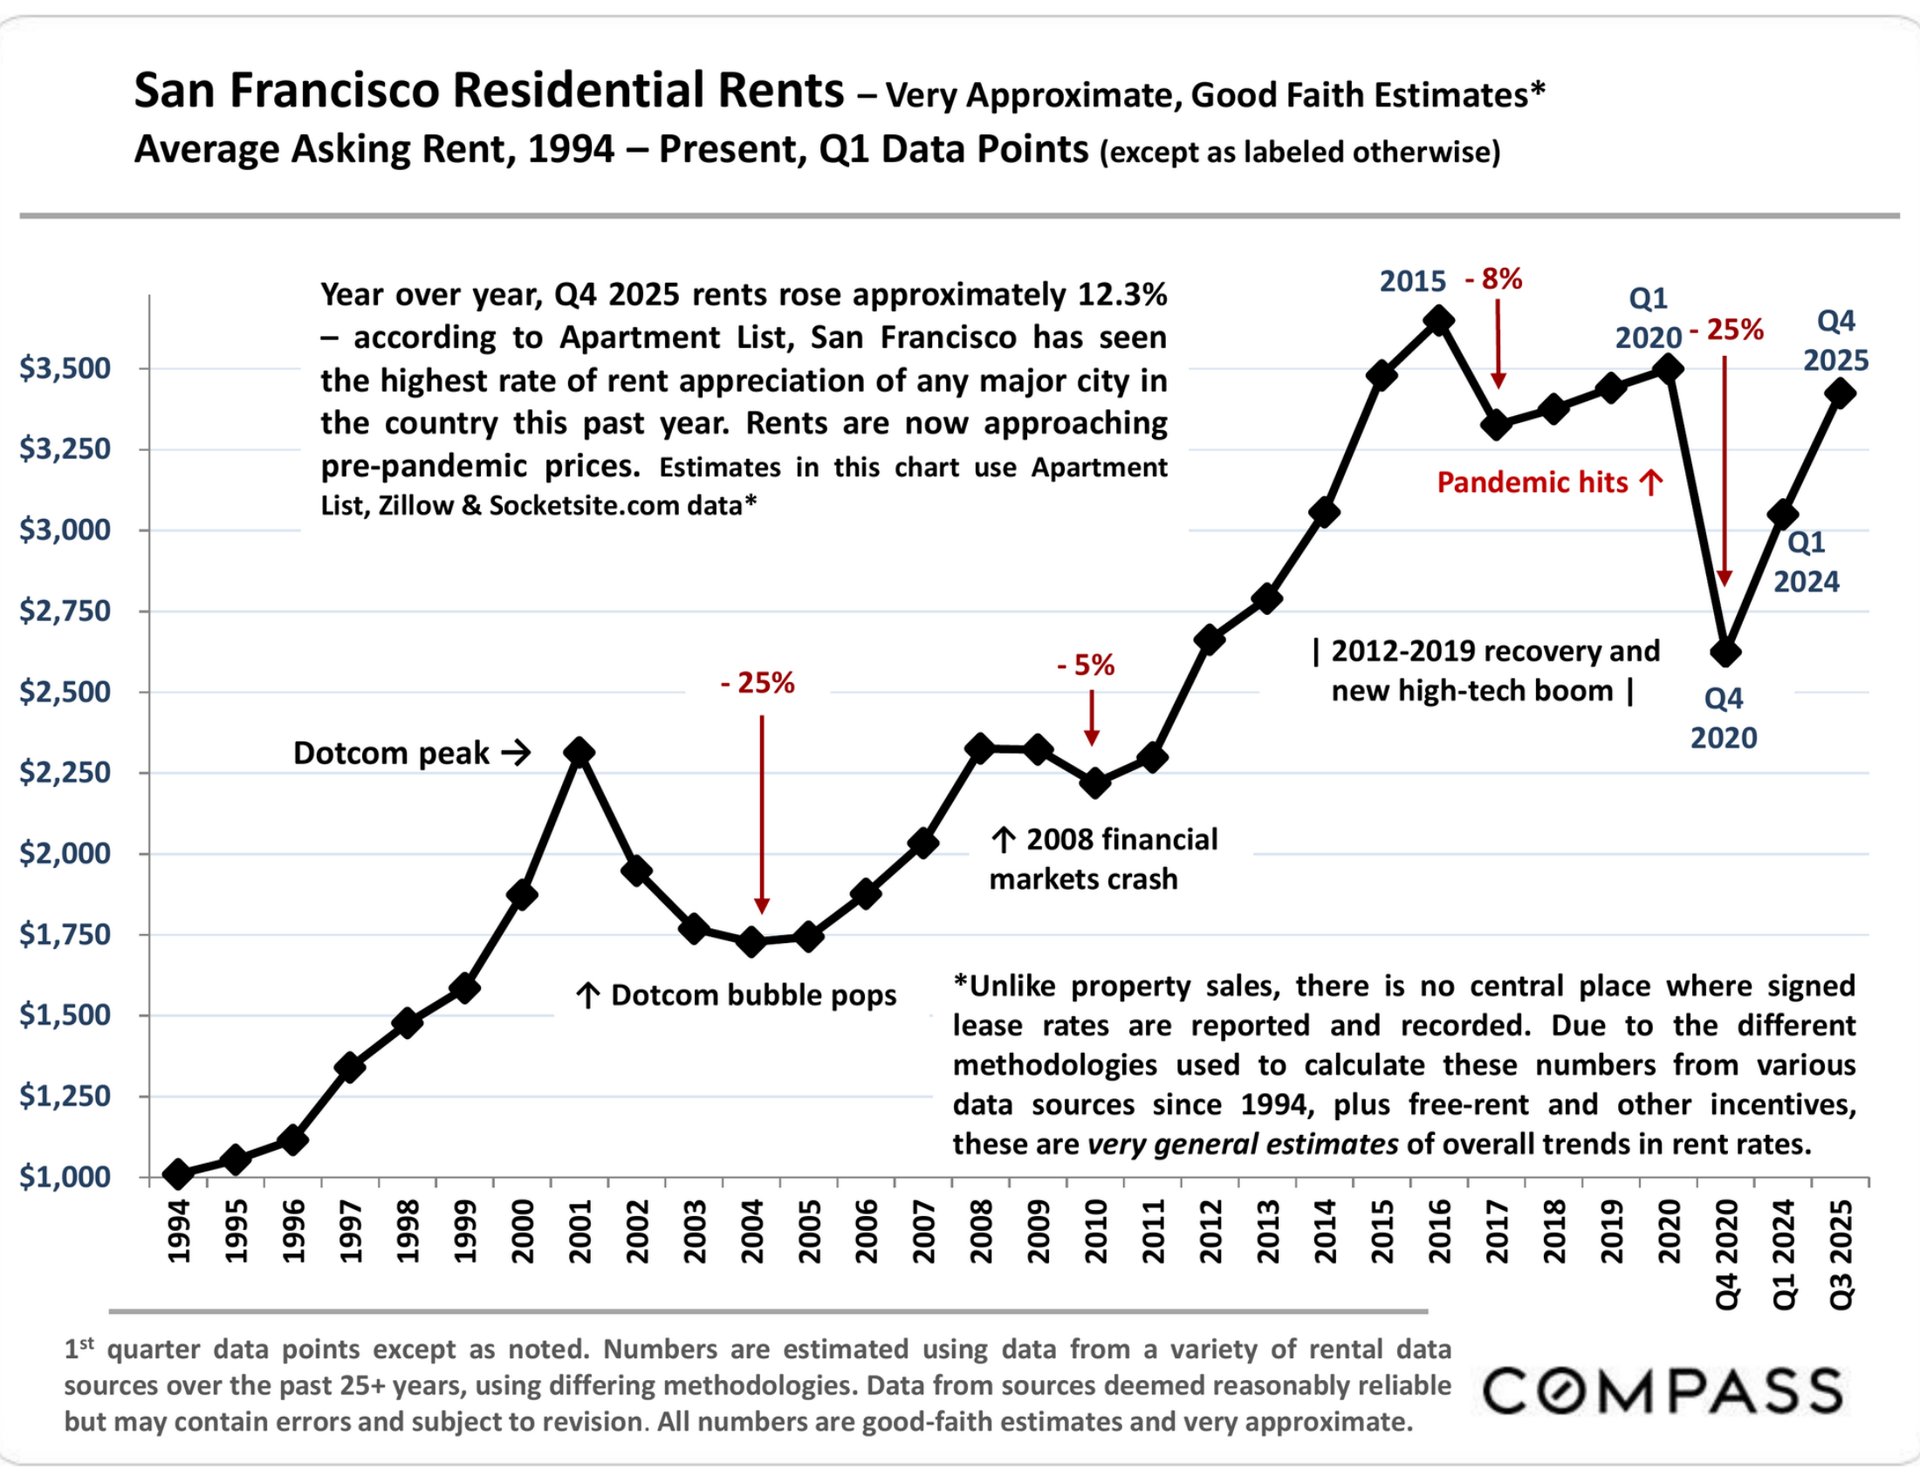
Chart of estimated San Francisco residential rents, 1994–2025, showing long-term increases and a sharp 2020 decline.

Selected Economic Indicators

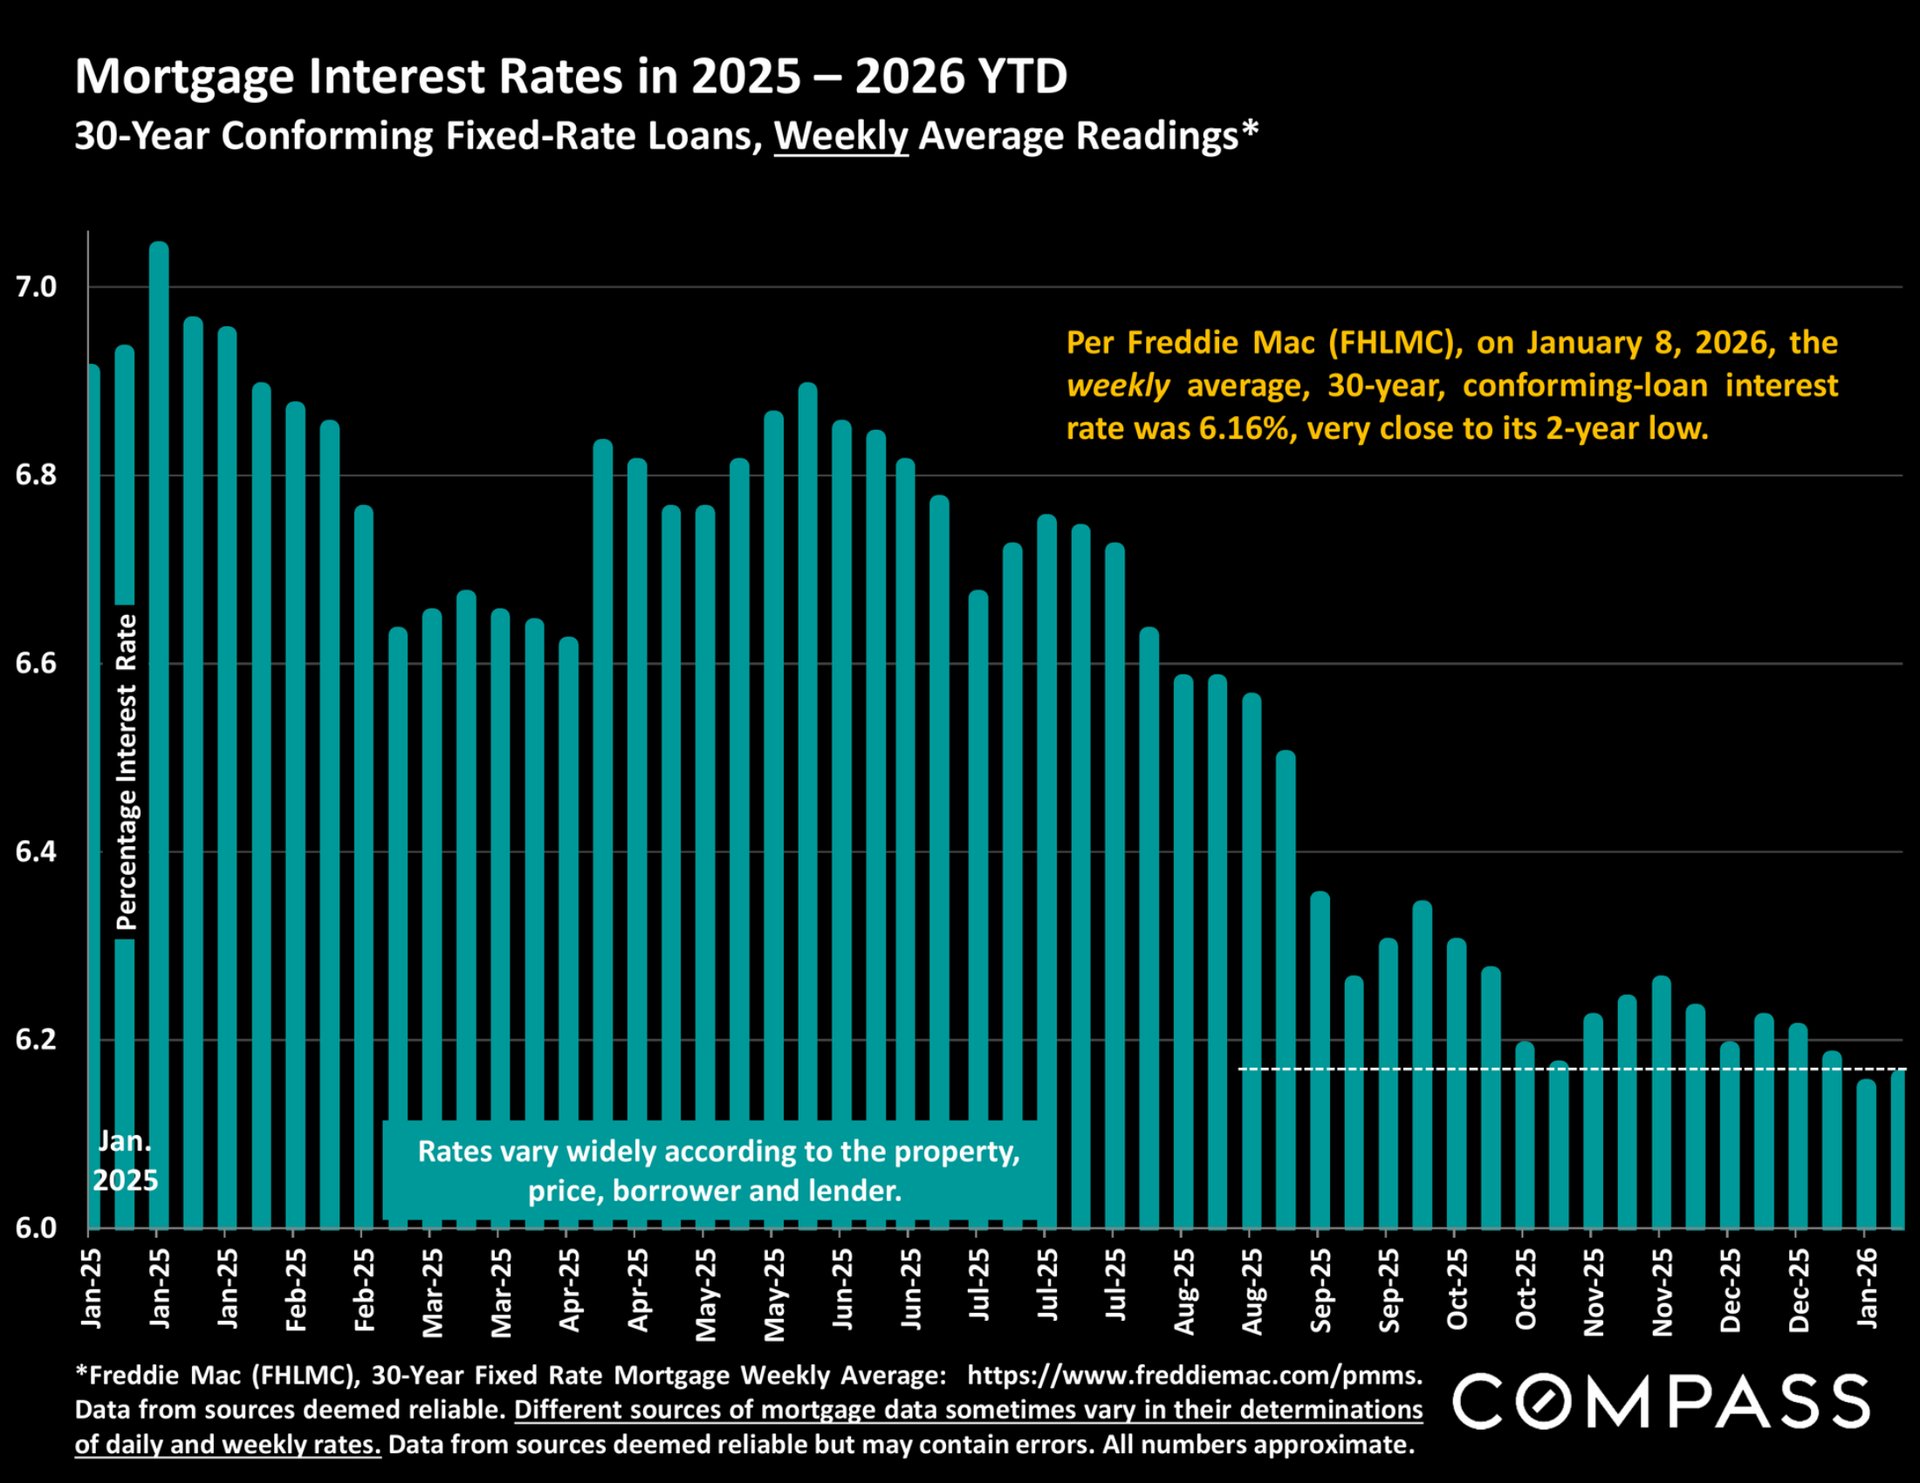
Chart of 30-year conforming mortgage rates, declining from above 7% in January 2025 to about 6.16% in January 2026.

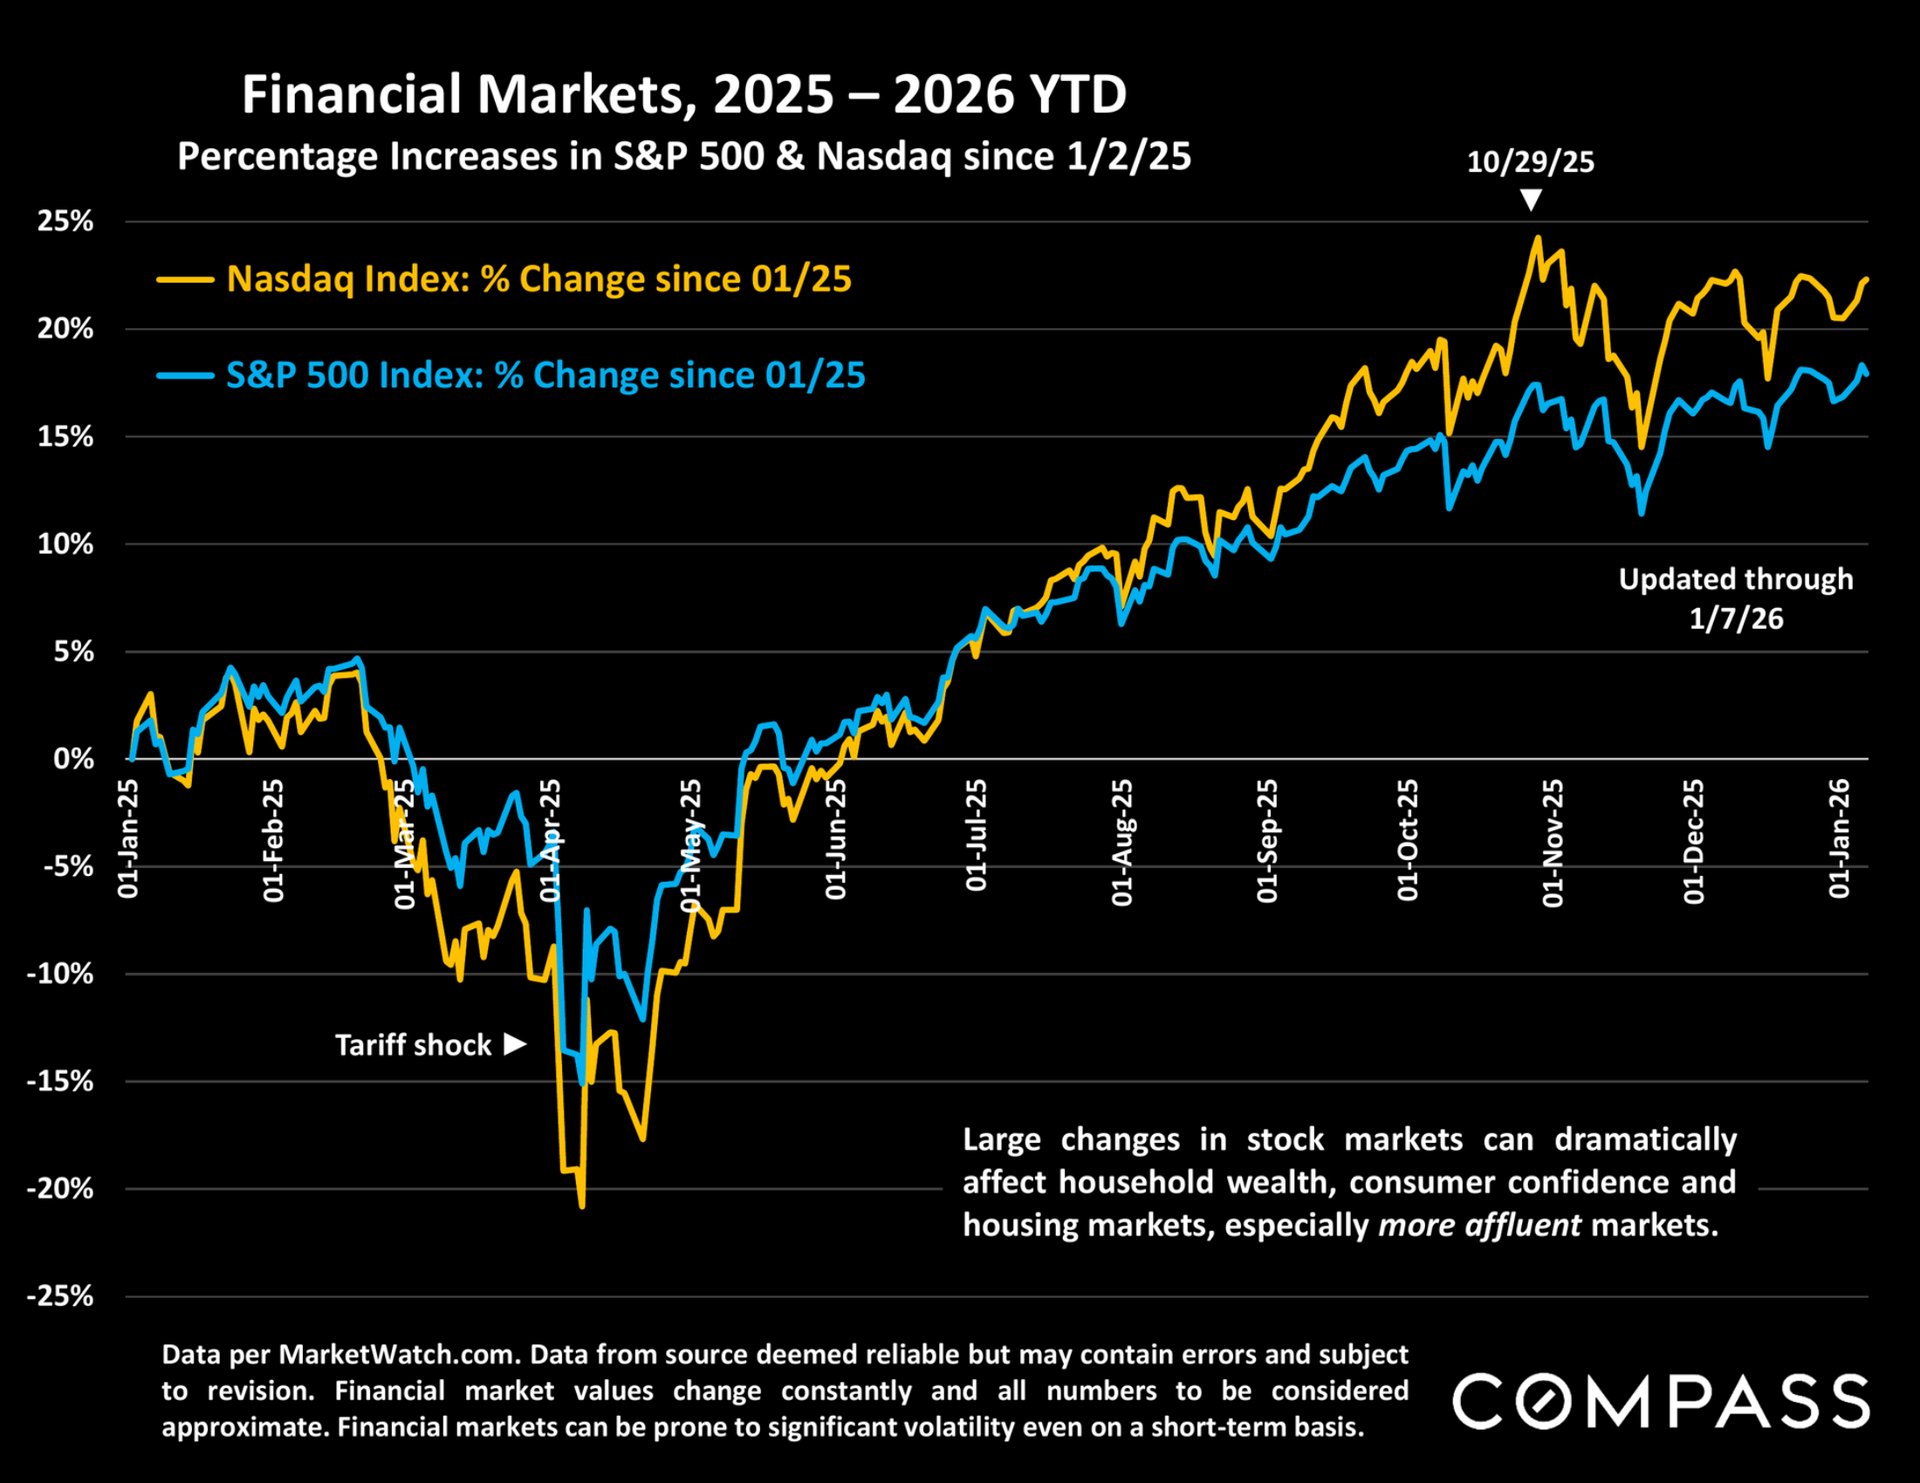
Line chart shows Nasdaq and S&P 500 gains through January 2026, with Nasdaq ending higher.

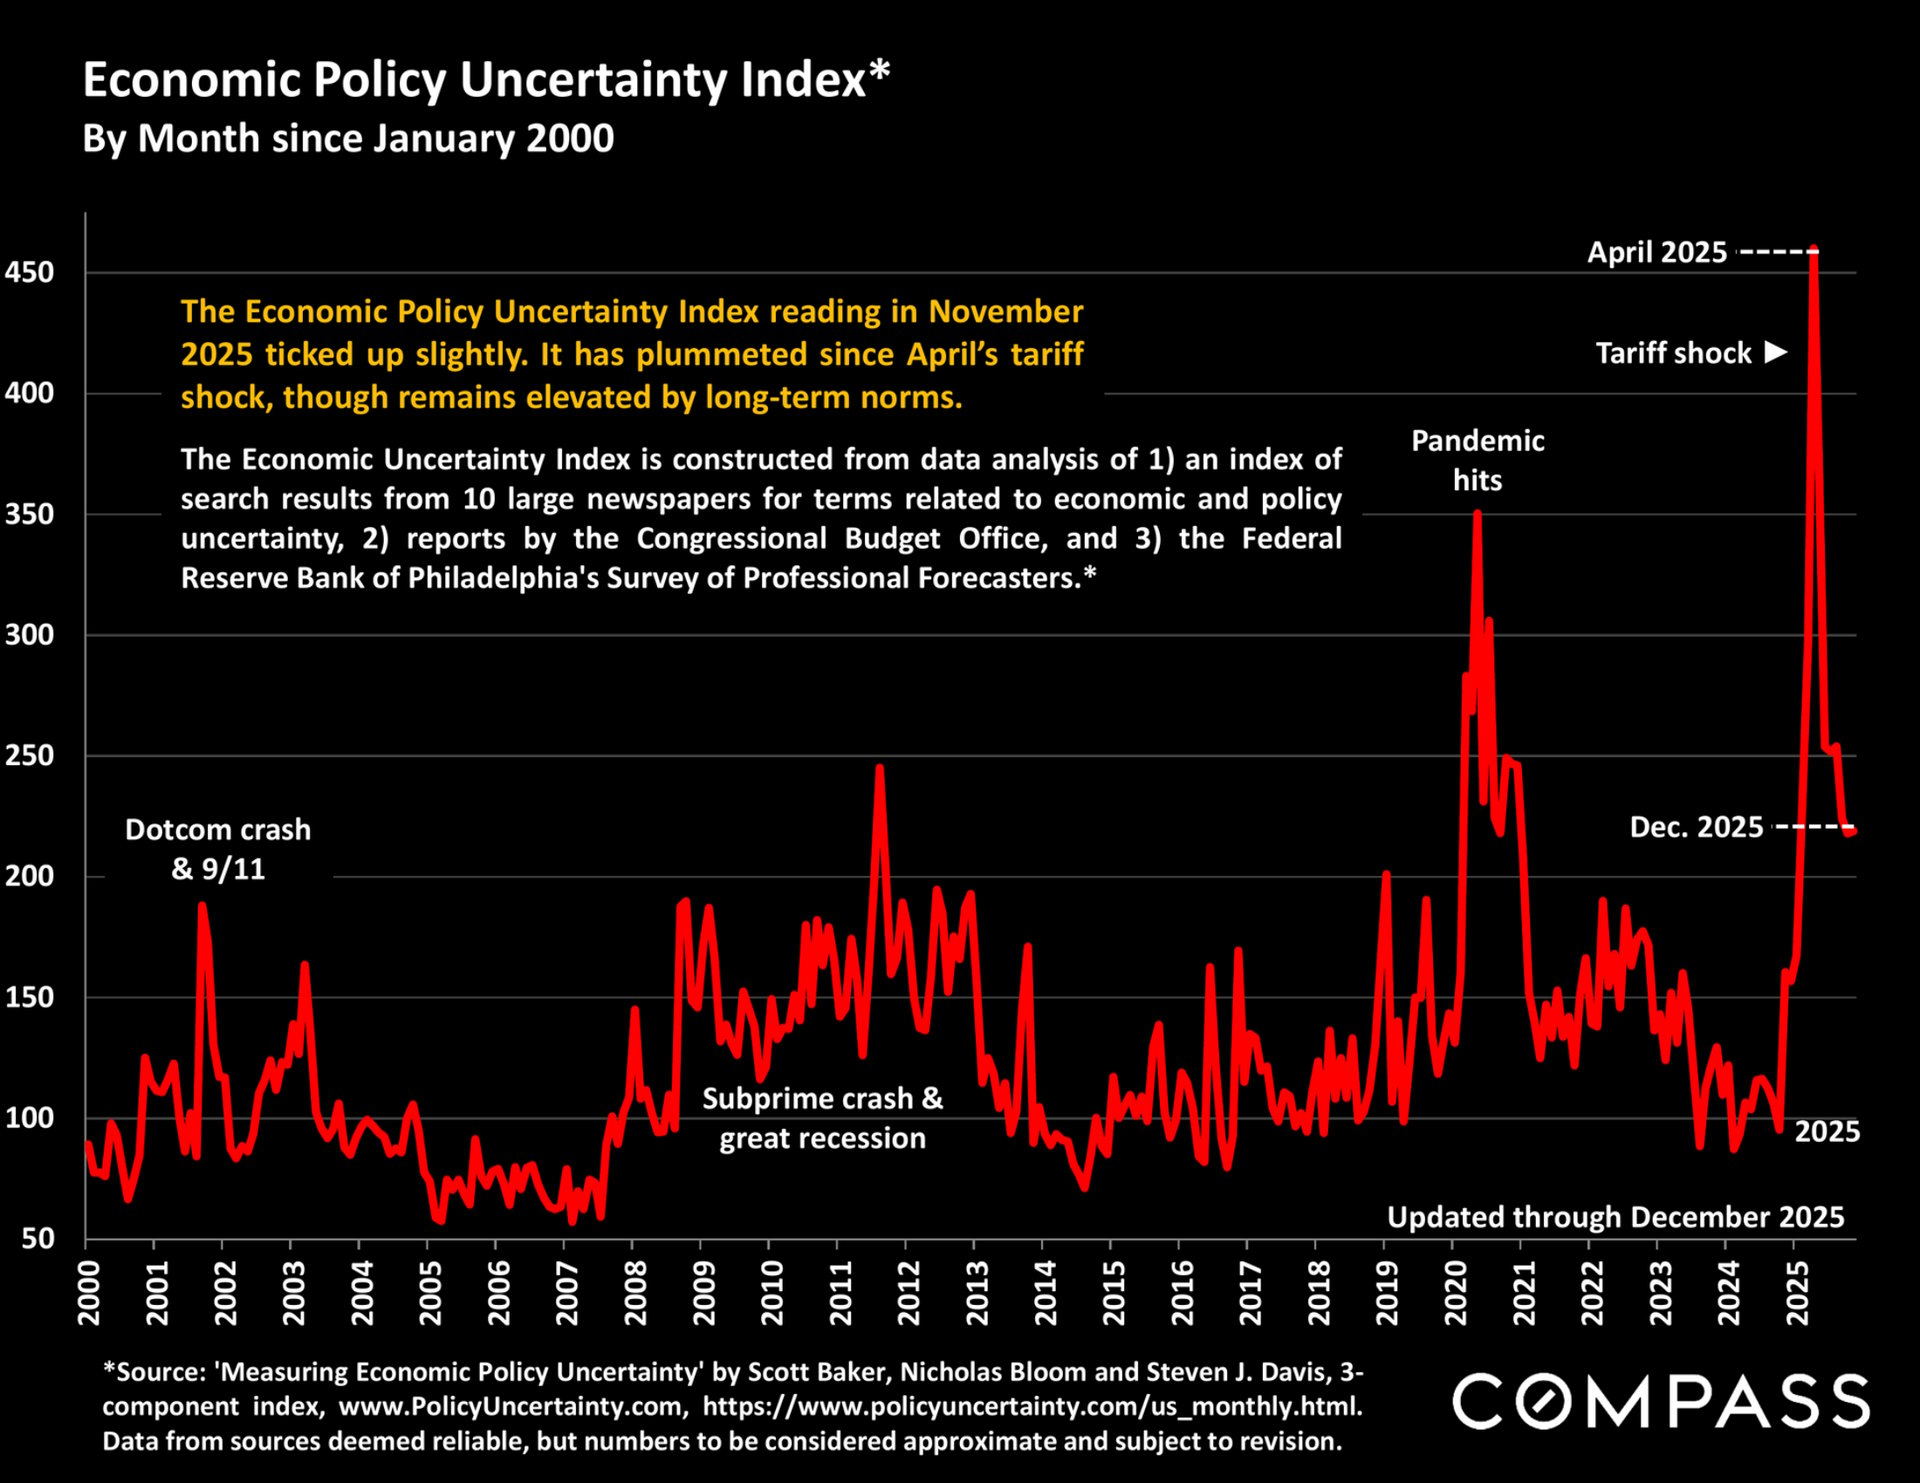
Chart of monthly economic policy uncertainty from 2000–2025, with a sharp April 2025 tariff-shock peak.

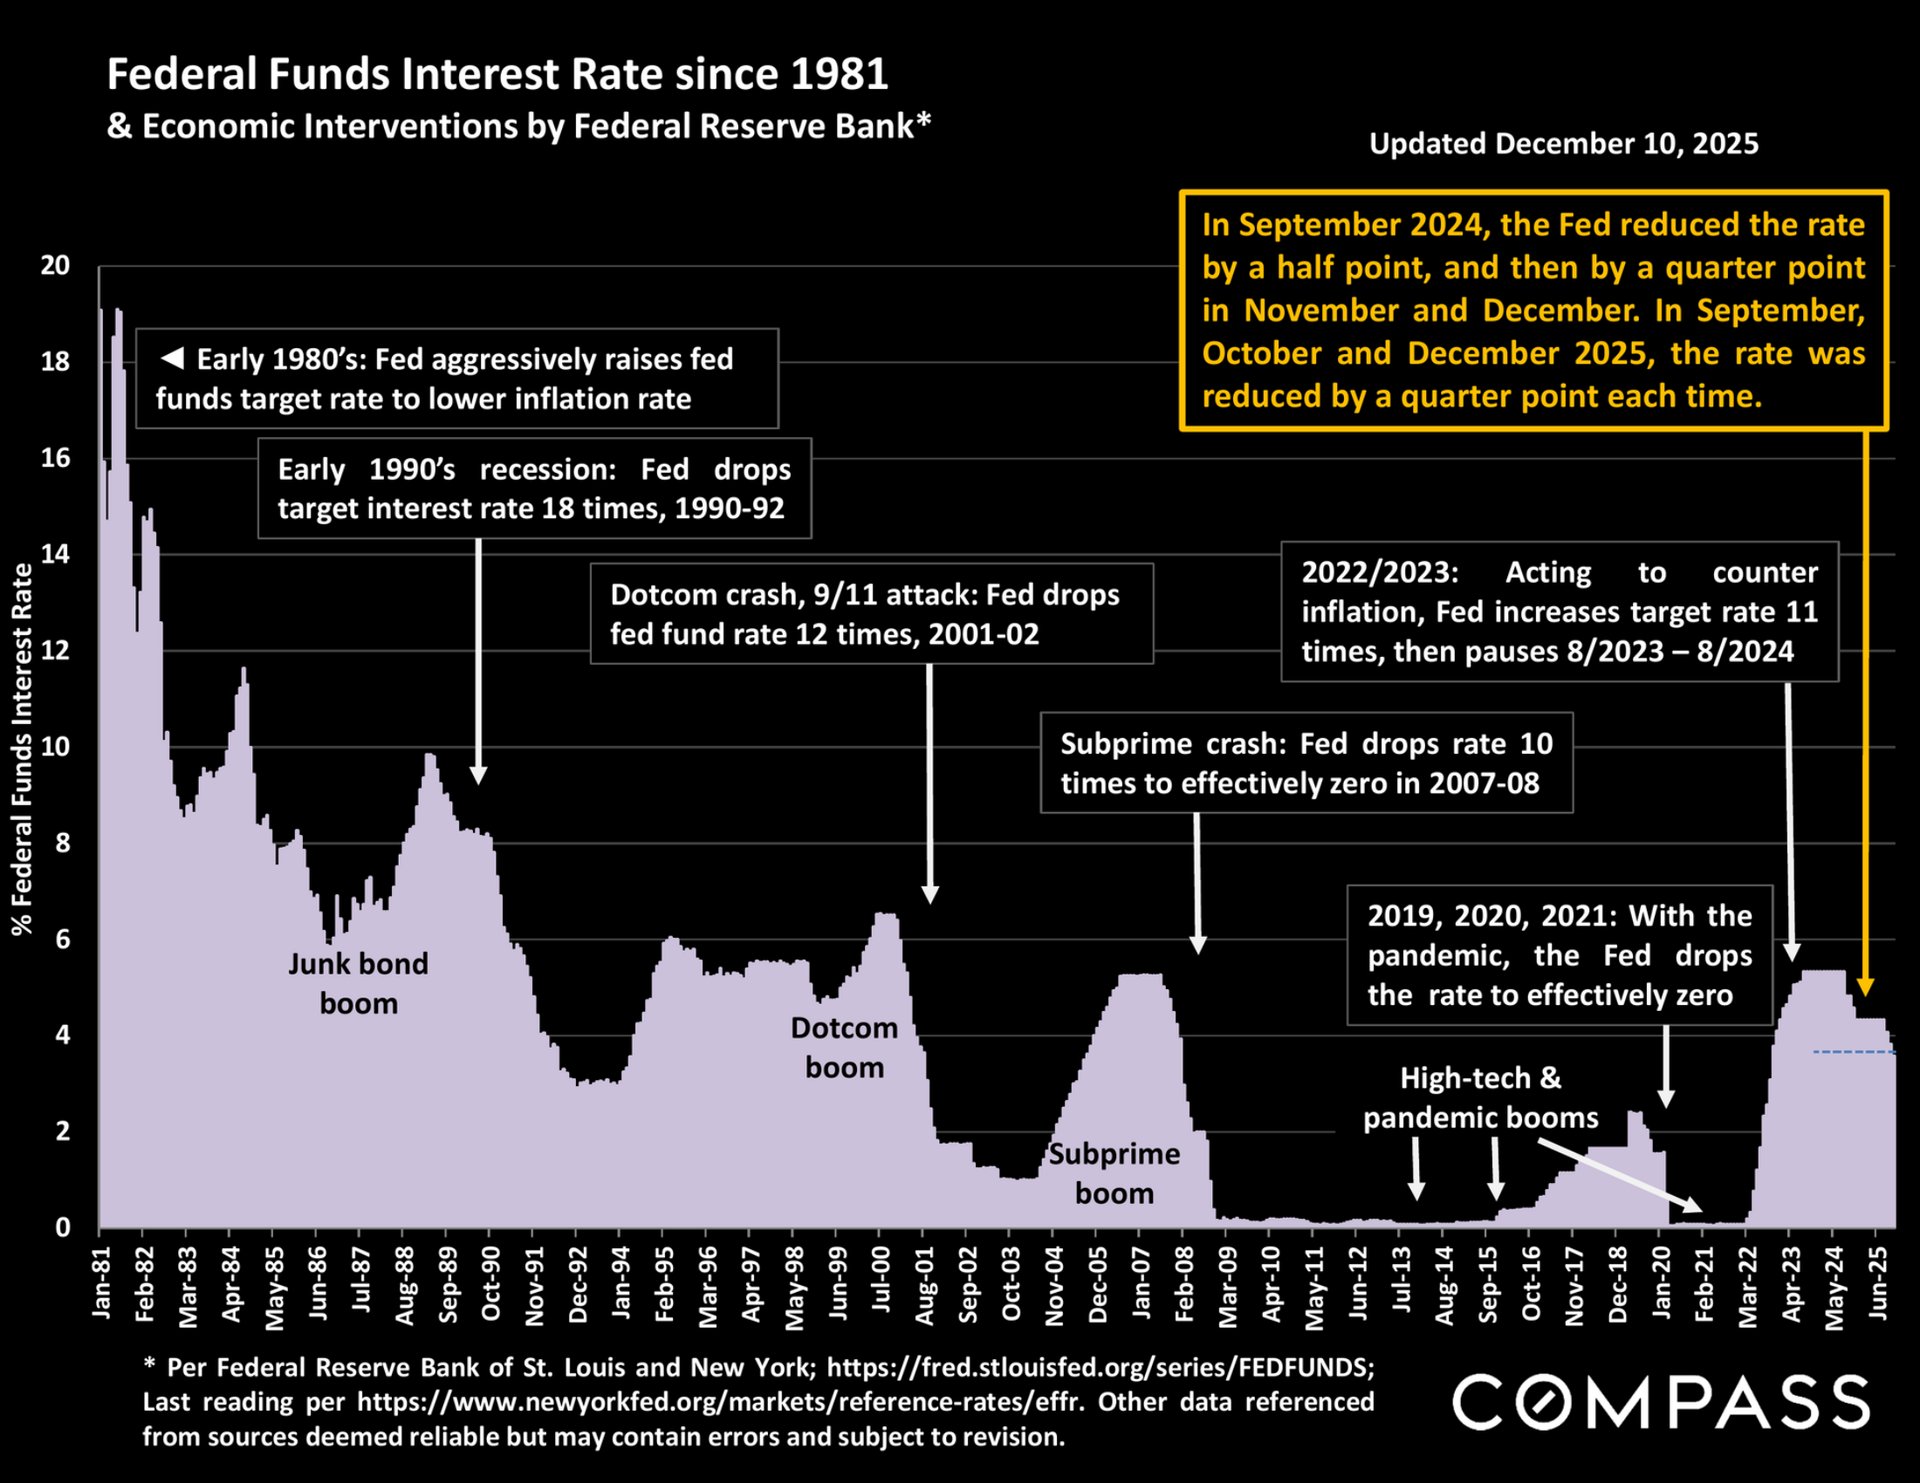
Federal funds rate chart from 1981 to 2025, annotated with major economic events and Federal Reserve actions.

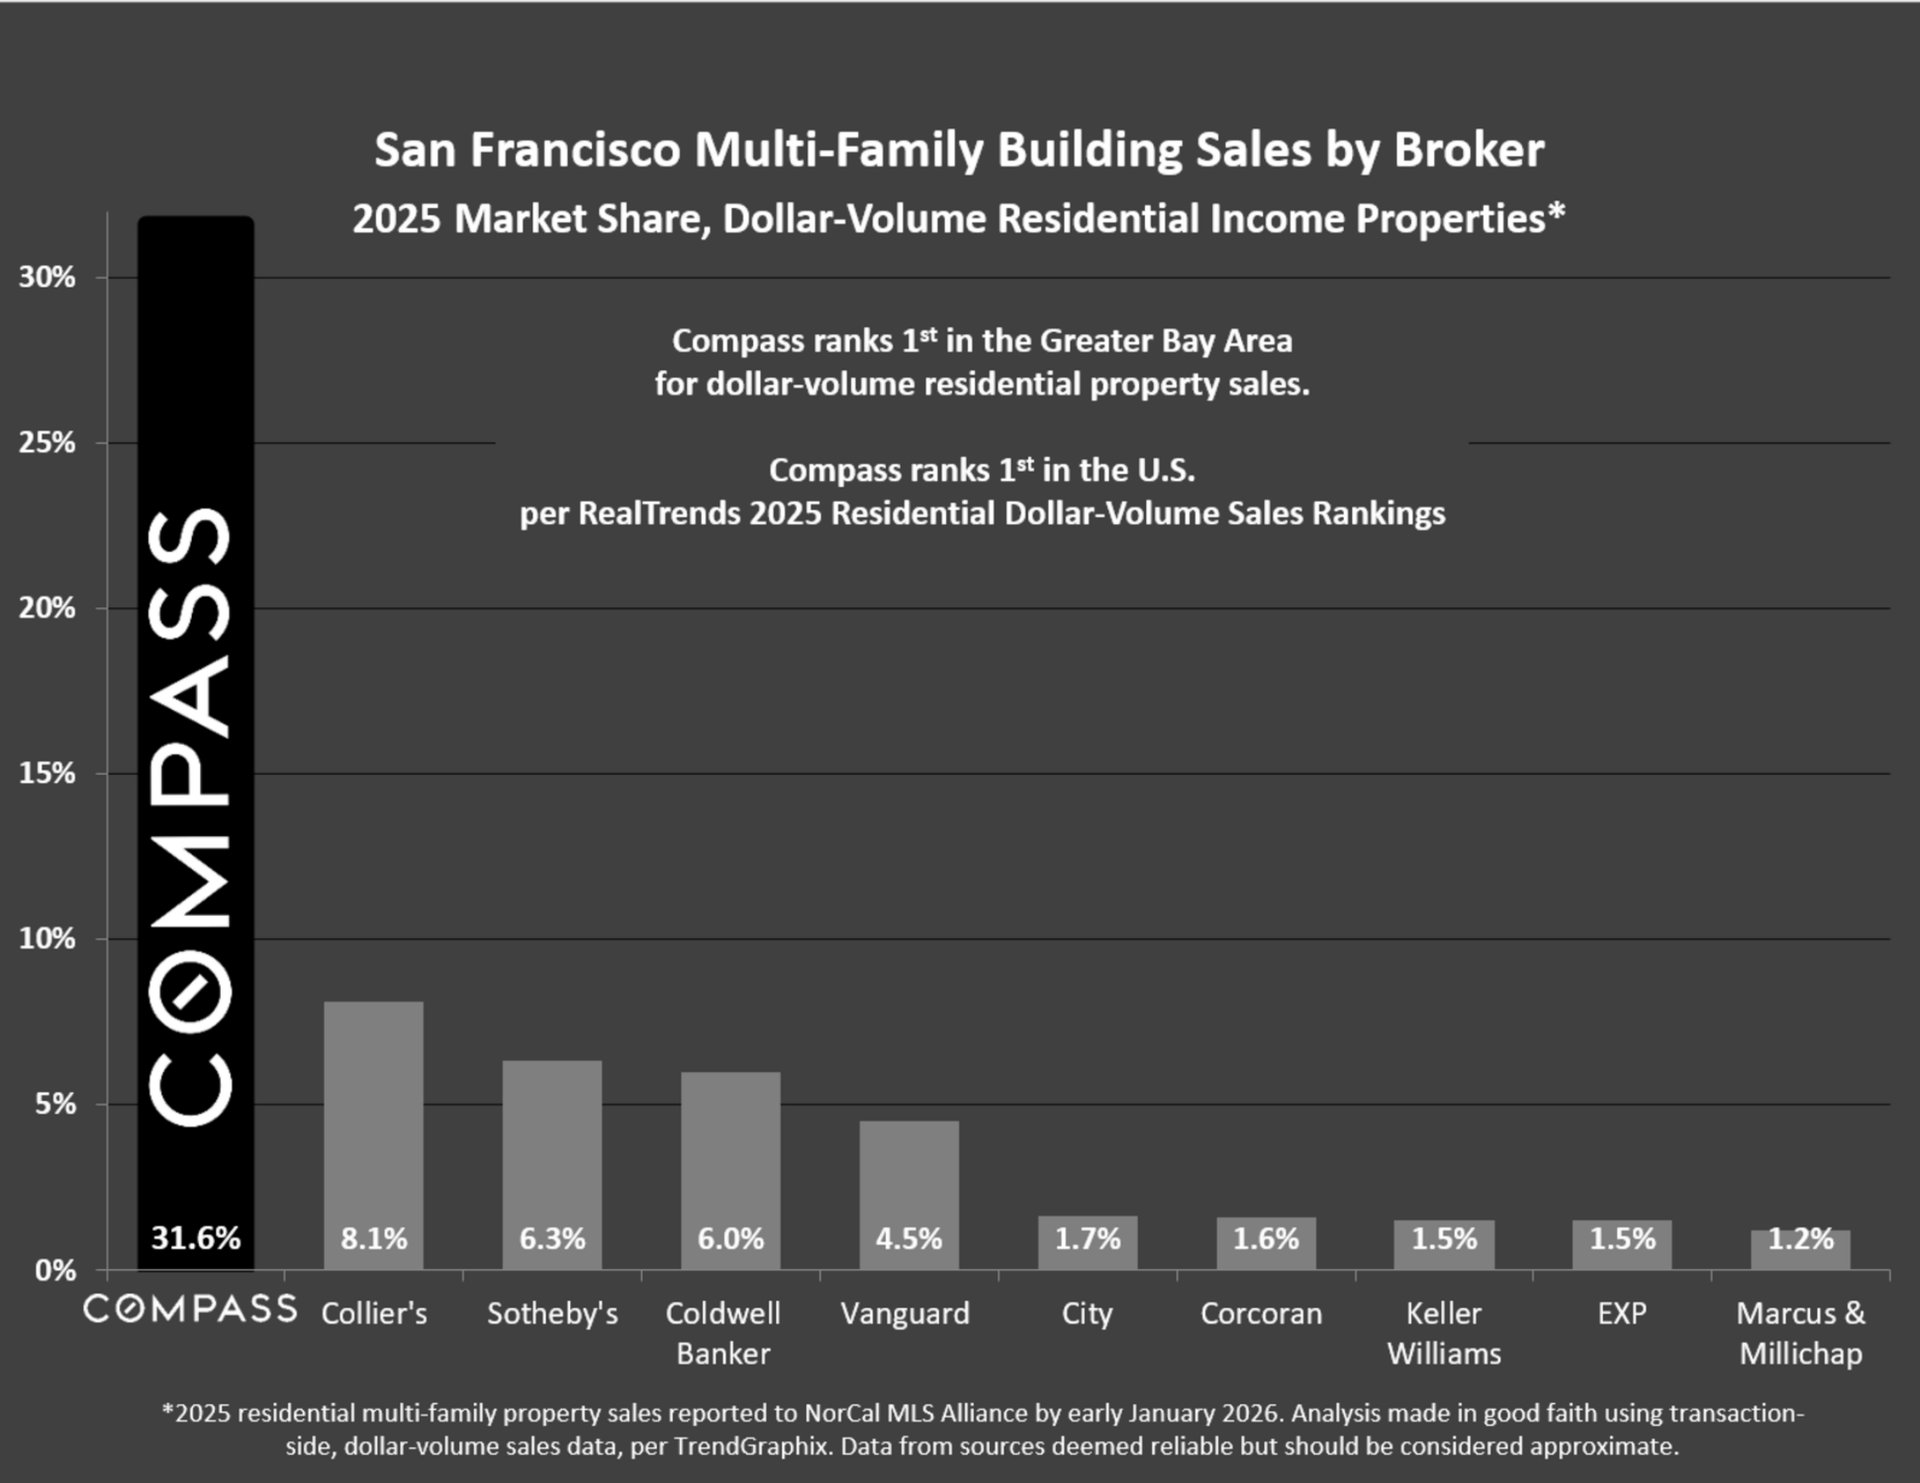
Chart of 2025 San Francisco multifamily sales market share by broker, with Compass leading at 31.6%.

Market report disclaimer page with notes on statistical limitations, legal disclaimer, and Compass branding.

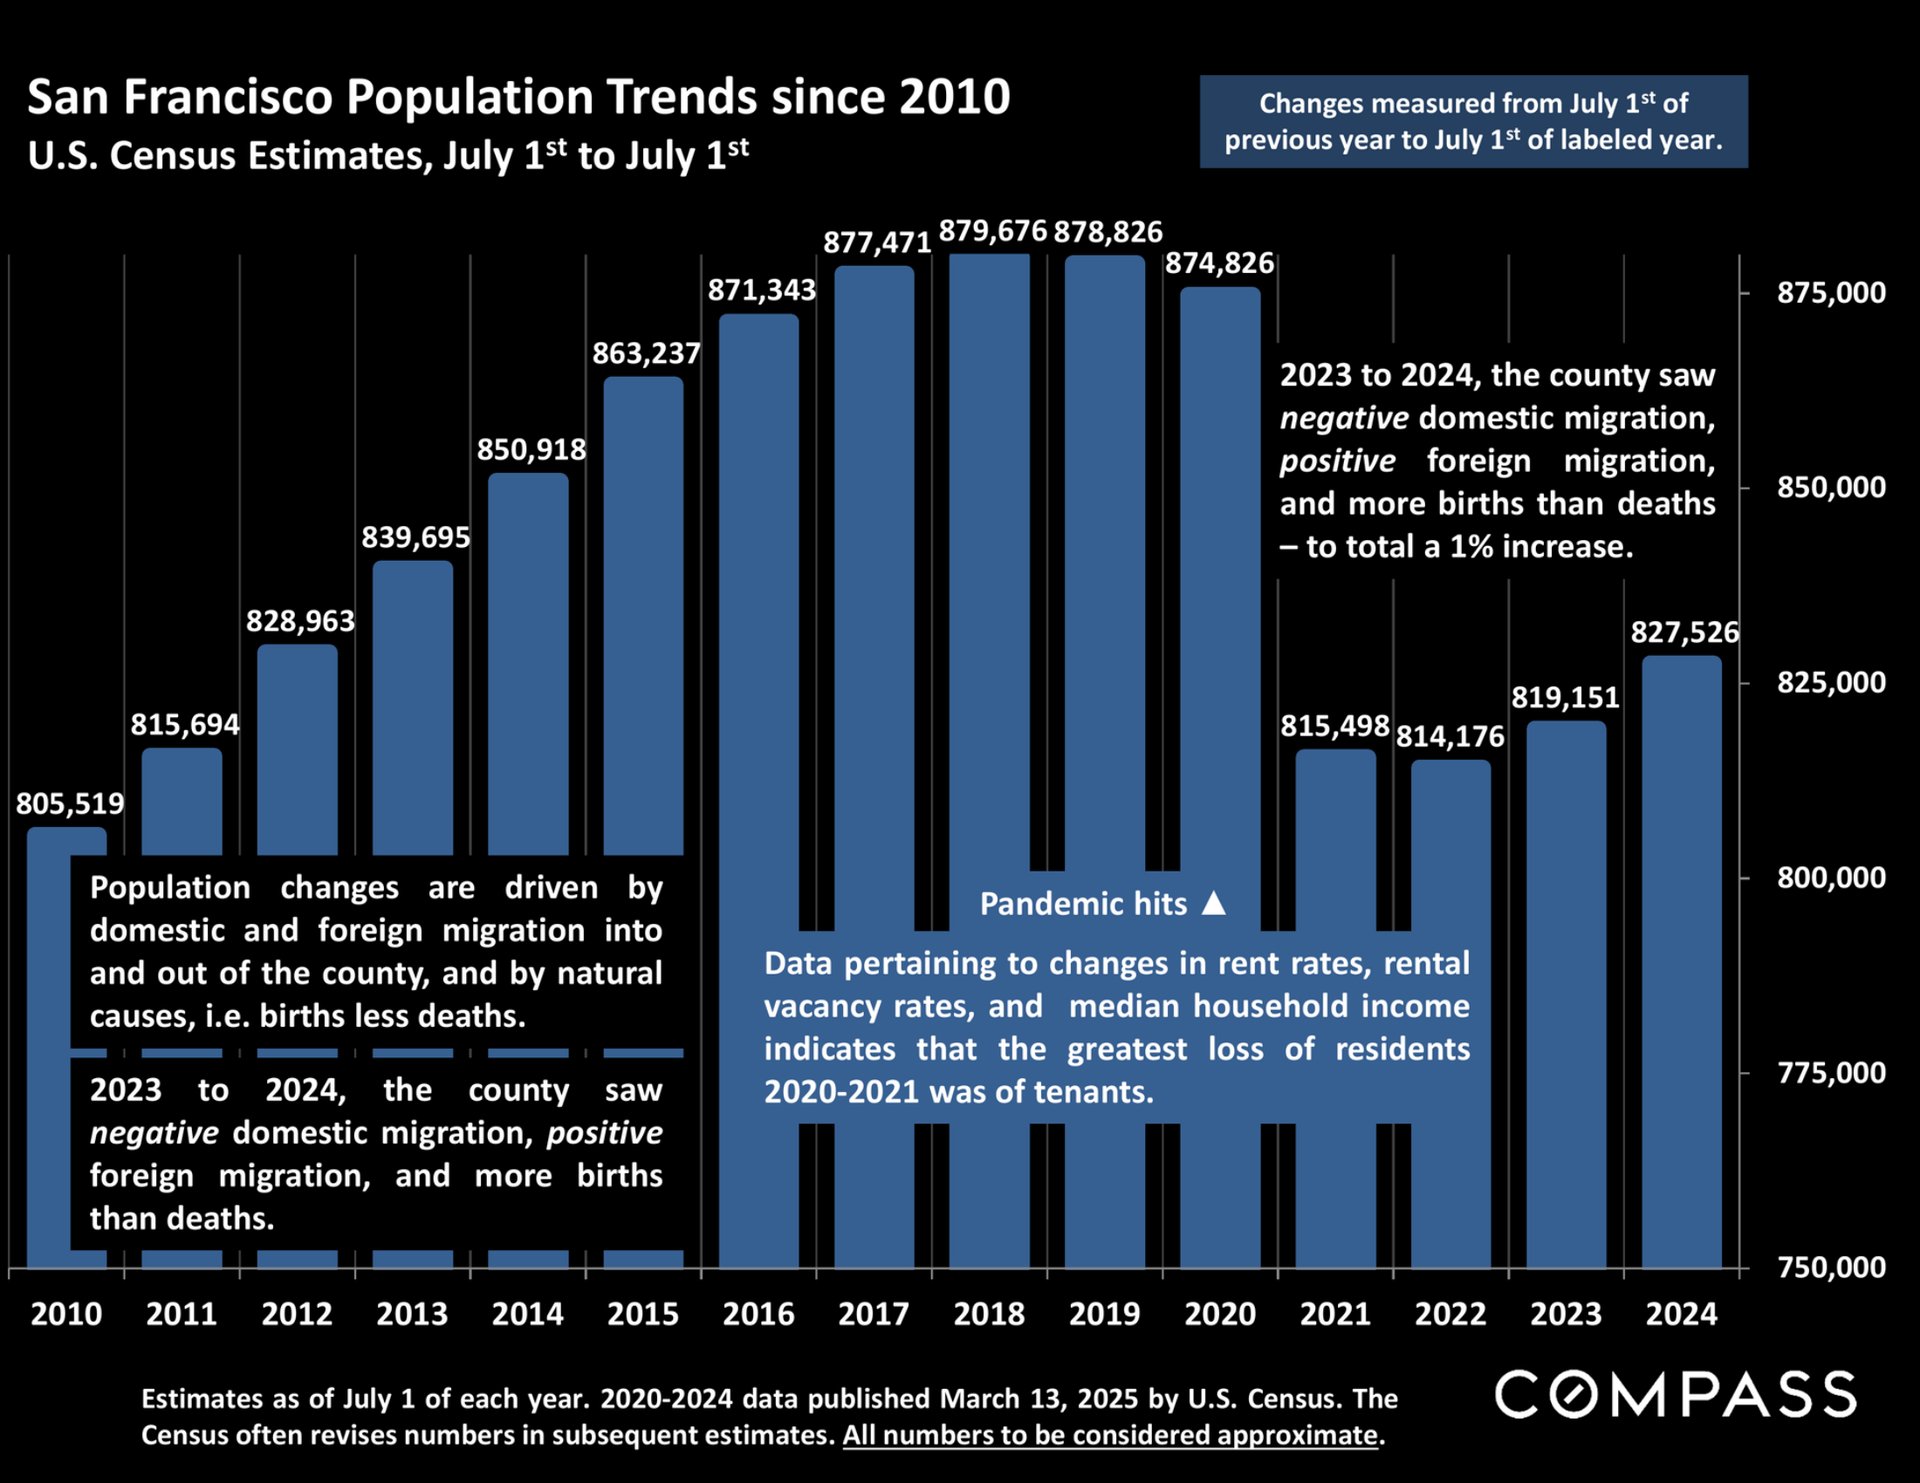
San Francisco population chart, 2010–2024, peaking in 2018 before a sharp decline and partial recovery.

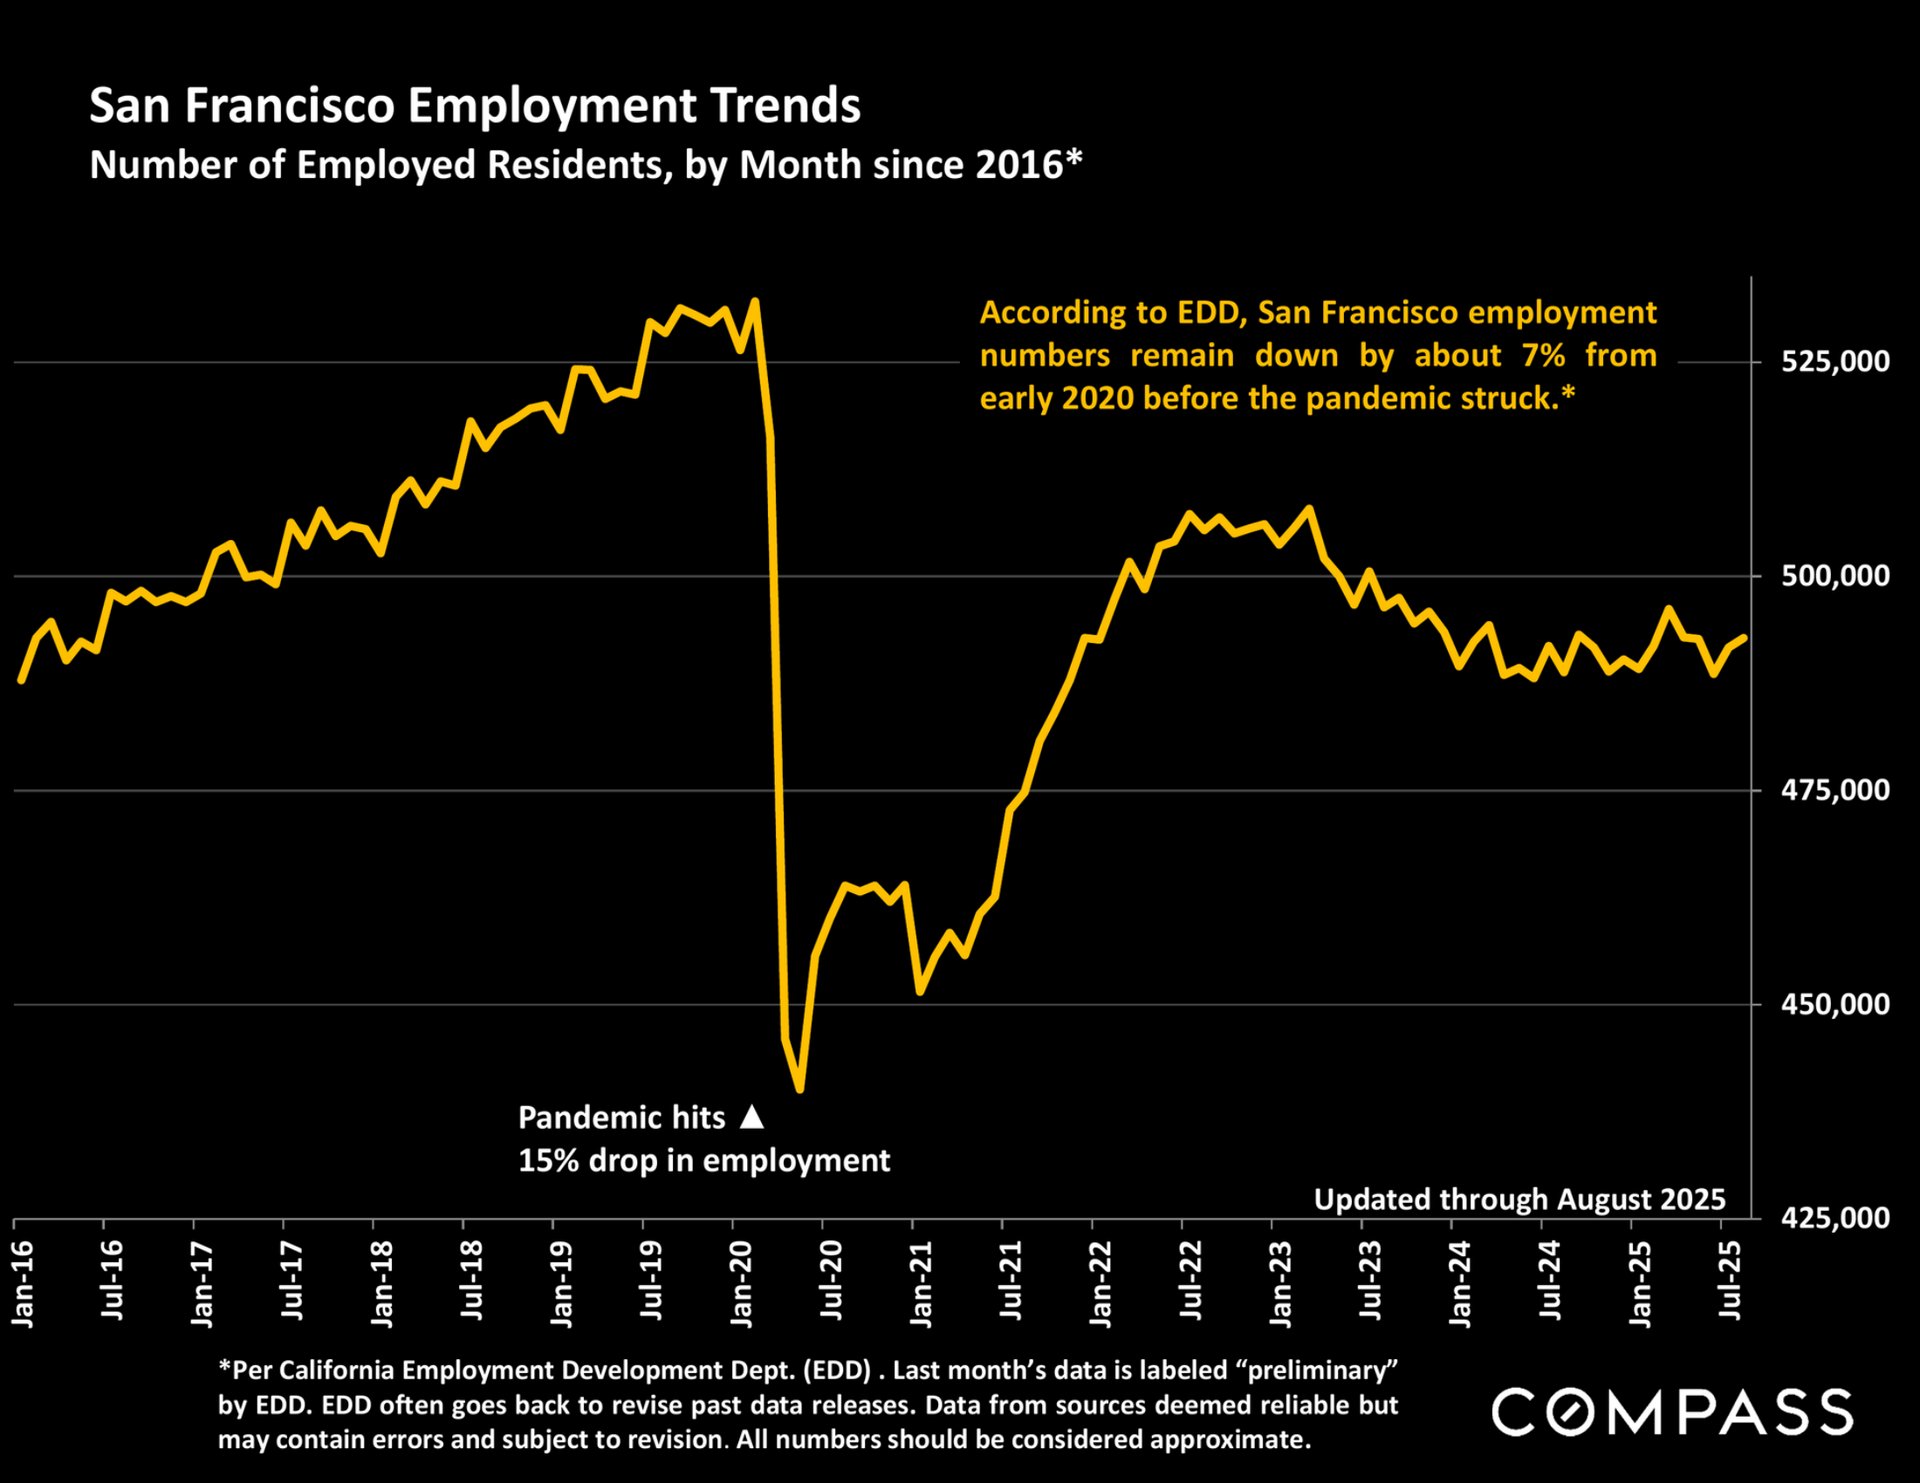
San Francisco employment trends chart shows a sharp pandemic-era drop and partial recovery through August 2025.

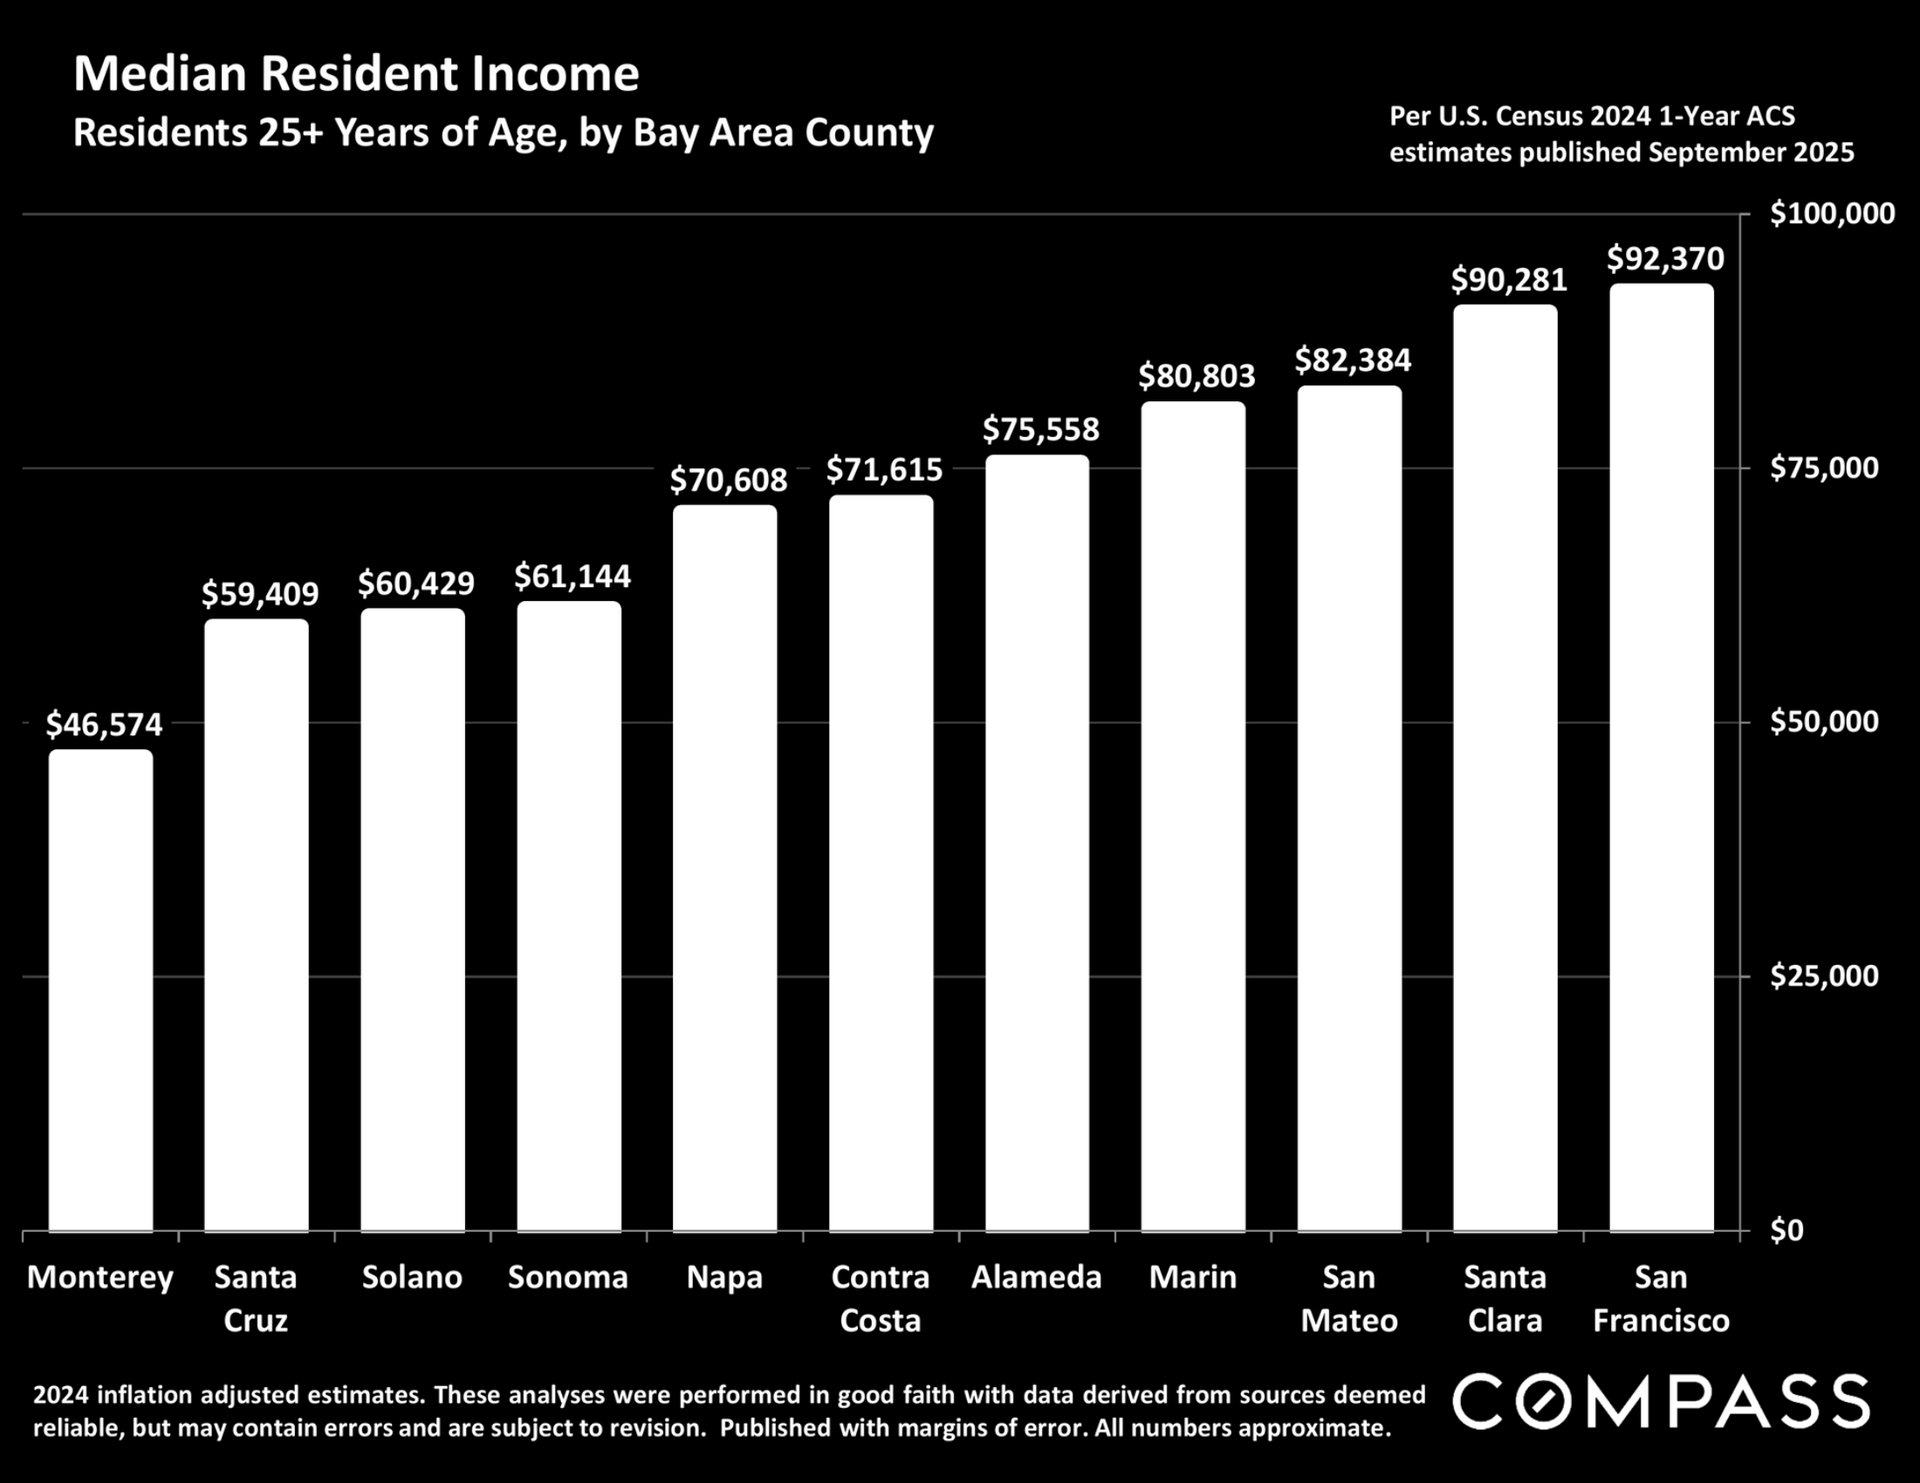
Bar chart of median resident income by Bay Area county; San Francisco is highest at $92,370 and Monterey lowest at $46,574.

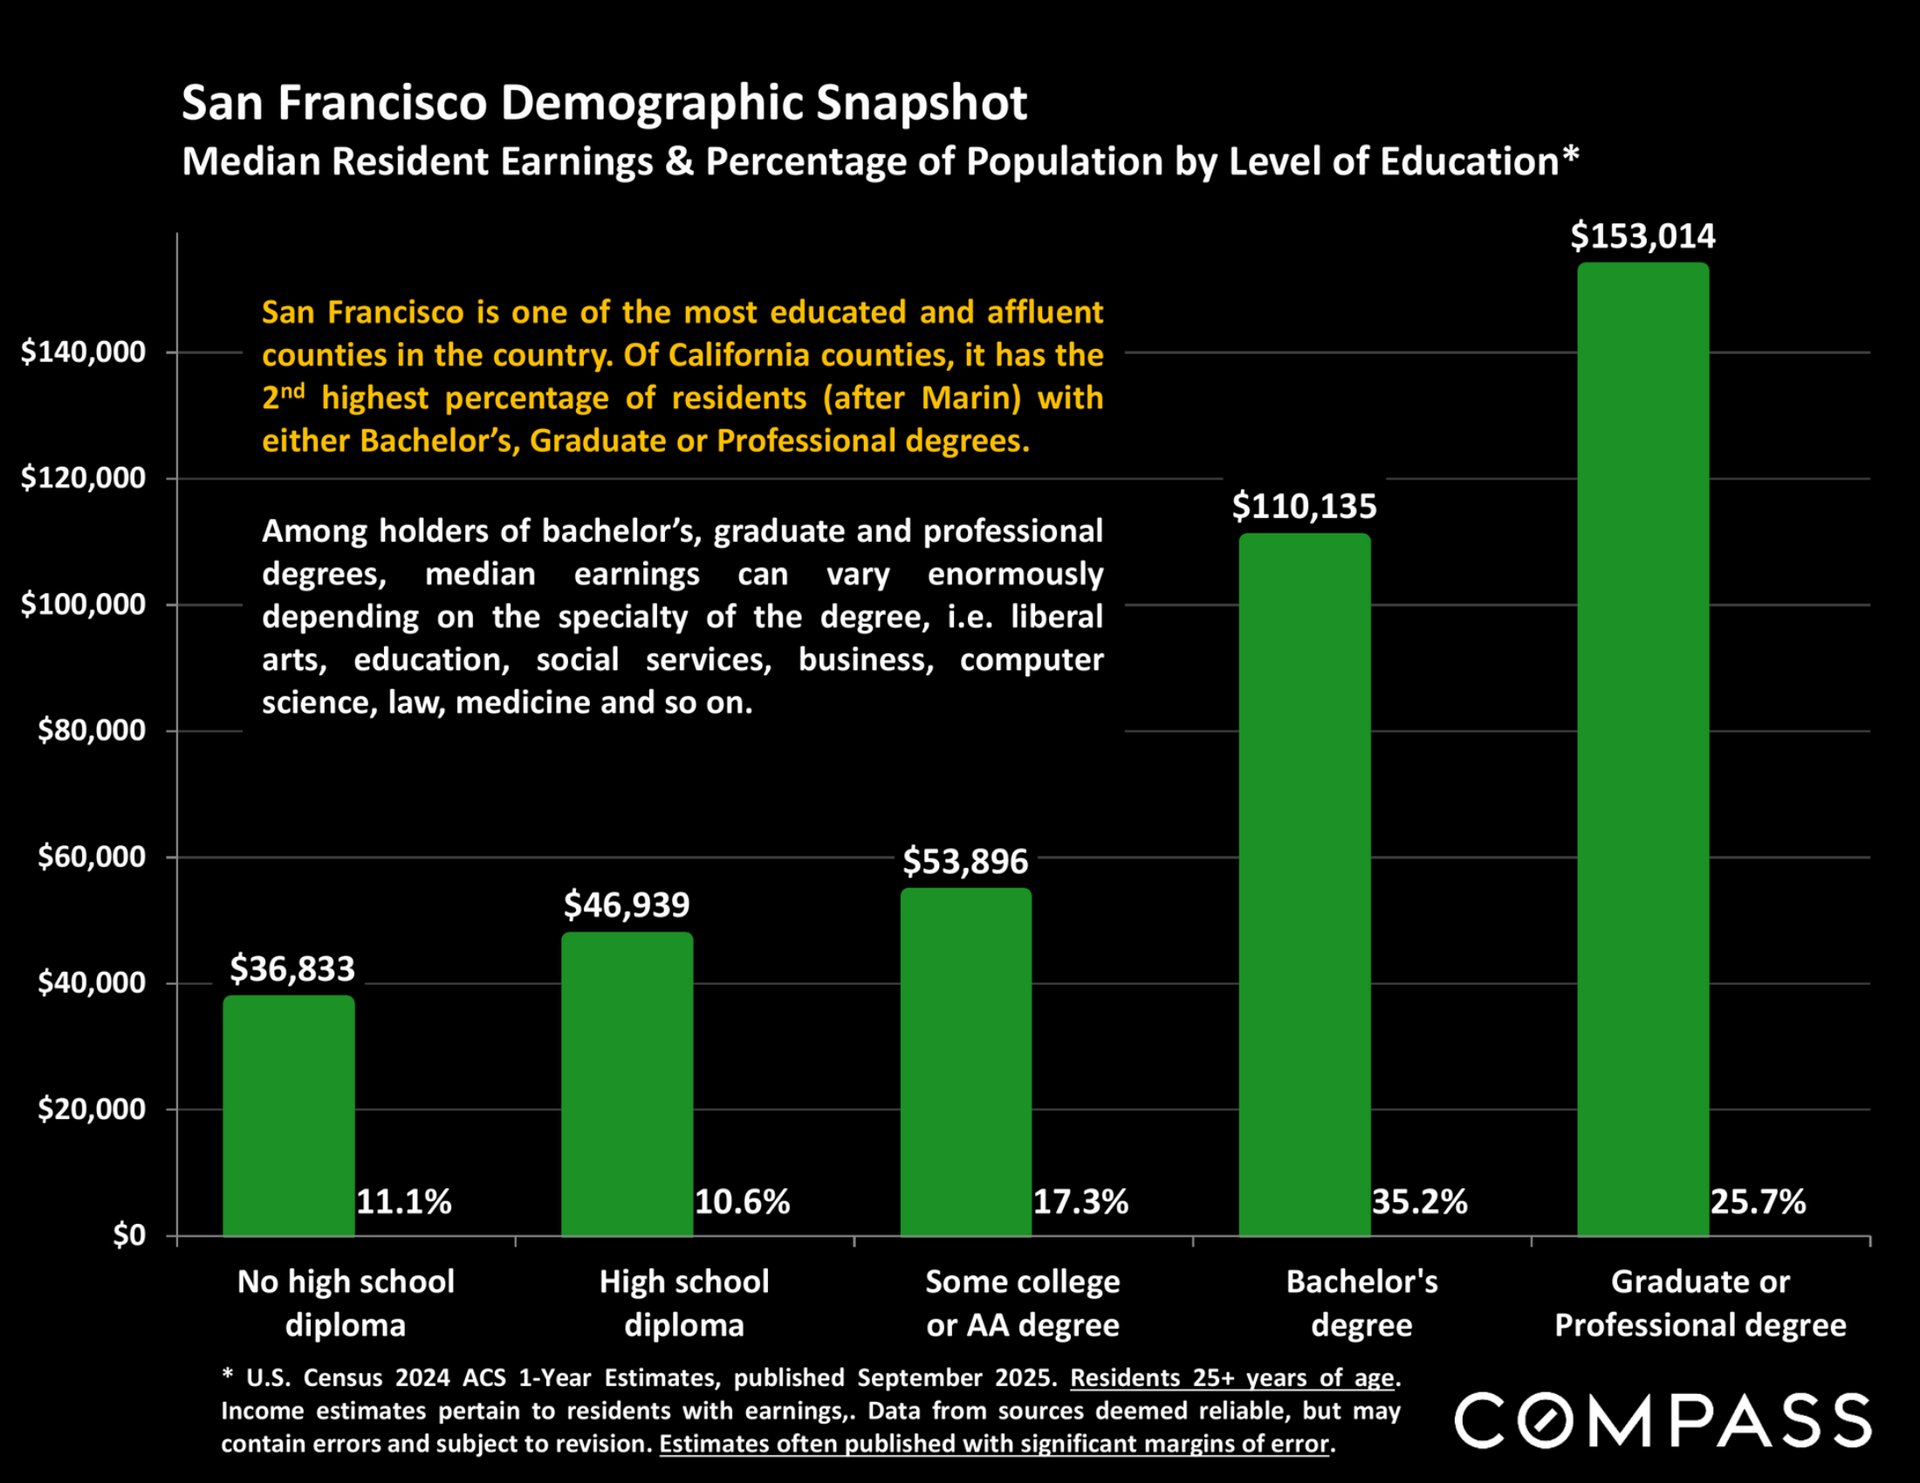
San Francisco demographic chart comparing median earnings and population percentages across five education levels.

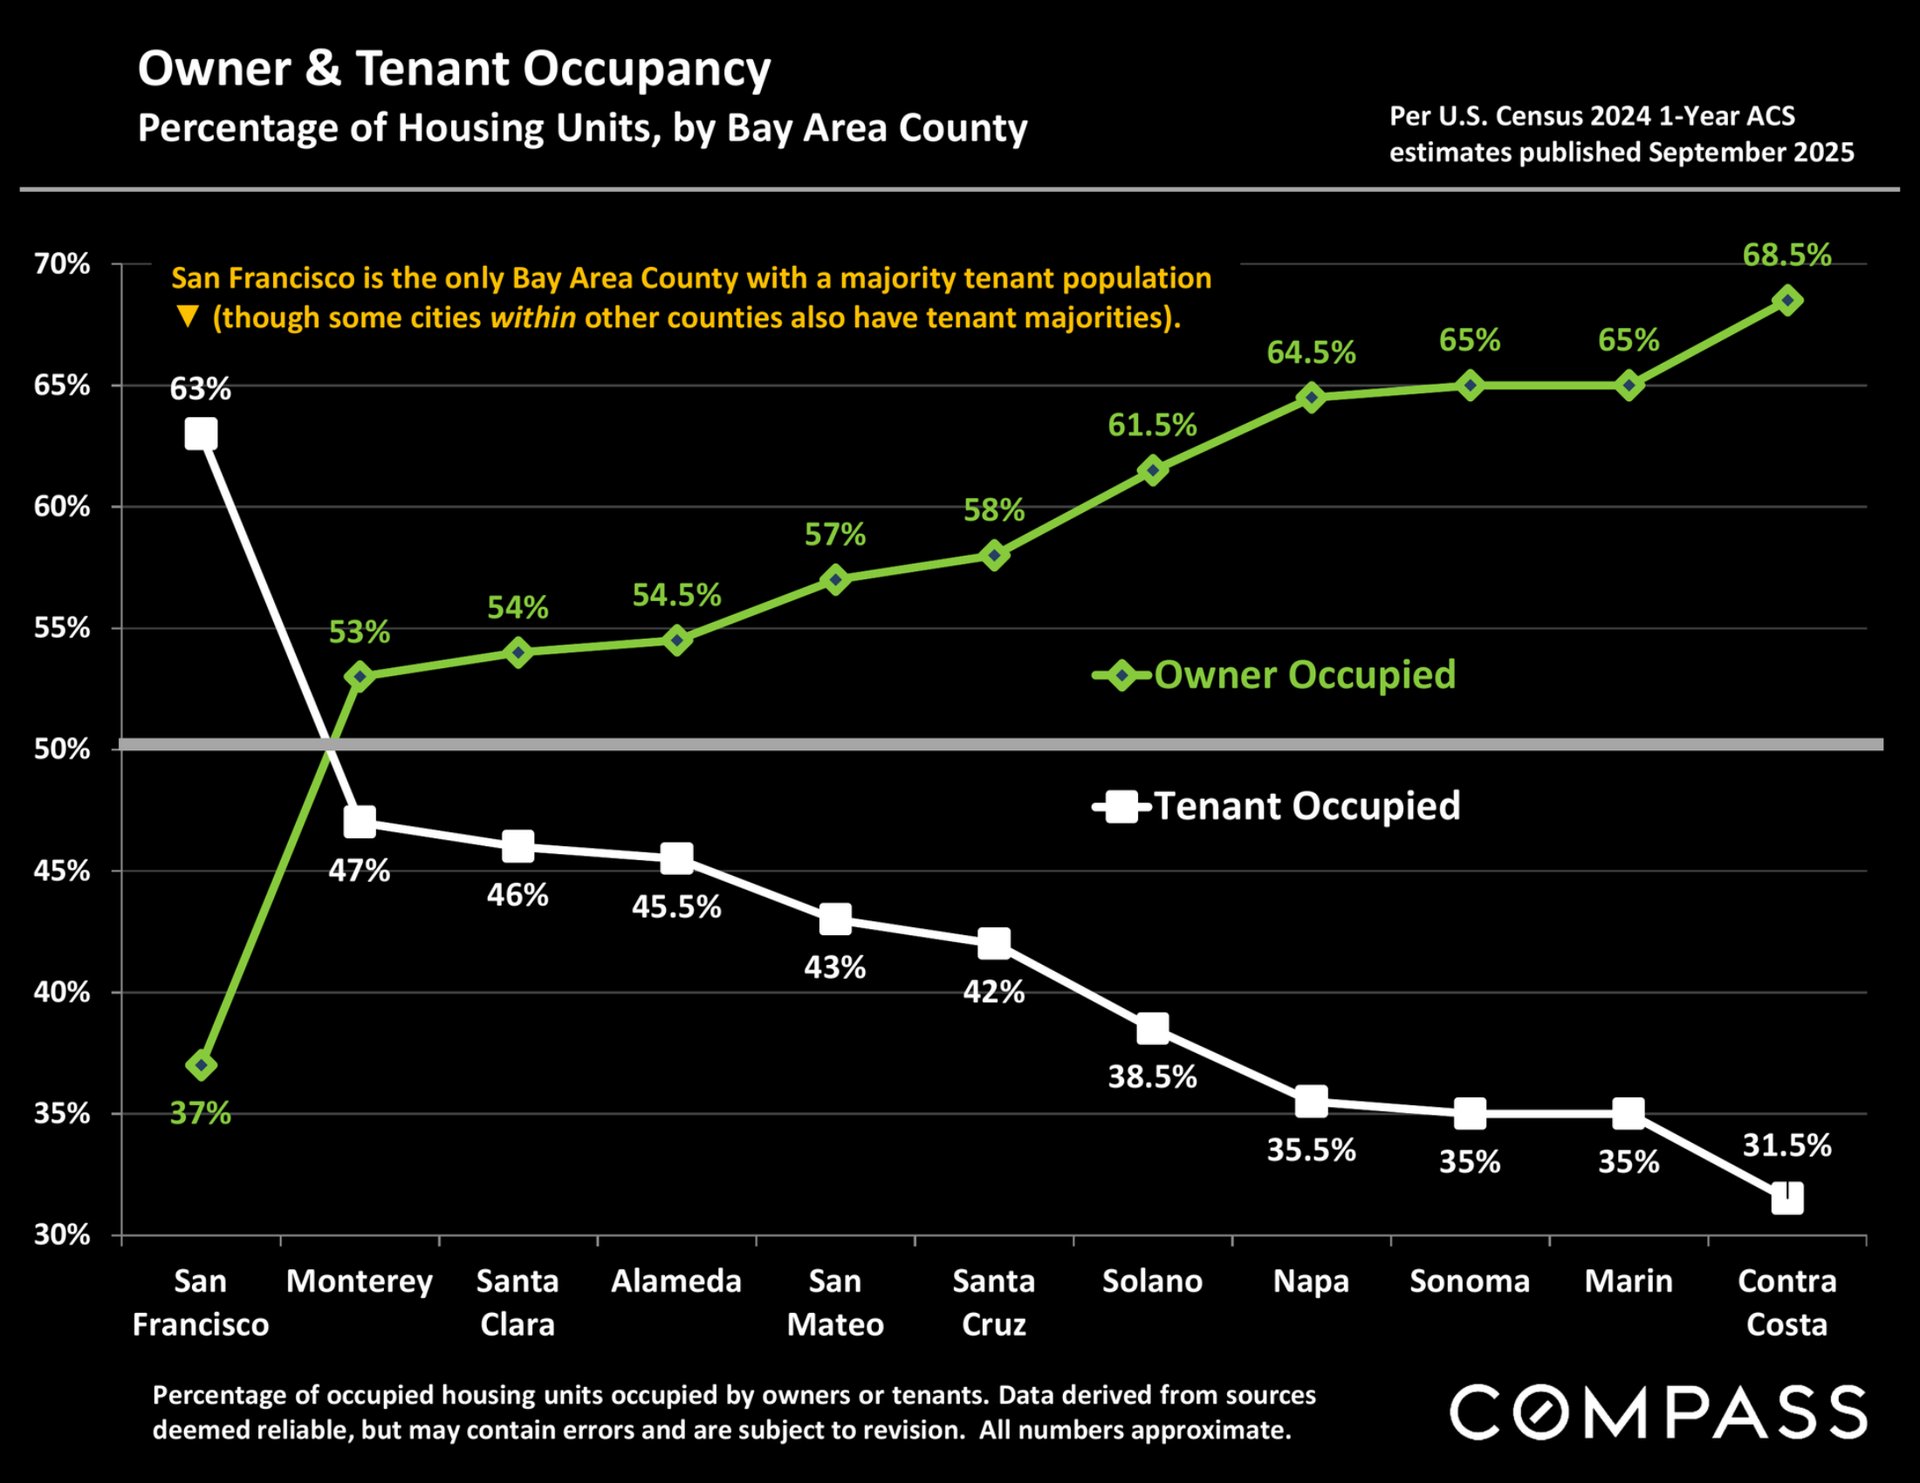
Chart compares owner- and tenant-occupied housing across Bay Area counties; San Francisco has 63% tenant occupancy.

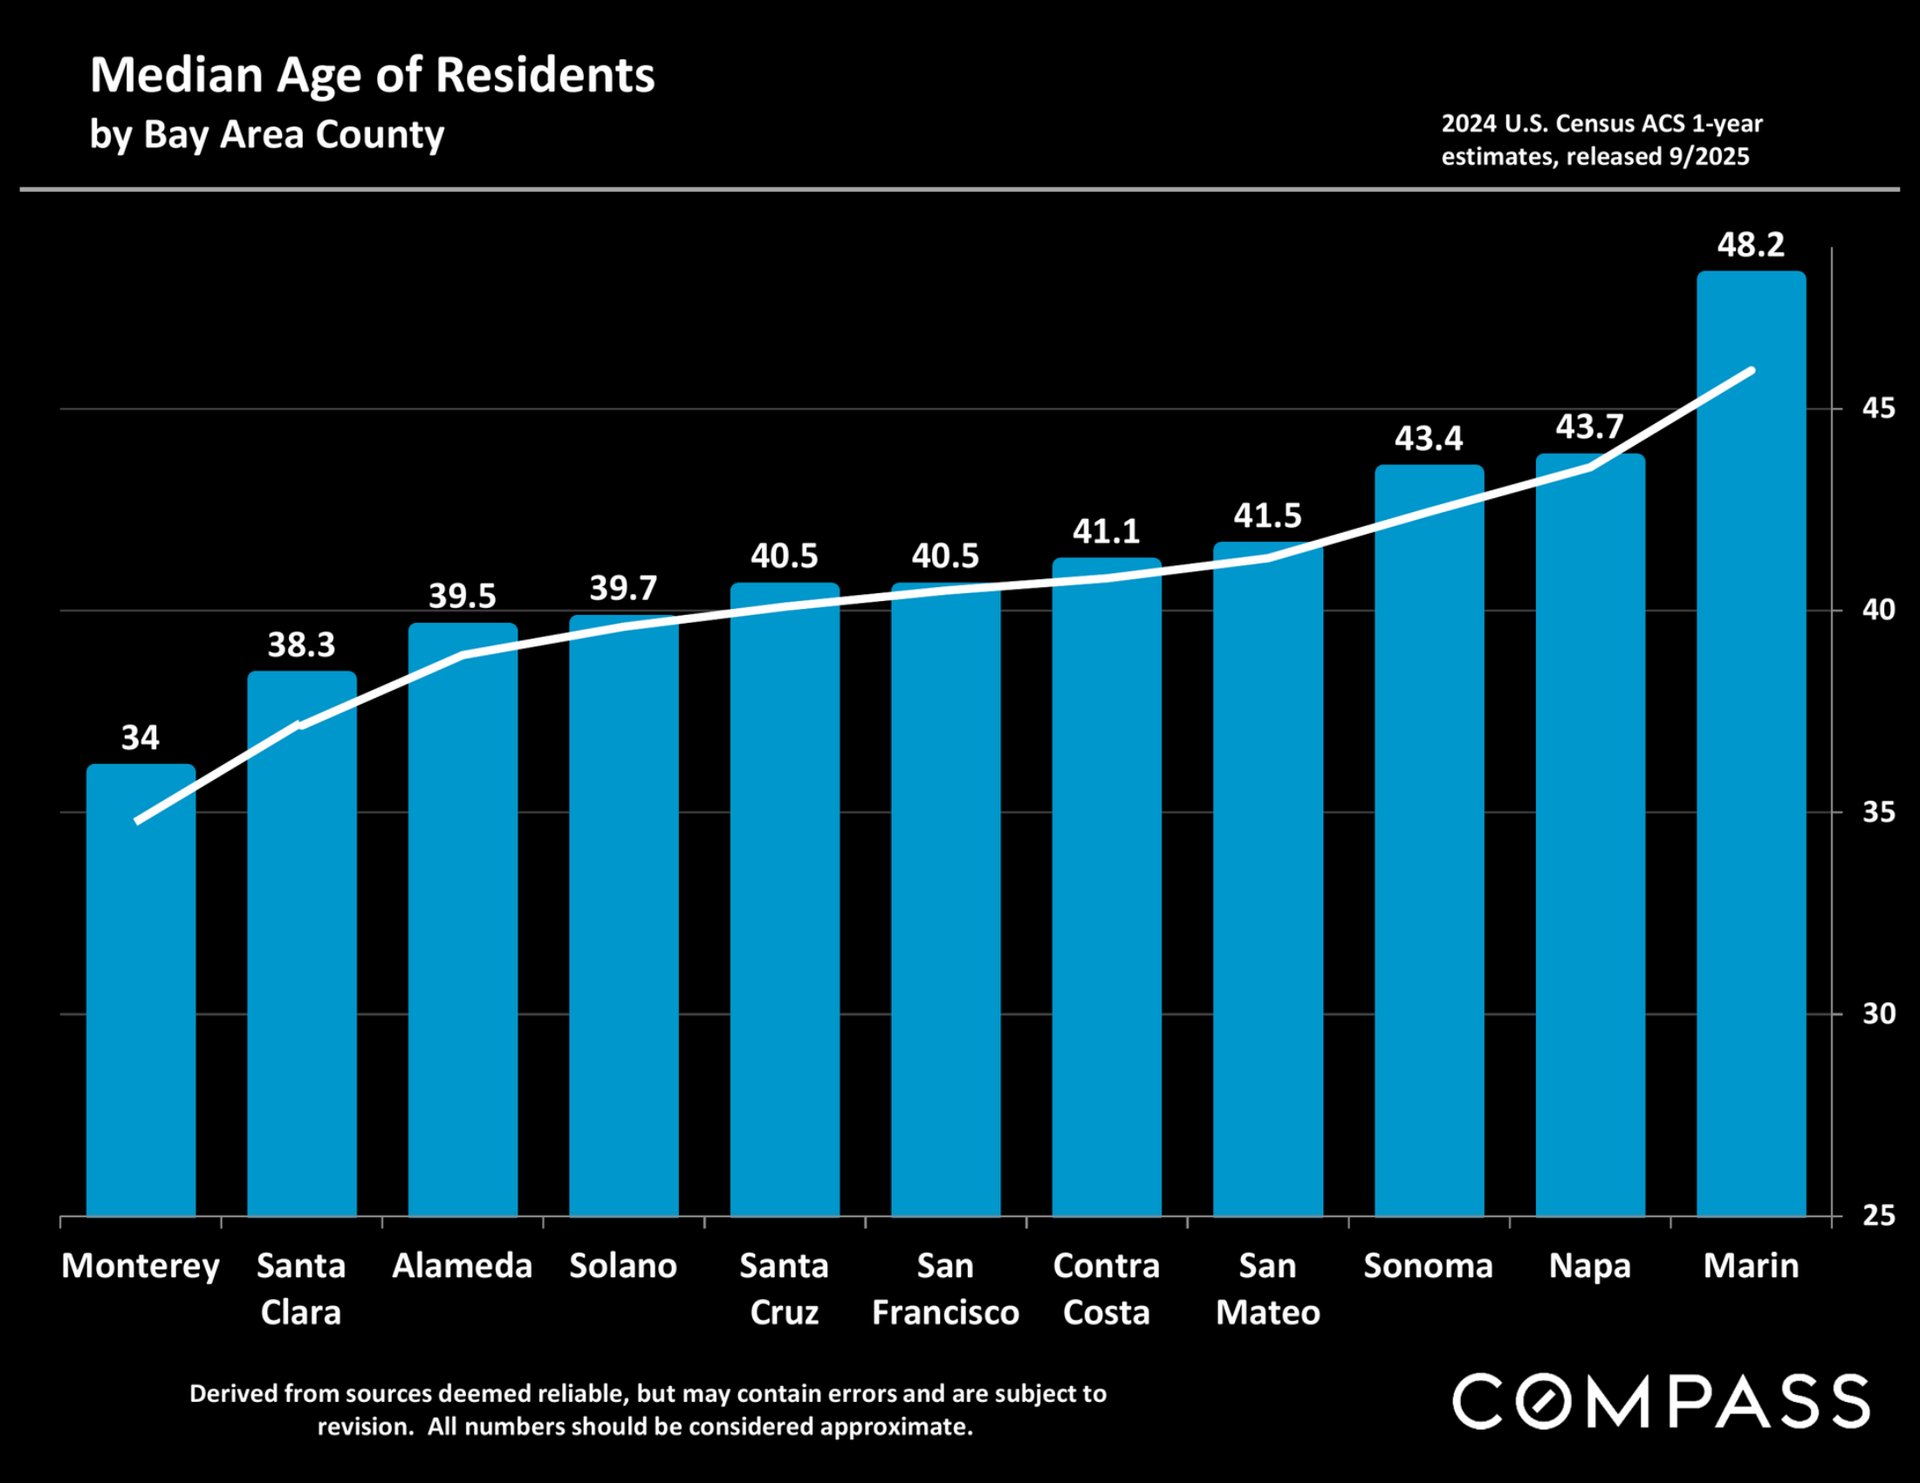
Chart of median resident ages across Bay Area counties, ranging from 34 in Monterey to 48.2 in Marin.

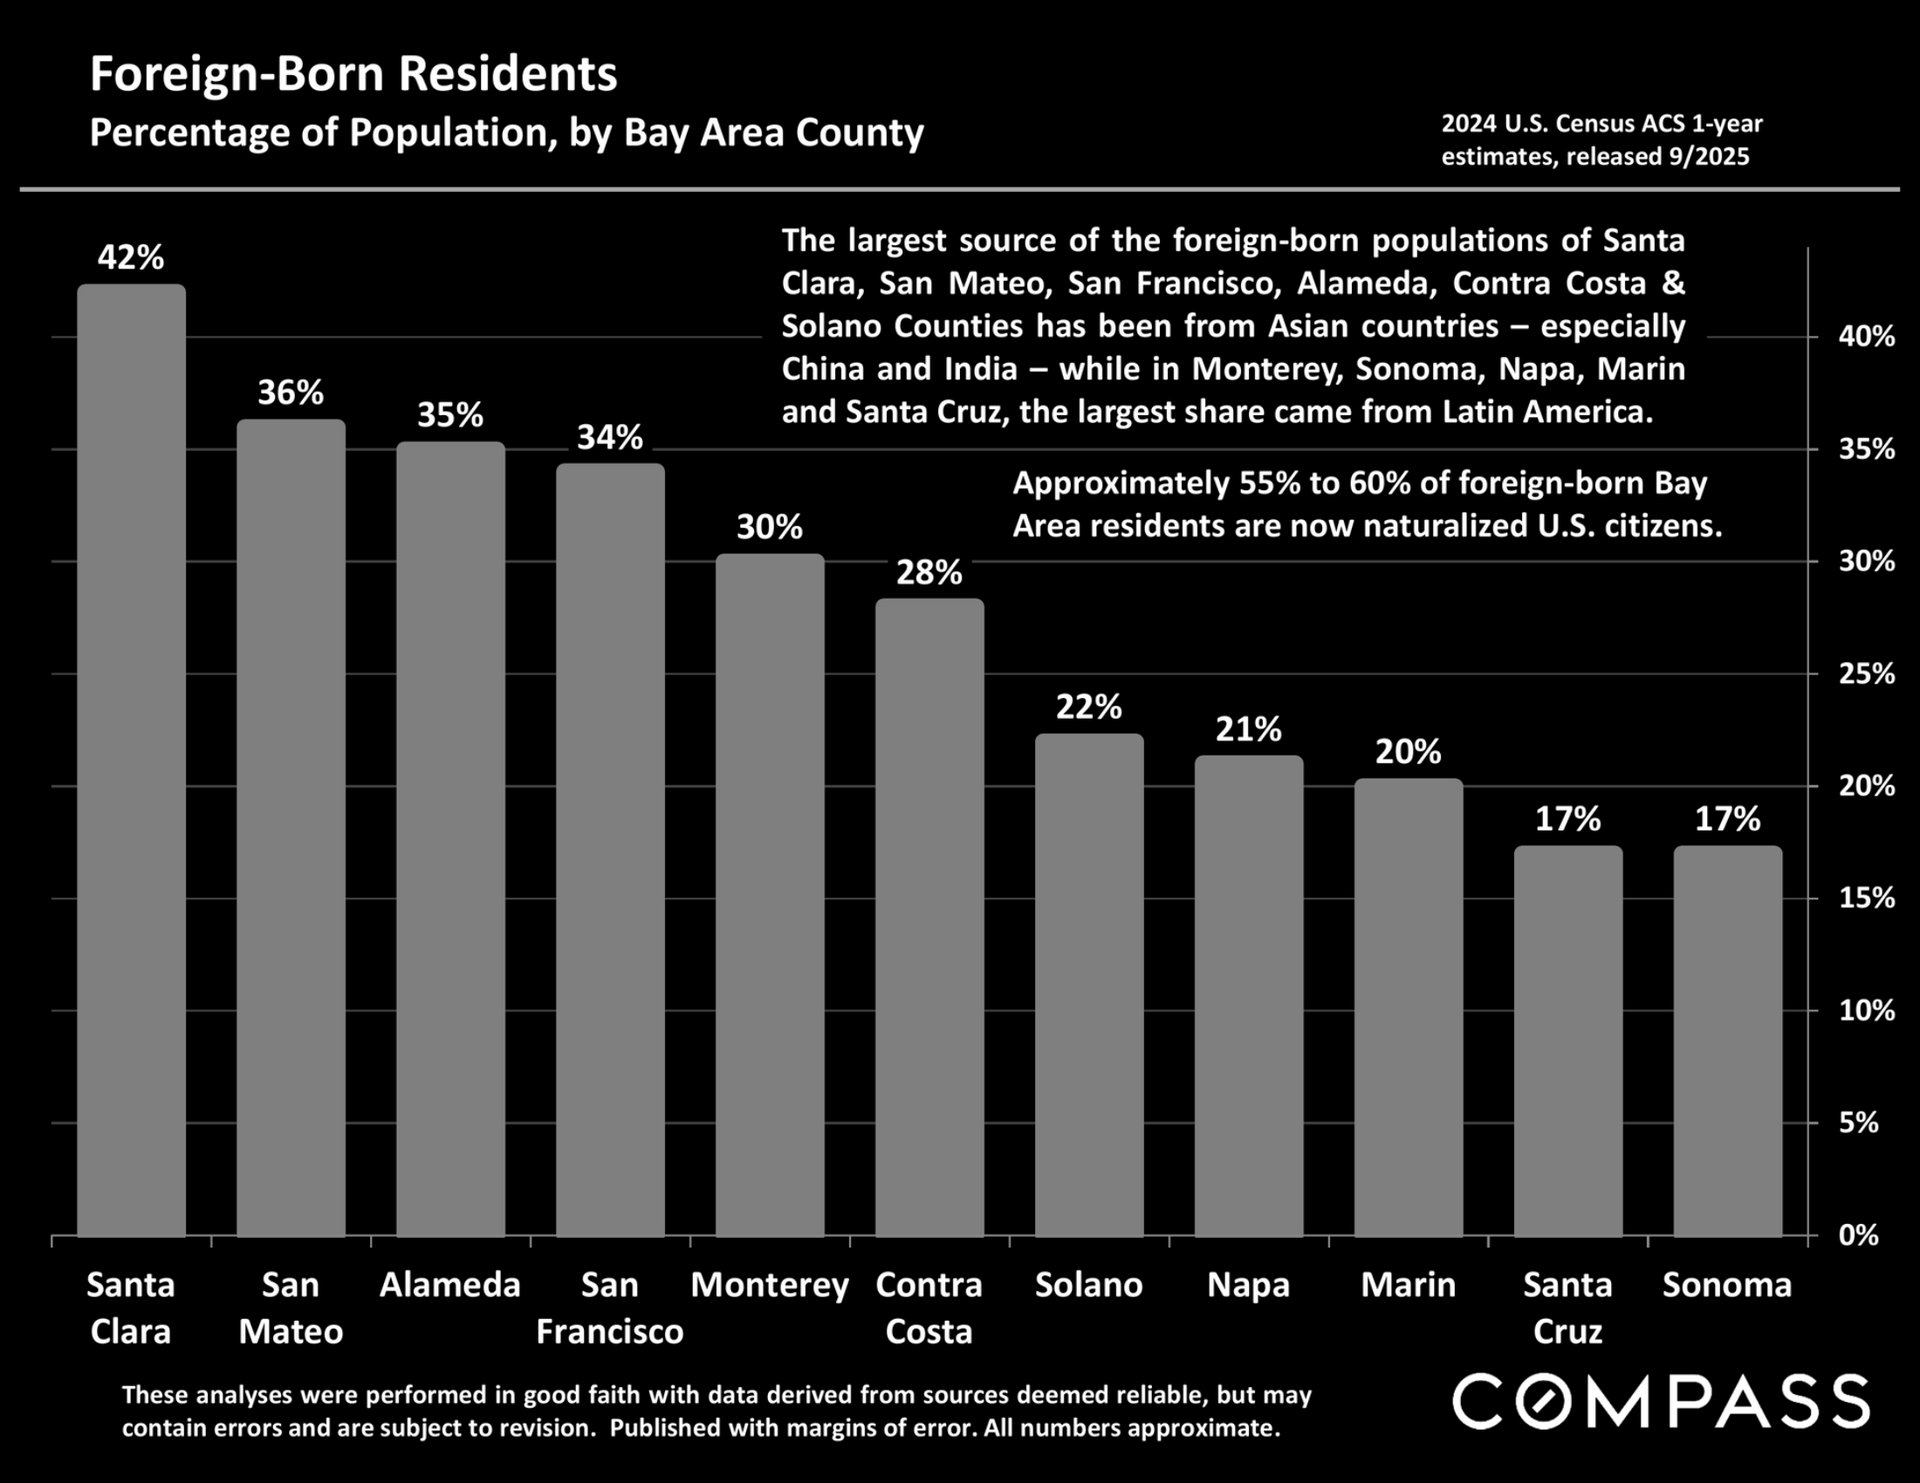
Bar chart comparing foreign-born population percentages across 11 Bay Area counties, led by Santa Clara at 42%.

Bay Area market reports webpage featuring a COMPASS banner and county report previews.

Work With Hanna John Azar

During his past experiences, Hanna John Azar has gained particularly strong knowledge and hands-on experience in maneuvering complex multi-faceted value-add investments.
Contact