Blog

The San Francisco 2-4 Unit Apartment Building Market

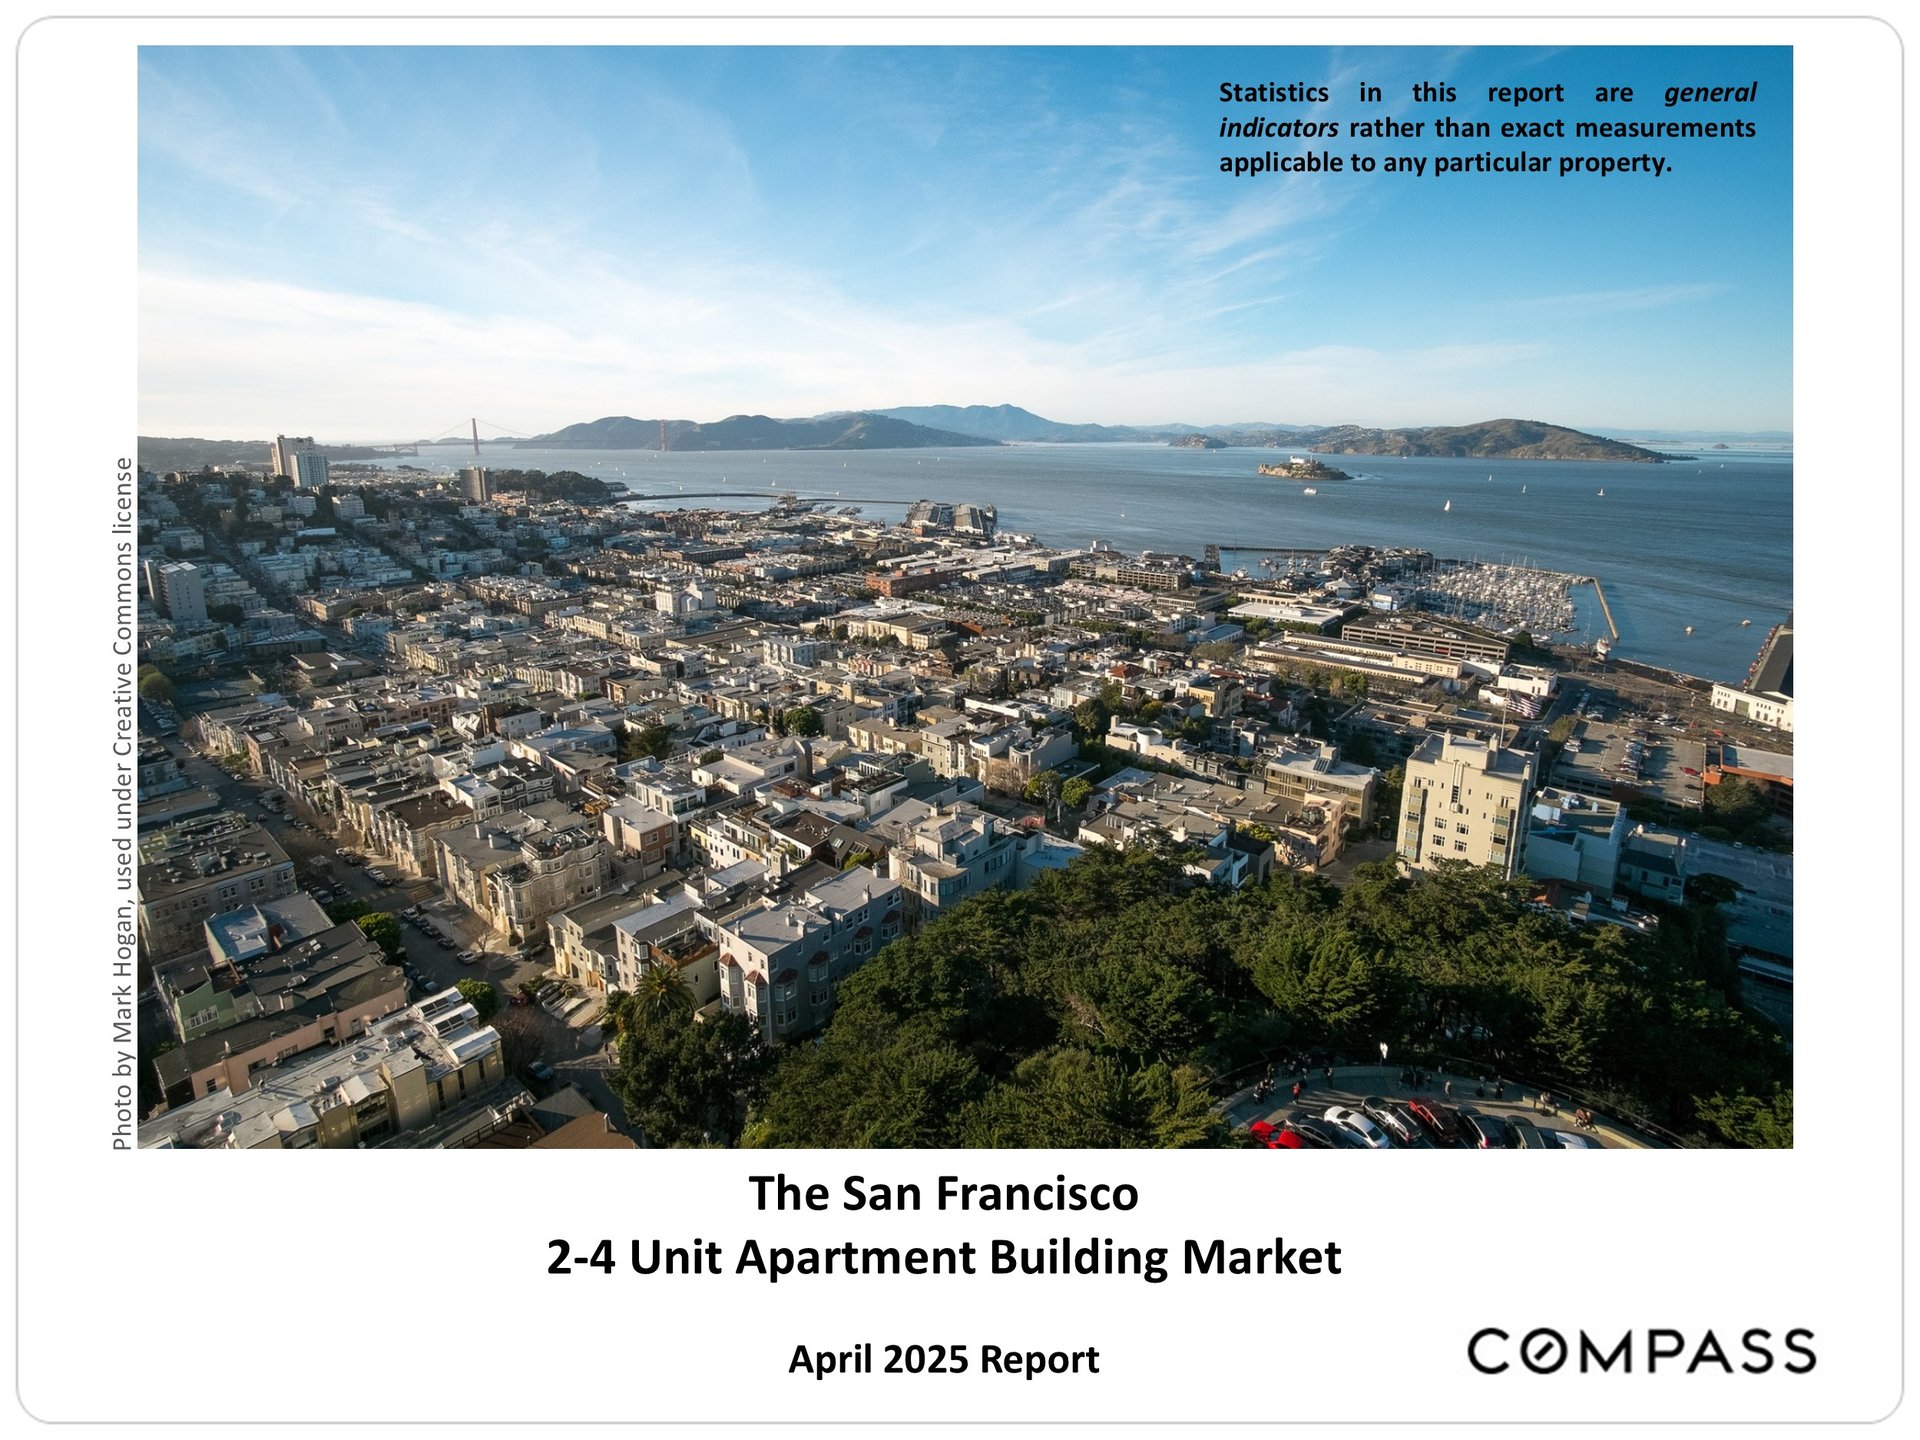
Cover of the April 2025 San Francisco 2–4 Unit Apartment Building Market report, featuring an aerial city and bay view.

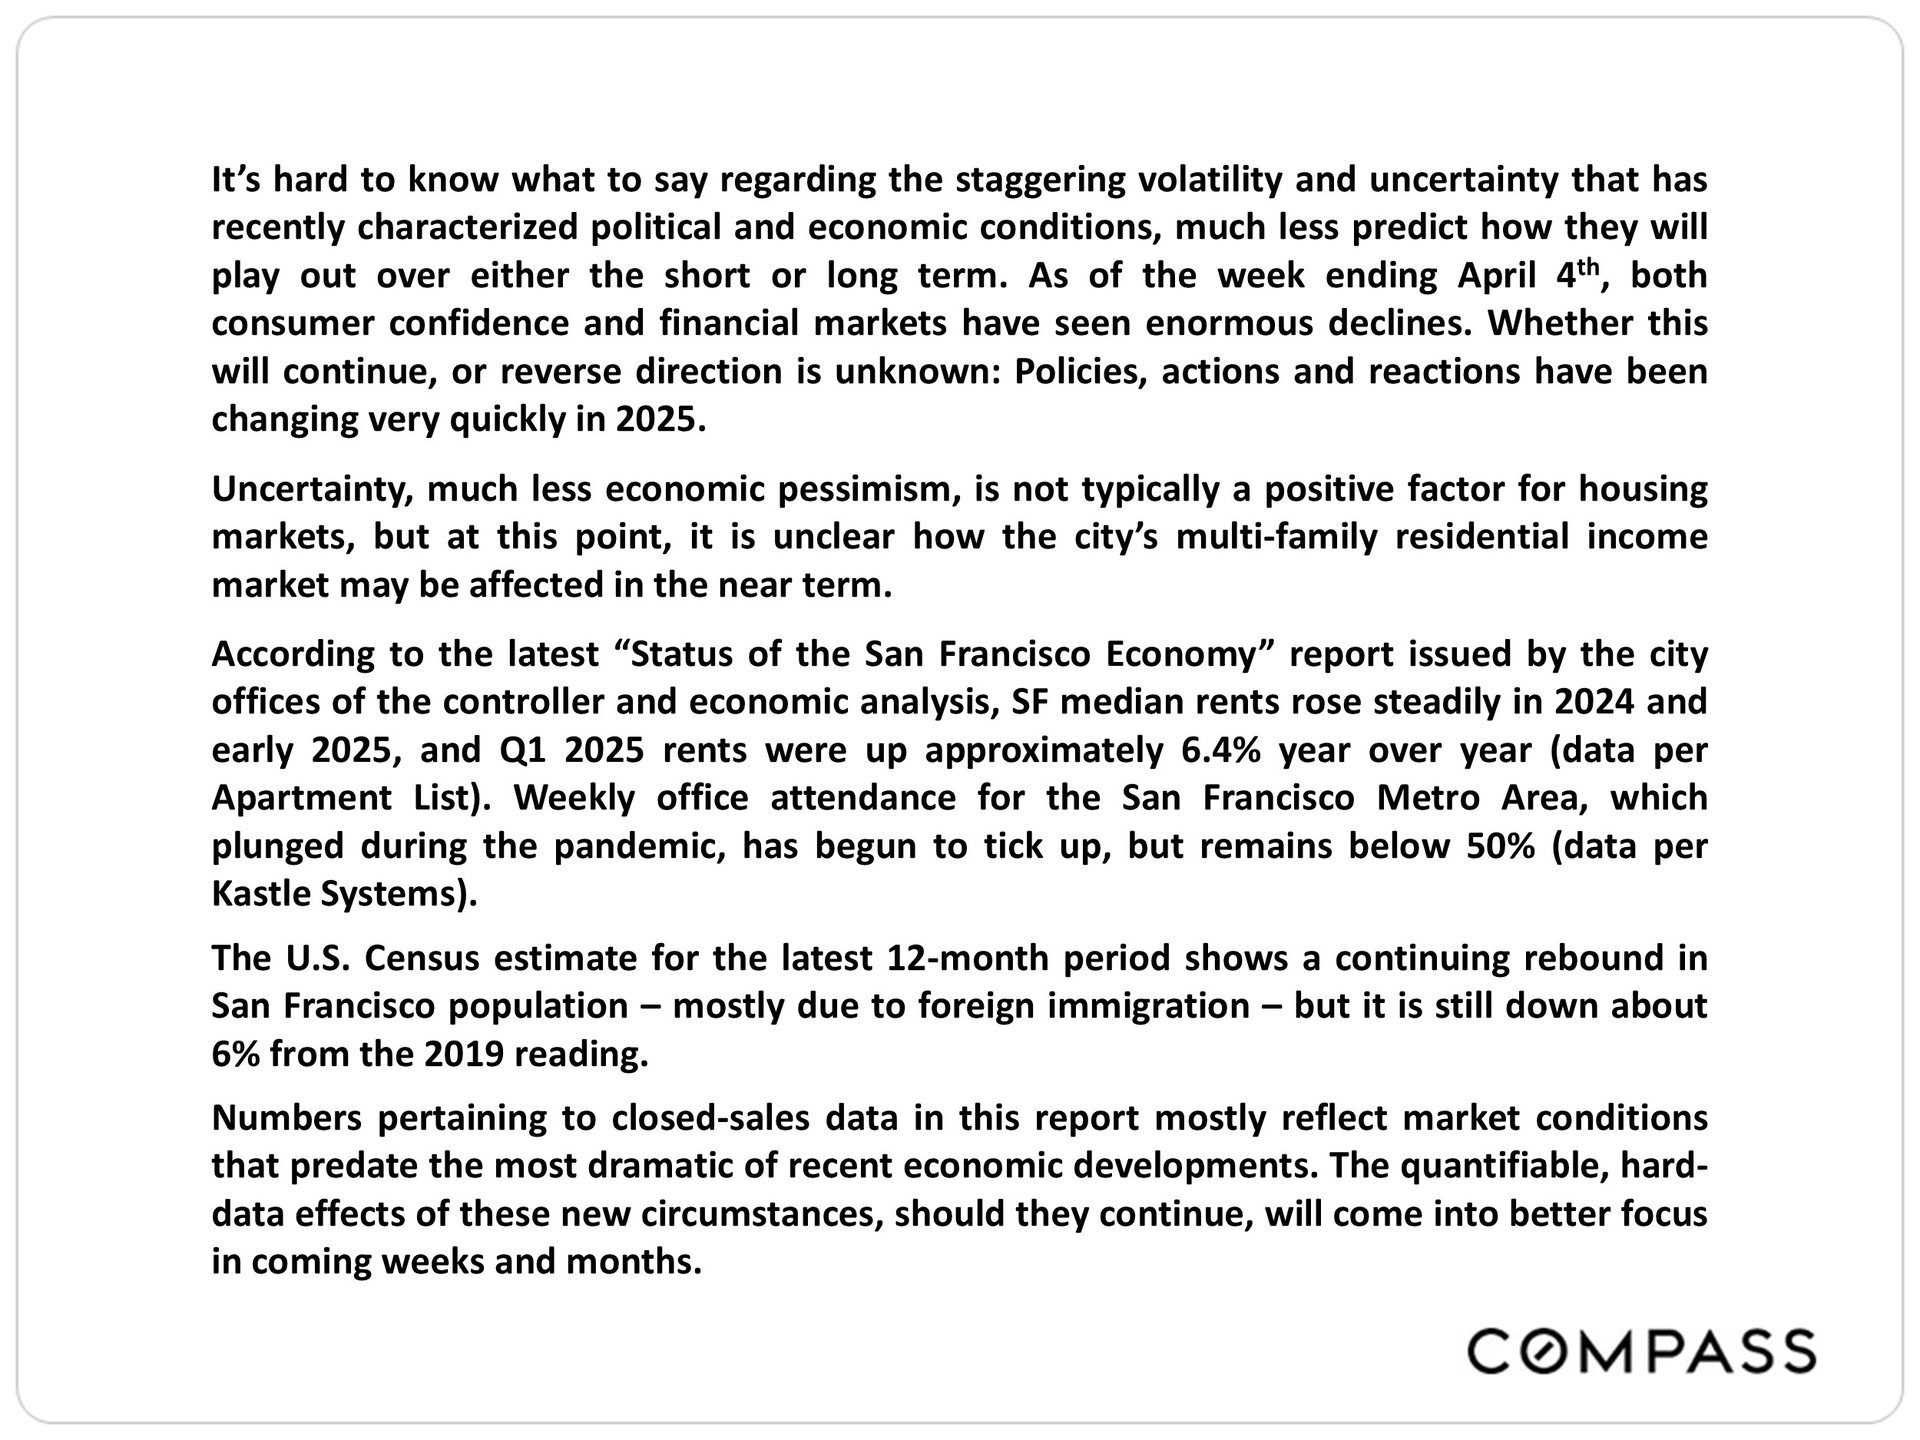
Text summary of San Francisco economic conditions and their potential effects on the multifamily housing market.

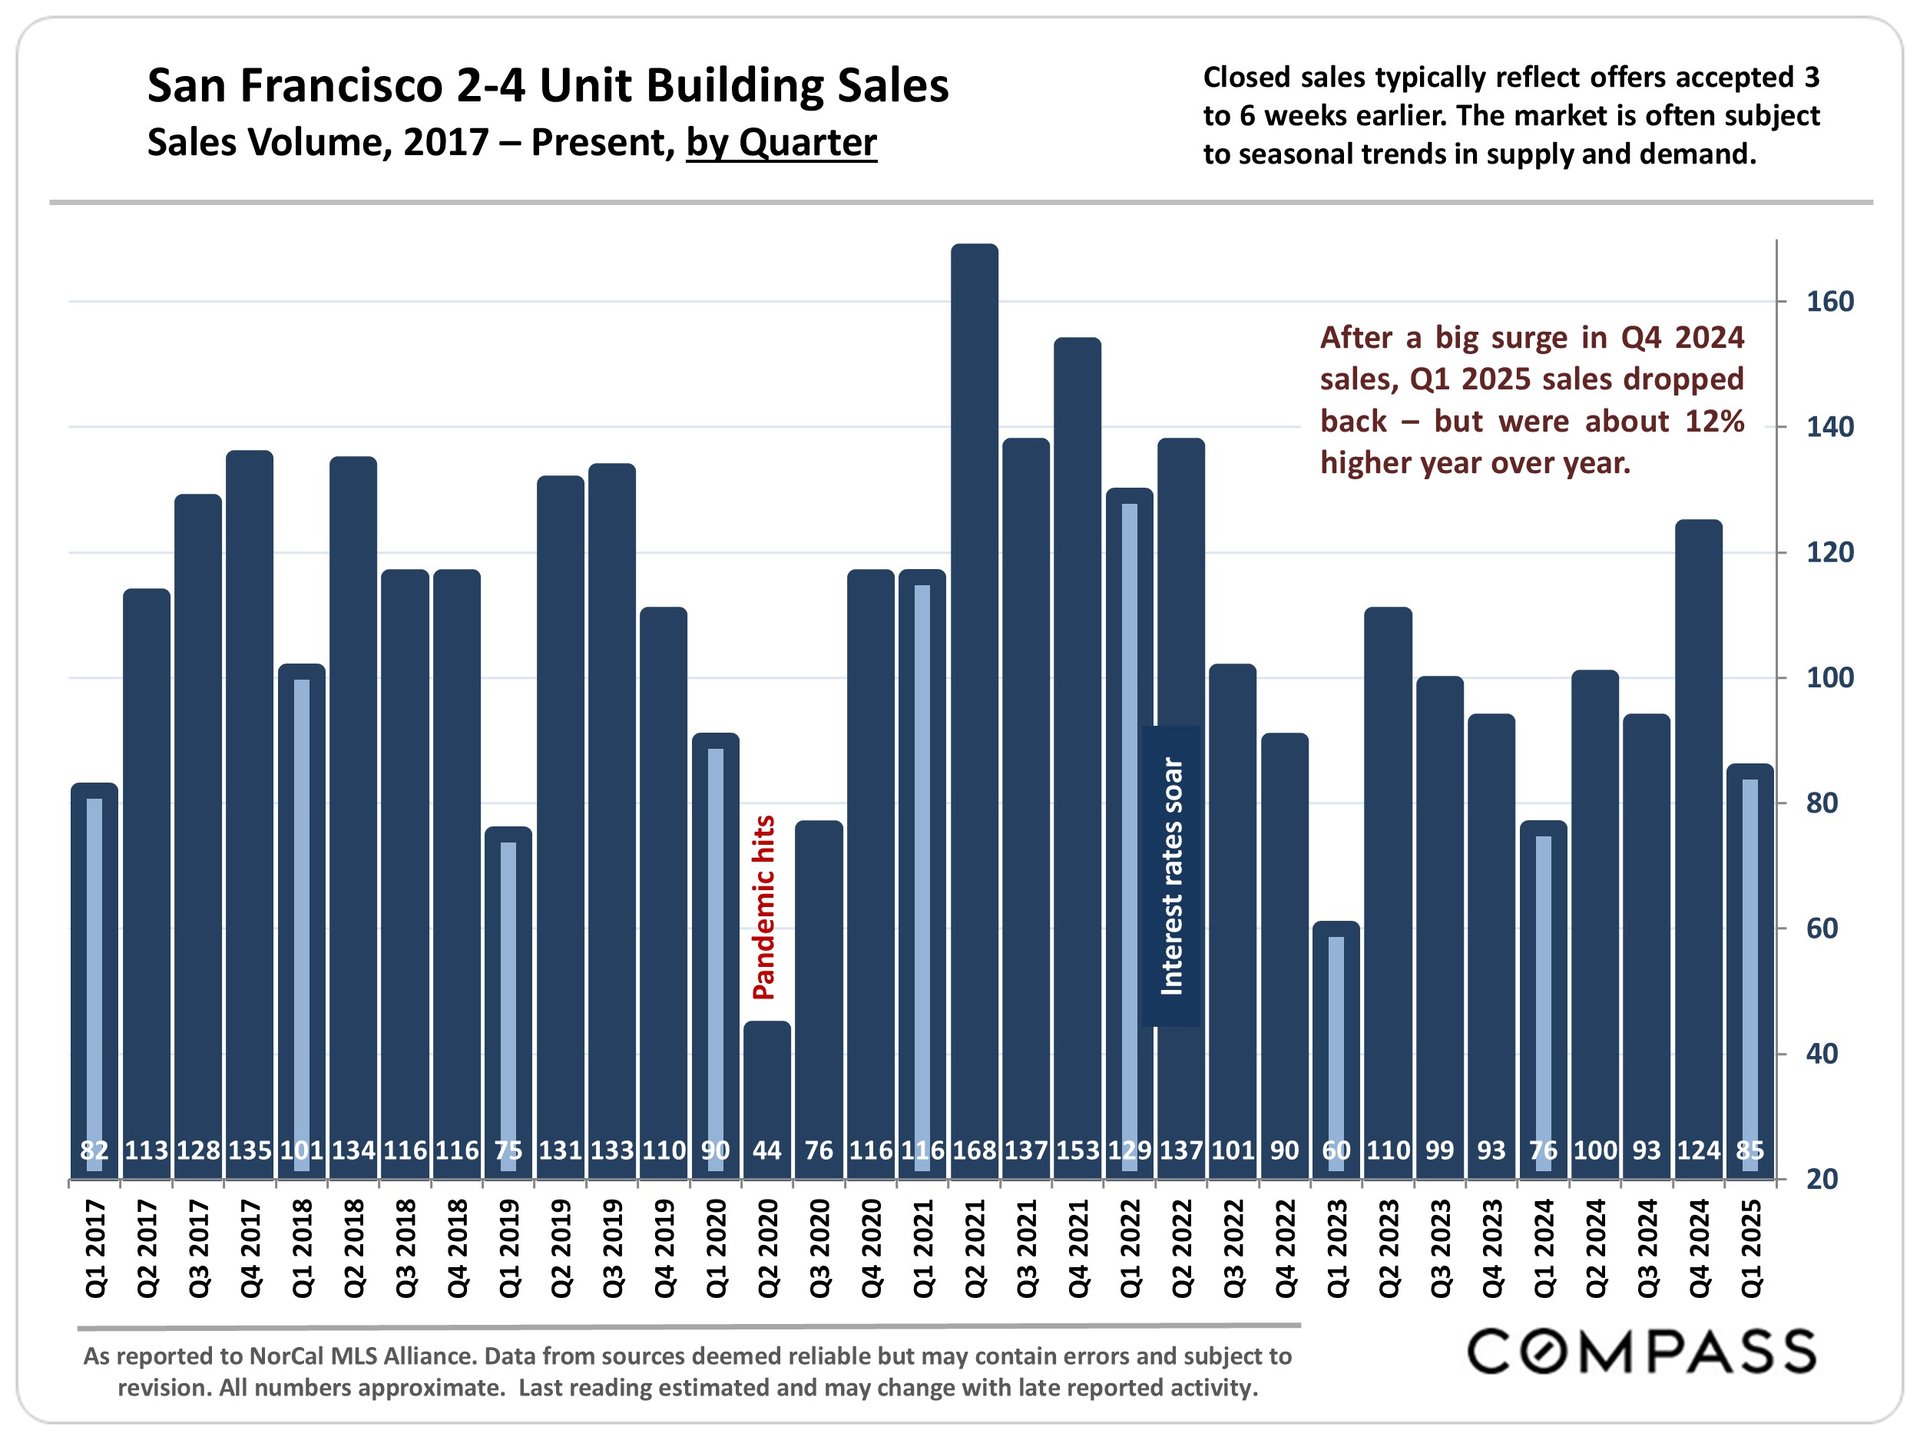
Bar chart of San Francisco 2–4 unit building sales by quarter, 2017–2025, with pandemic and interest-rate annotations.

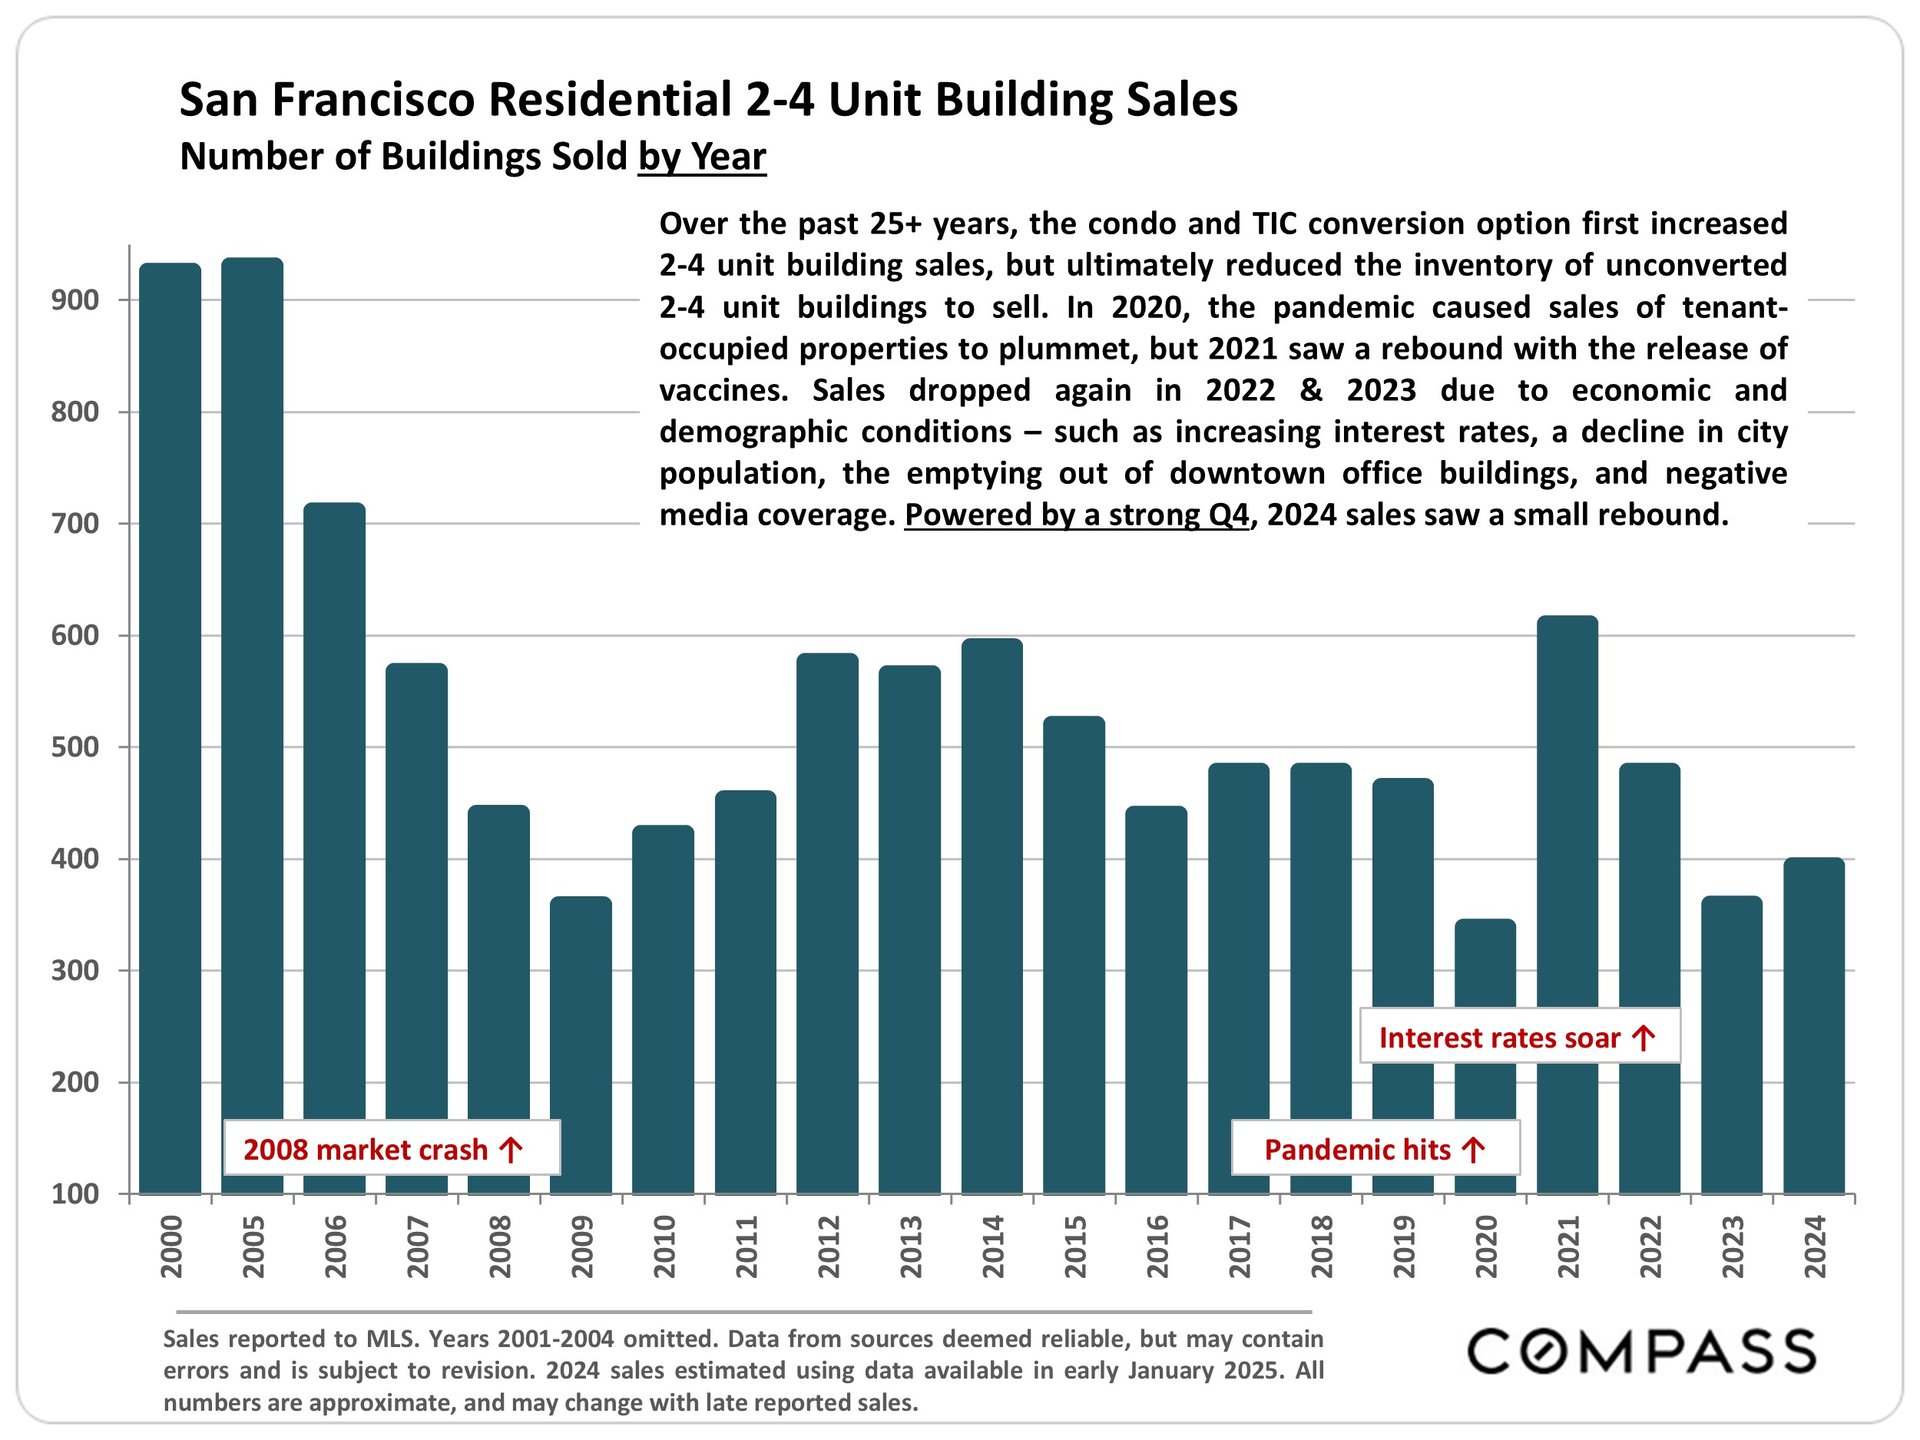
Bar chart of San Francisco residential 2–4 unit building sales by year, with annotations for the 2008 crash and pandemic.

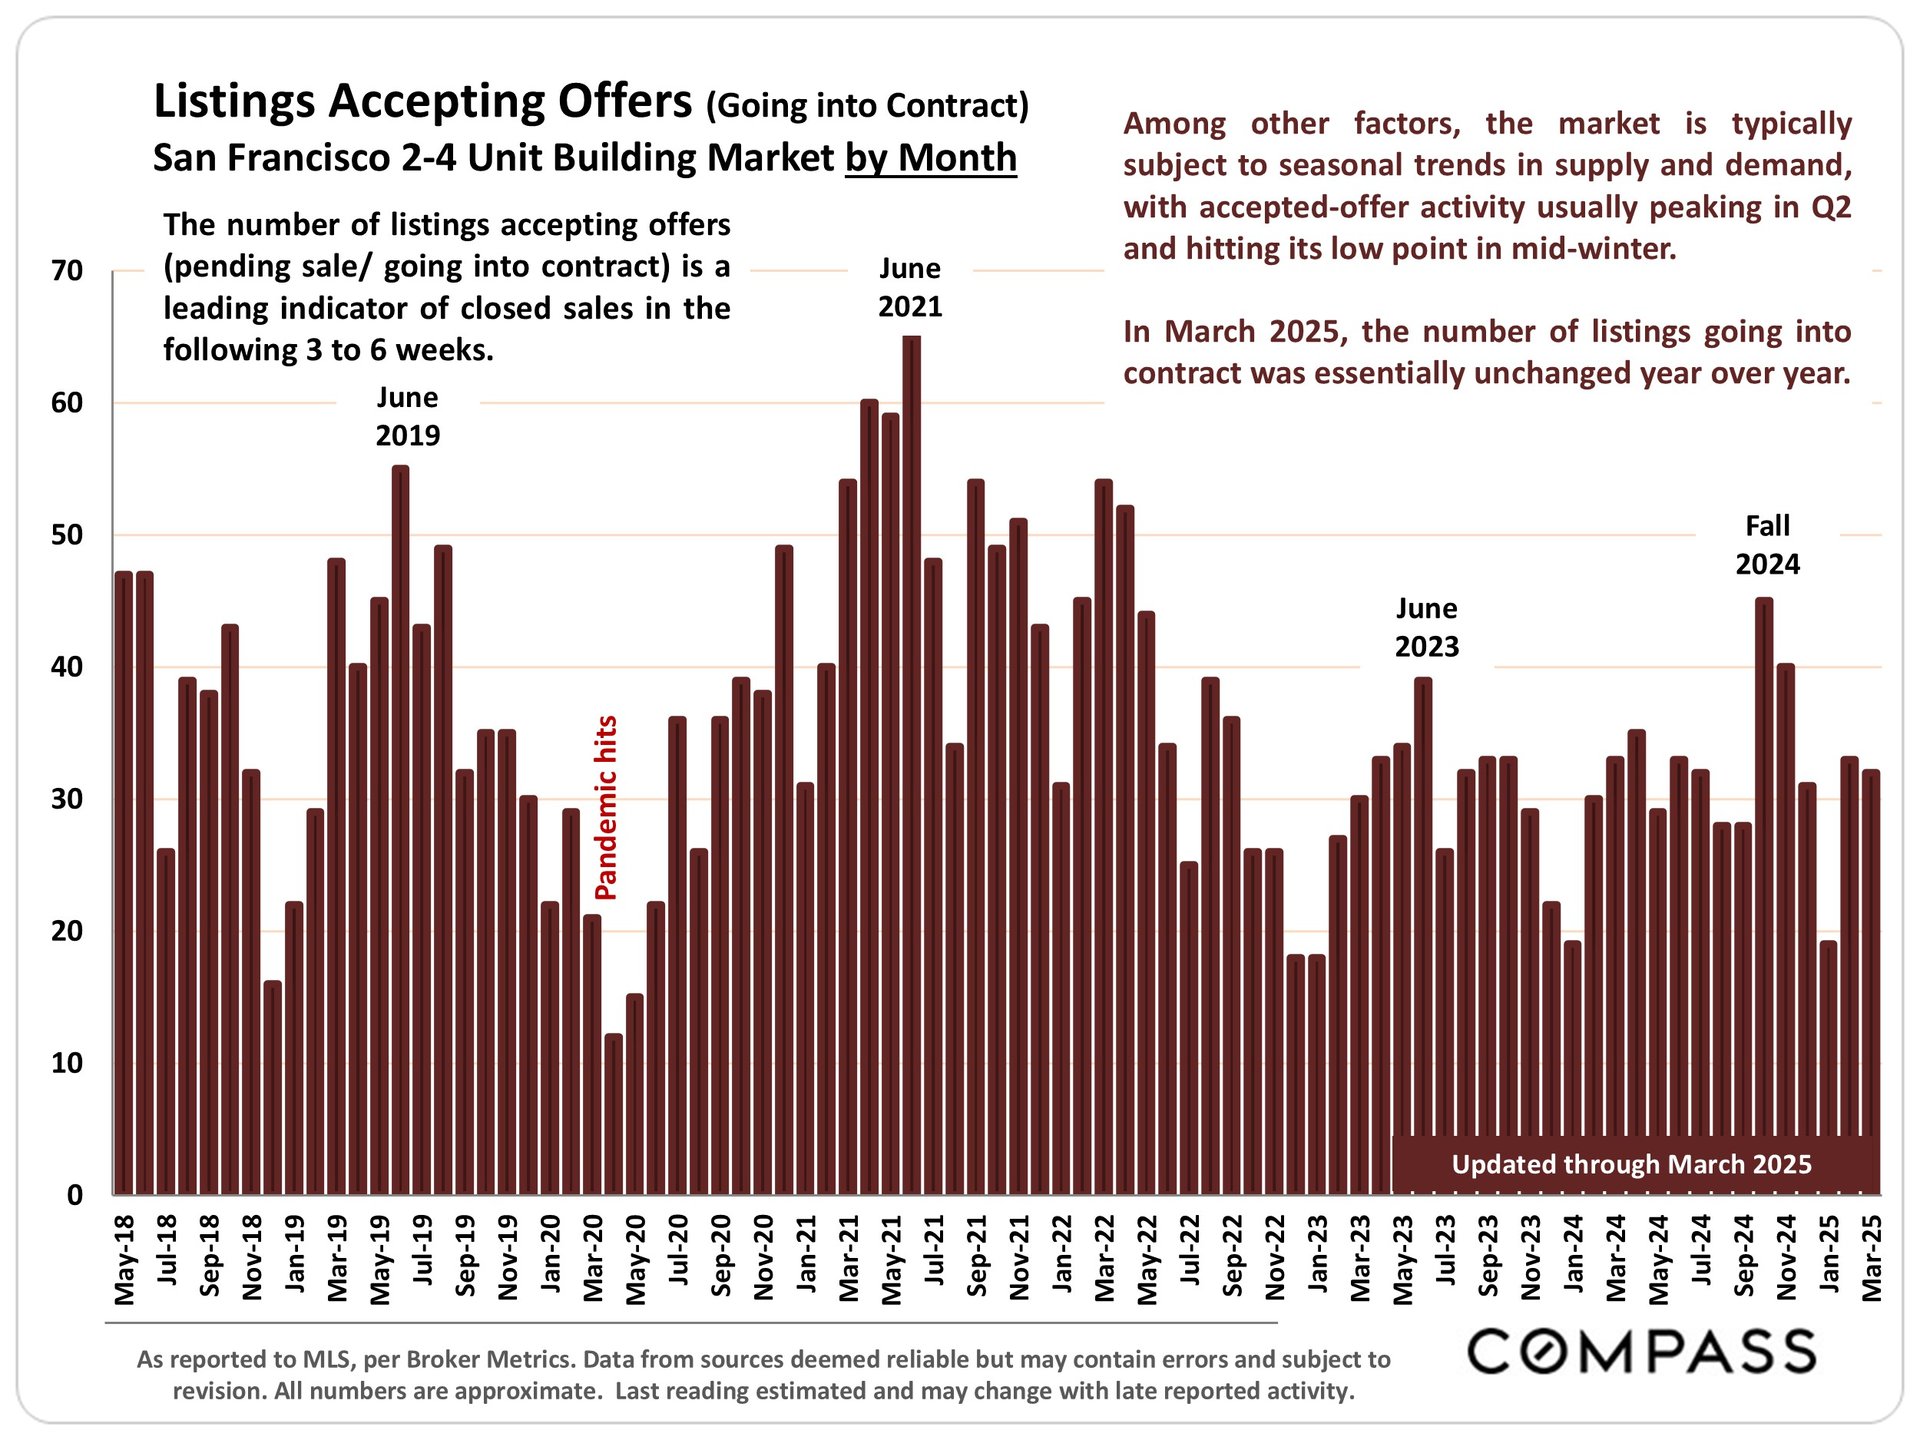
Bar chart of San Francisco 2–4-unit listings accepting offers monthly, May 2018–March 2025, with a 2021 peak.

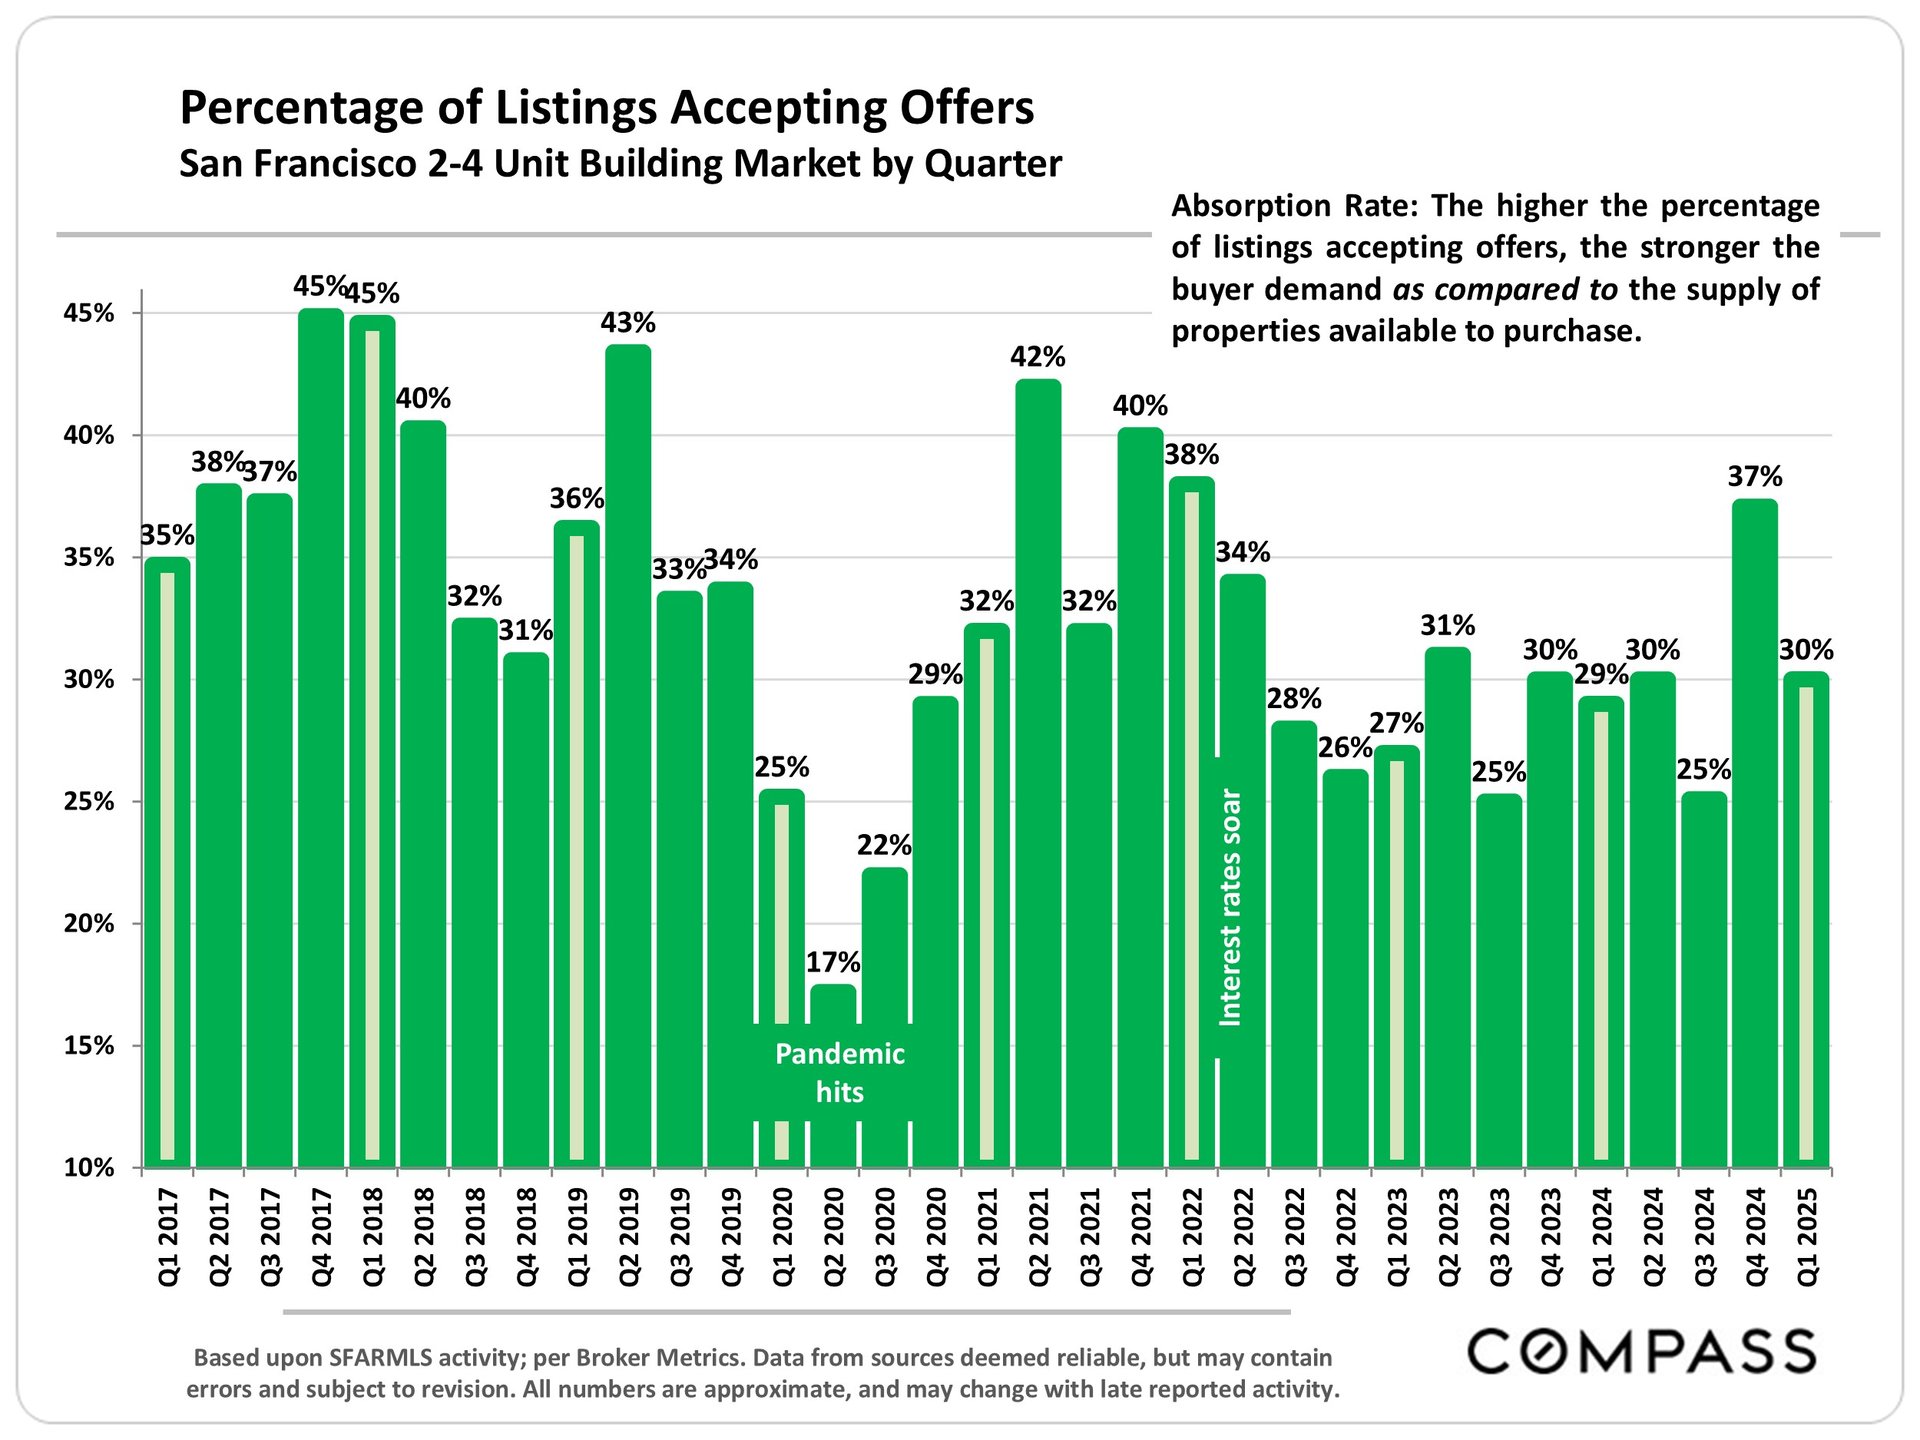
Quarterly chart of San Francisco 2–4 unit building listings accepting offers, Q1 2017–Q1 2025, with pandemic and interest-rate annotations.

Chart of San Francisco 2–4 unit building median sale prices by quarter, from Q1 2018 through Q1 2025.

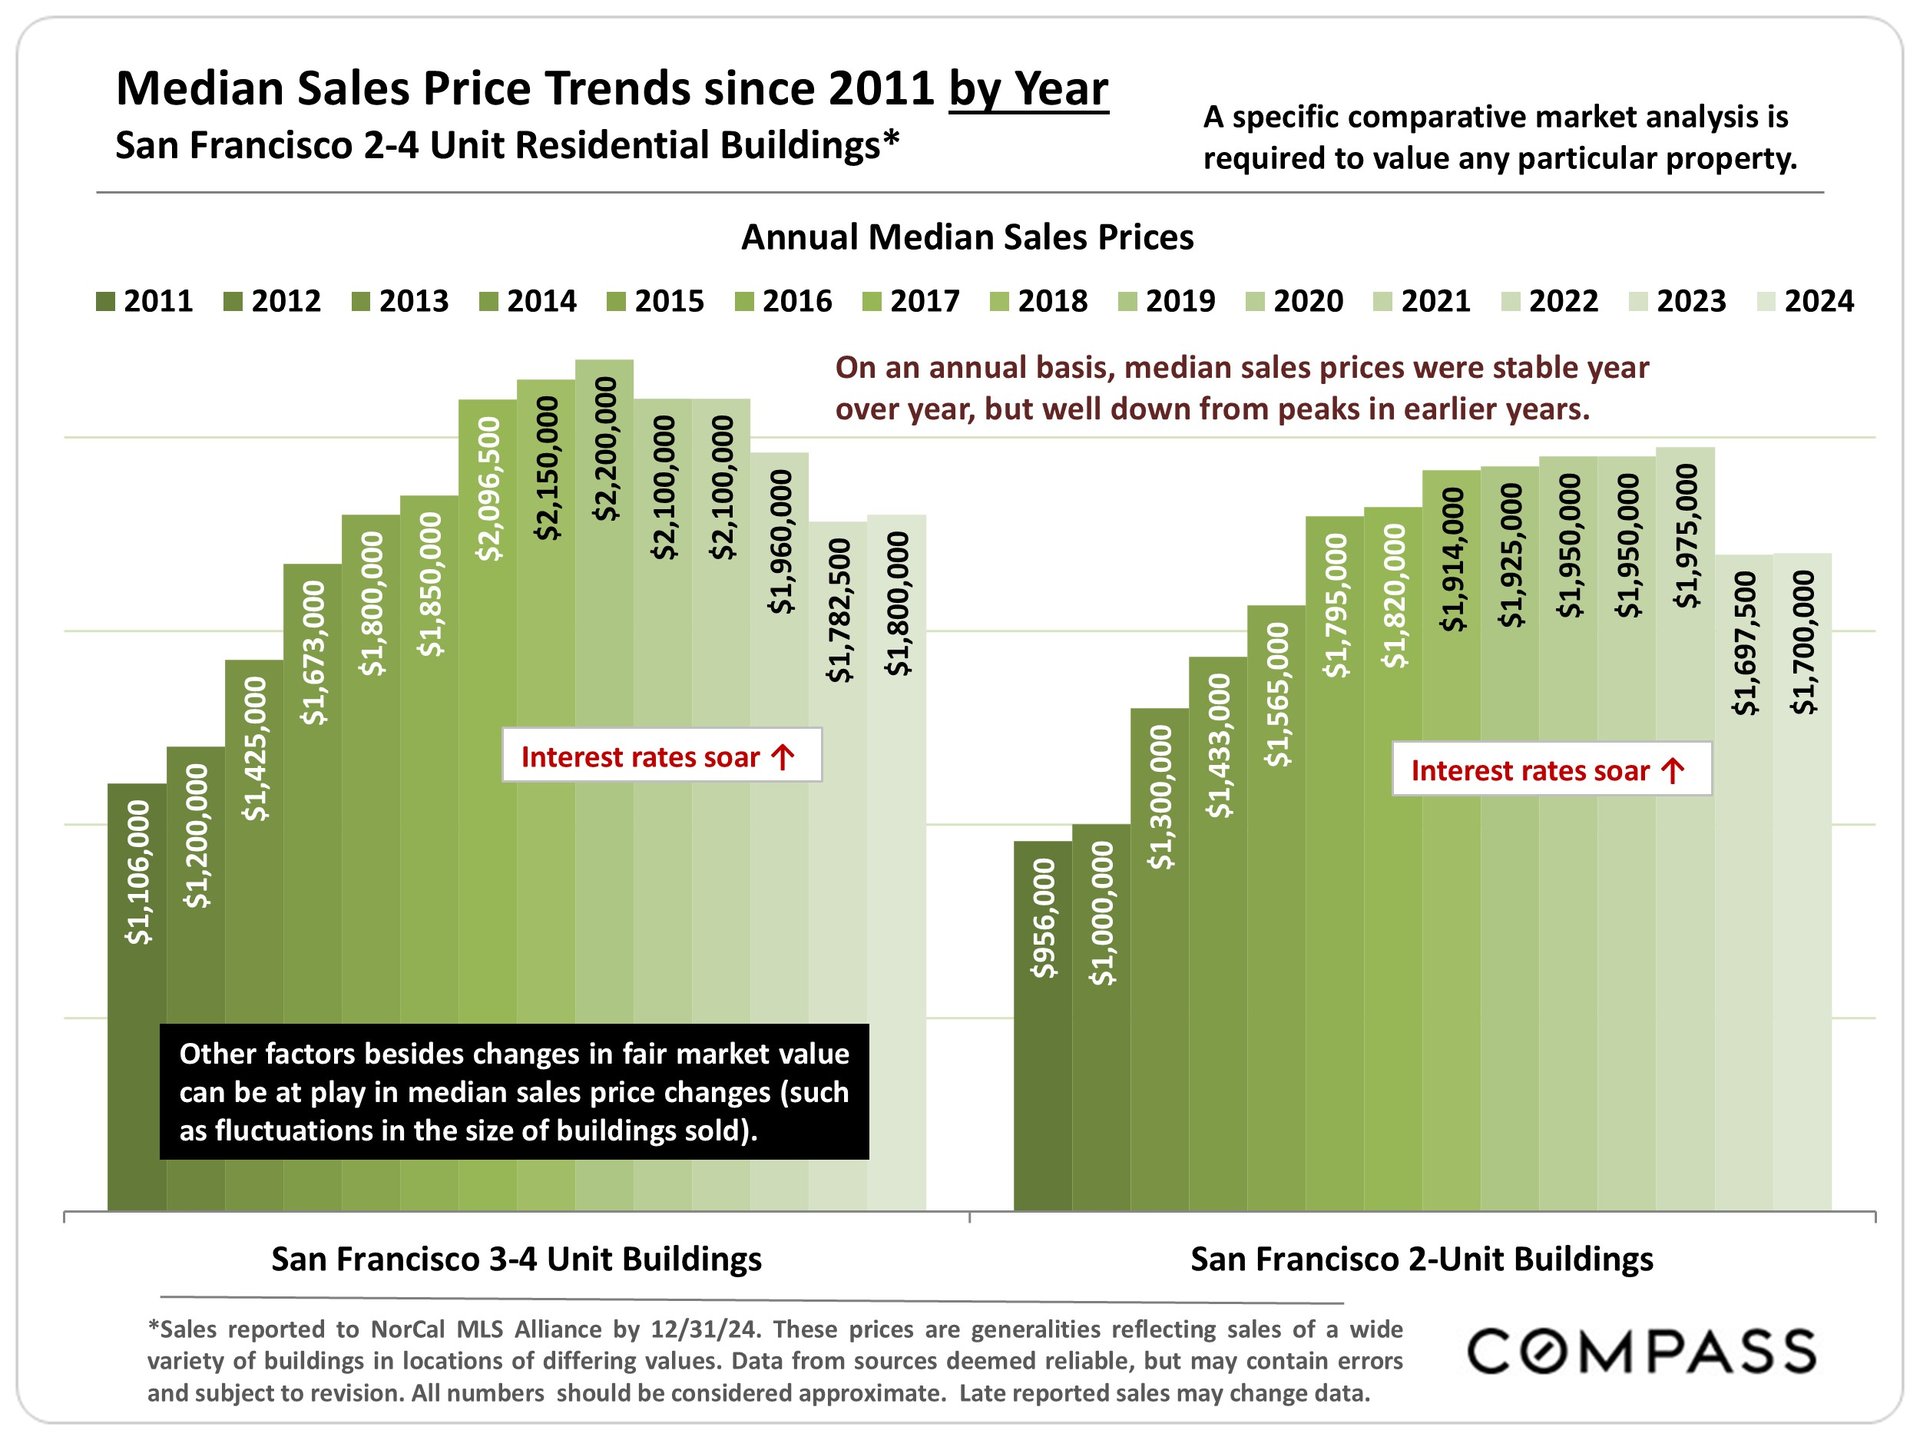
Chart comparing San Francisco 2-unit and 3–4-unit building median sale prices from 2011 to 2024.

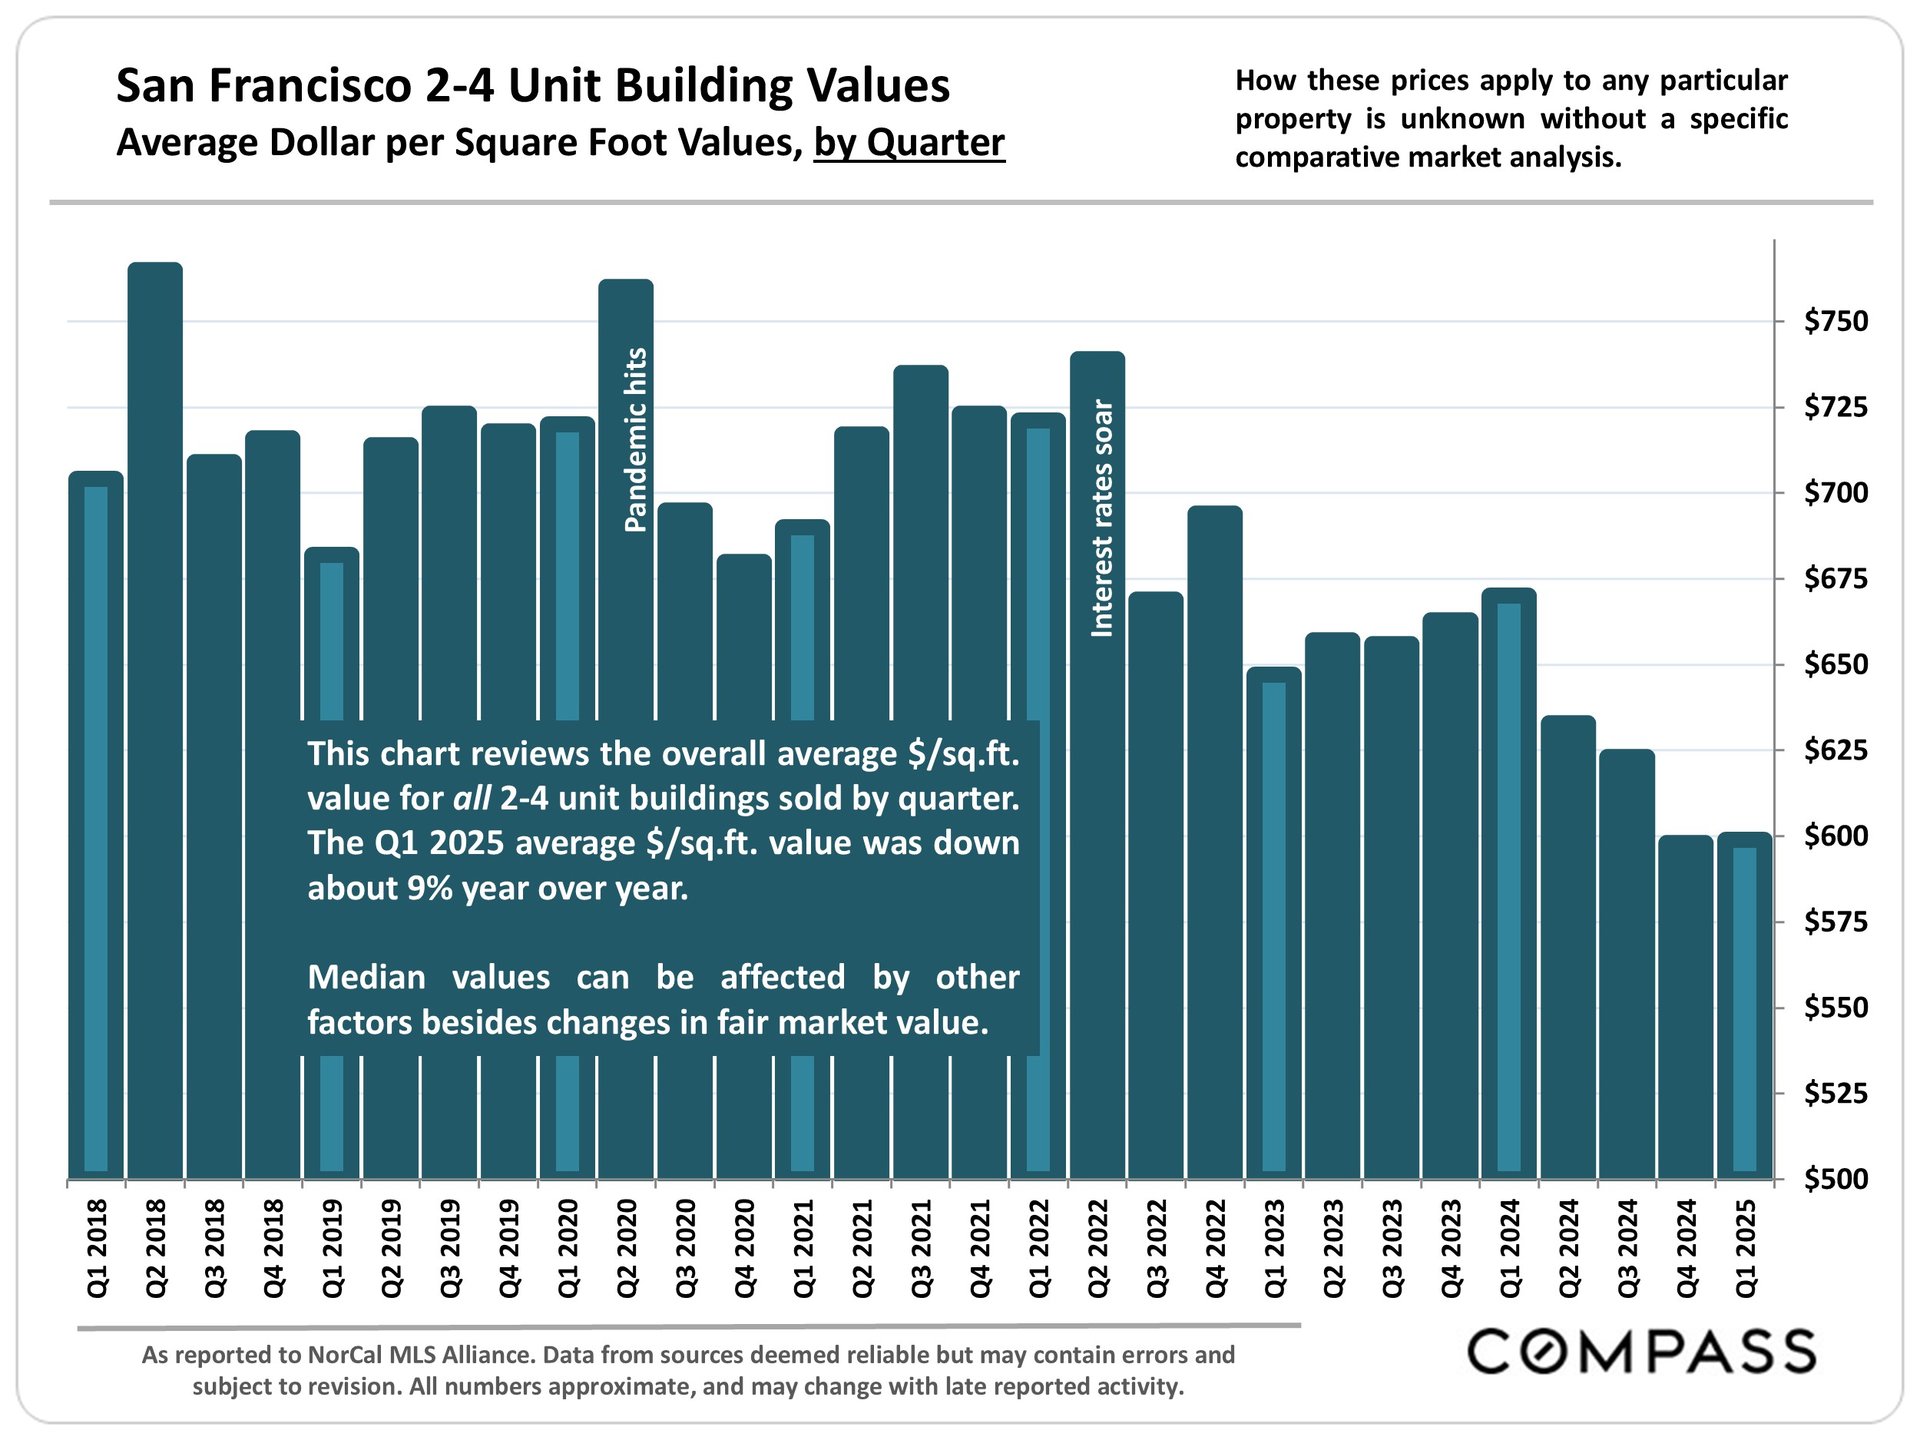
Chart of San Francisco 2–4 unit building values per square foot by quarter, declining to about $600 in Q1 2025.

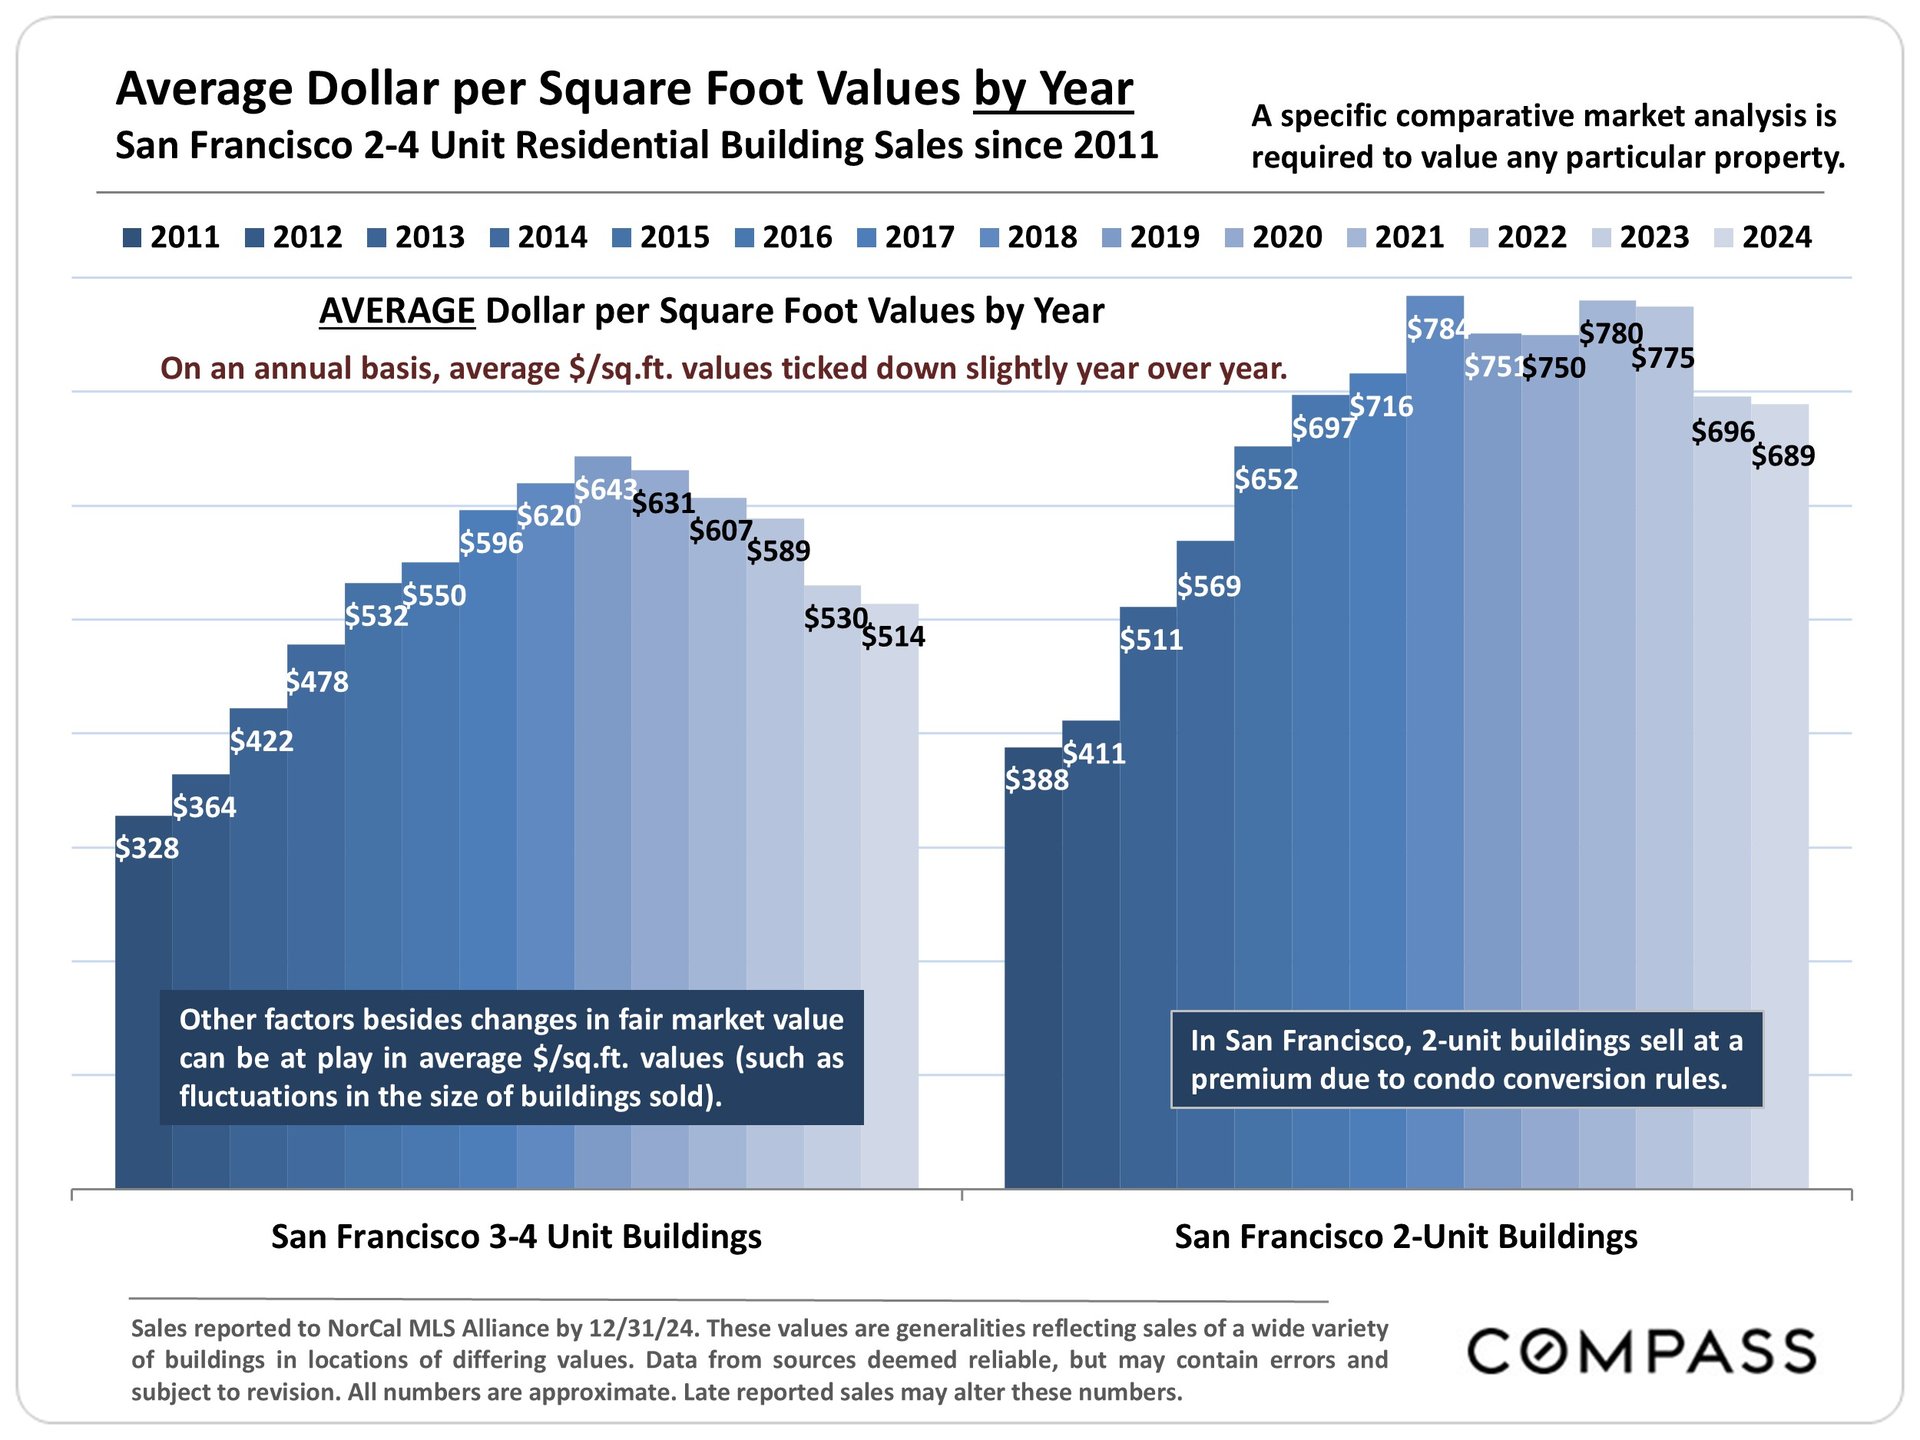
Chart comparing San Francisco 2-unit and 3–4-unit building prices per square foot from 2011 to 2024.

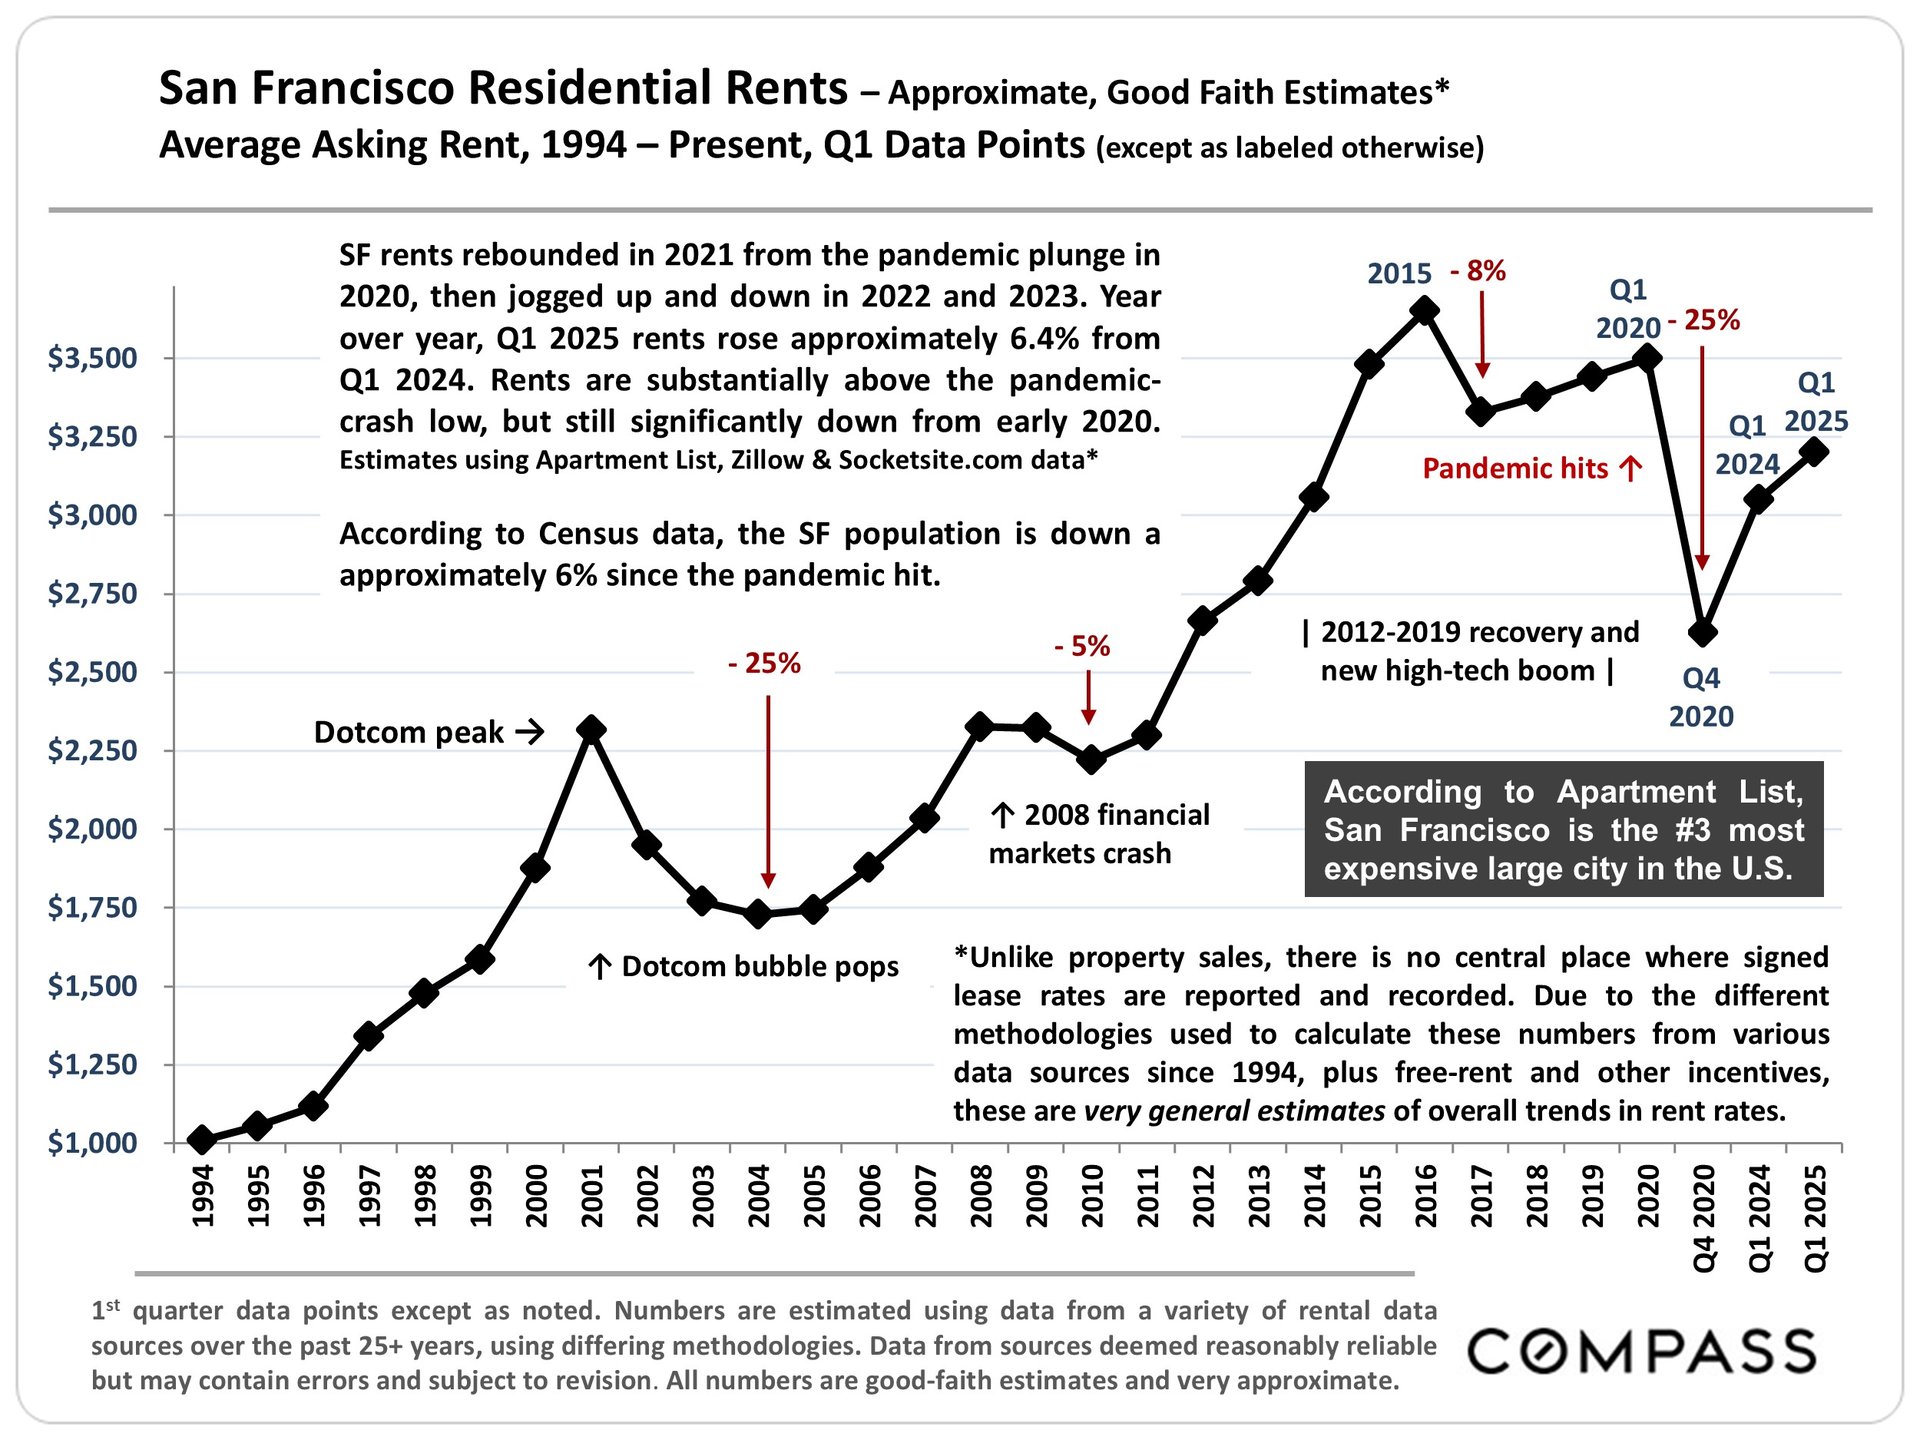
Chart of San Francisco asking rents, 1994–2025, showing the pandemic plunge and subsequent rebound.

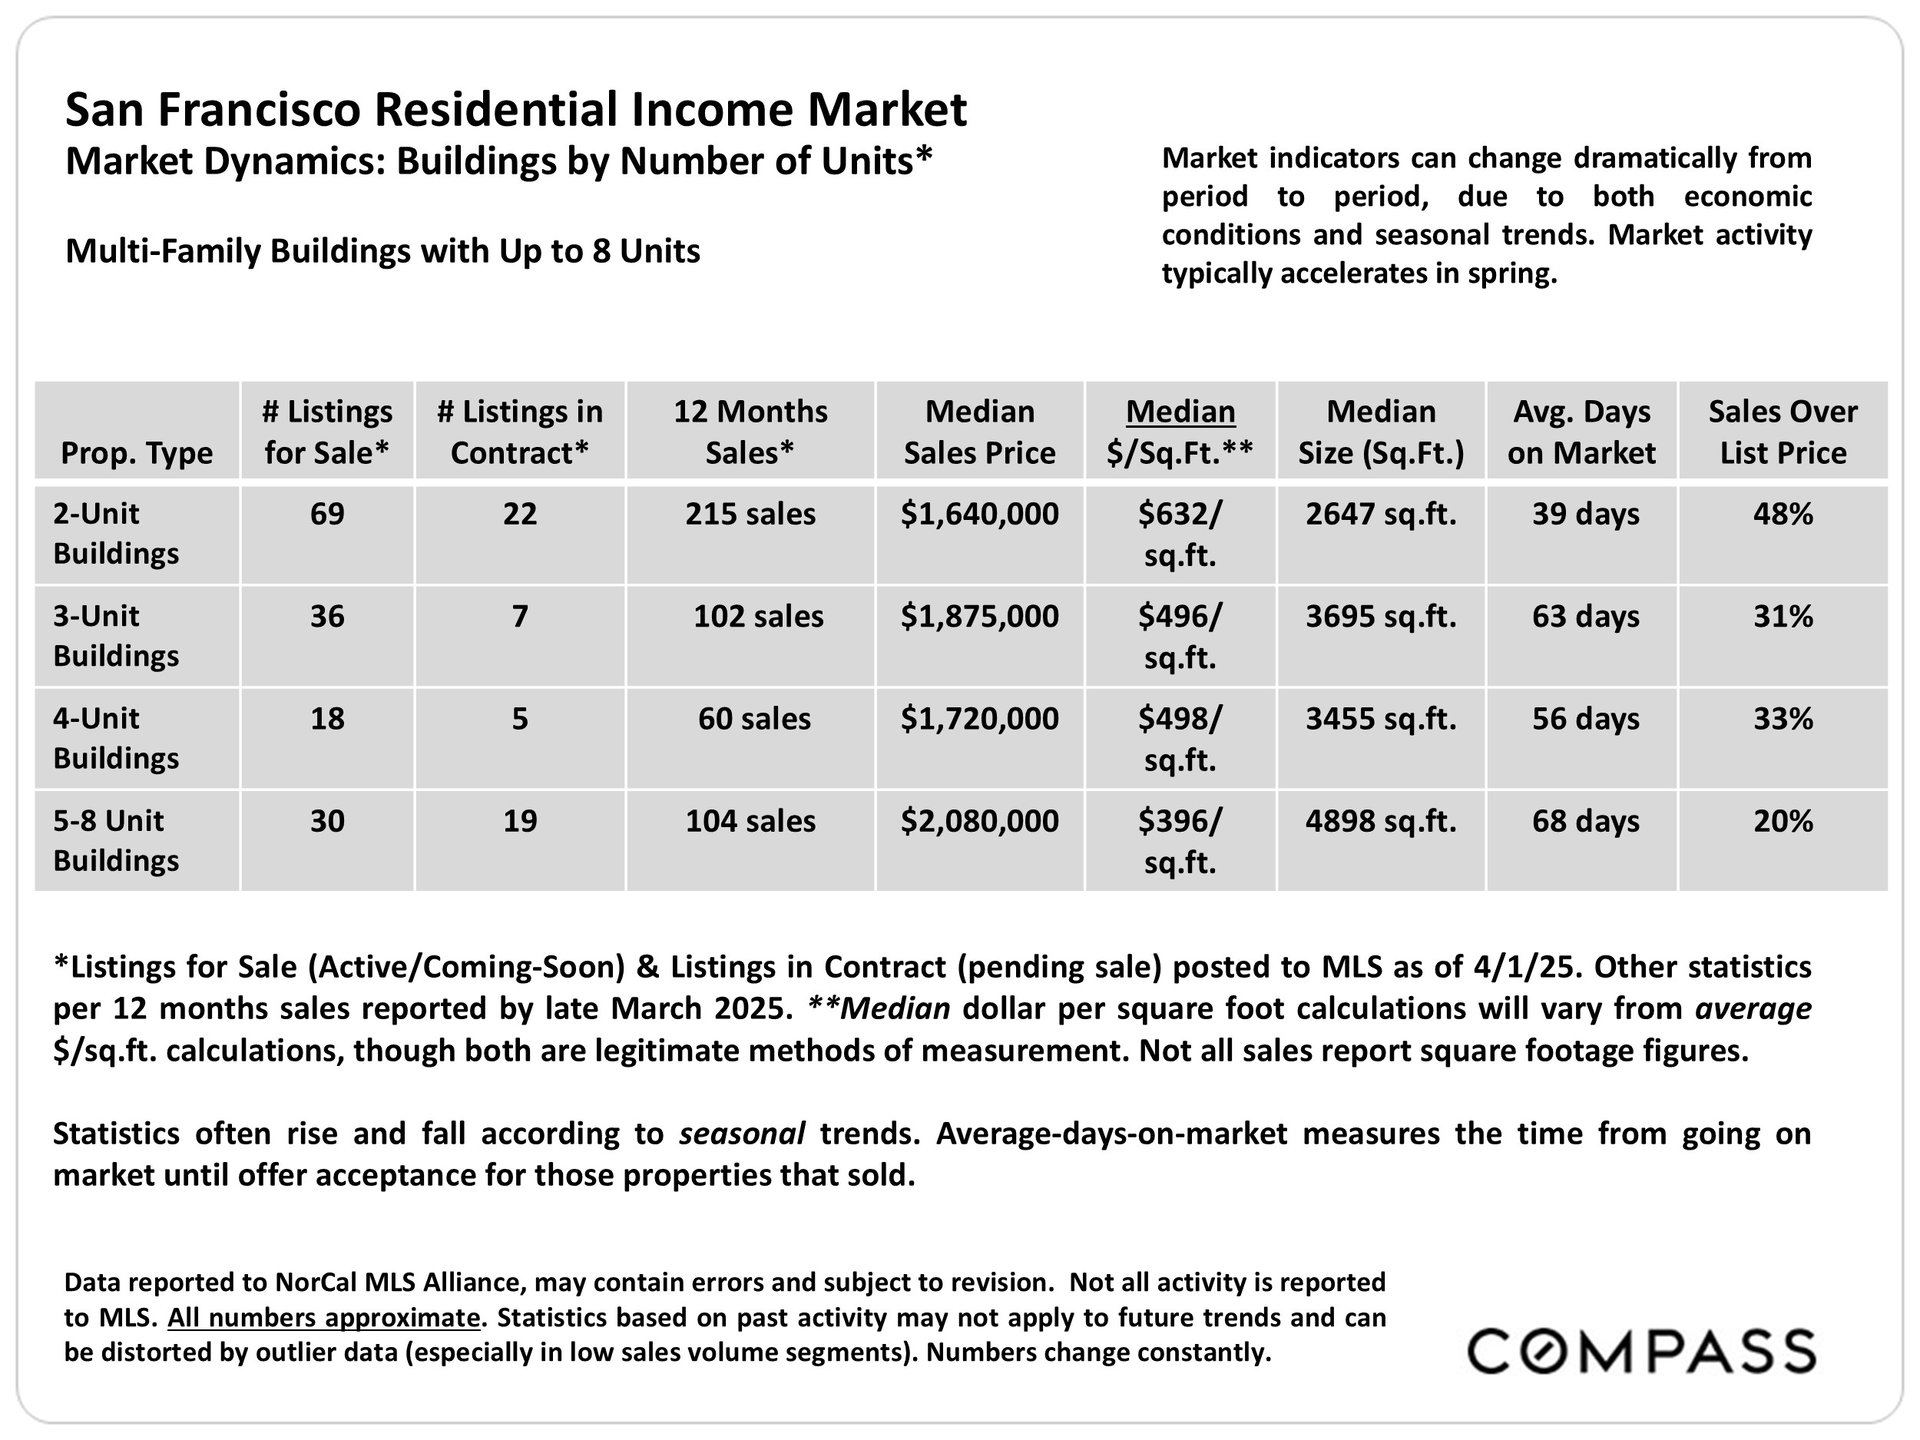
San Francisco multifamily market table comparing sales and listing statistics by building unit count.

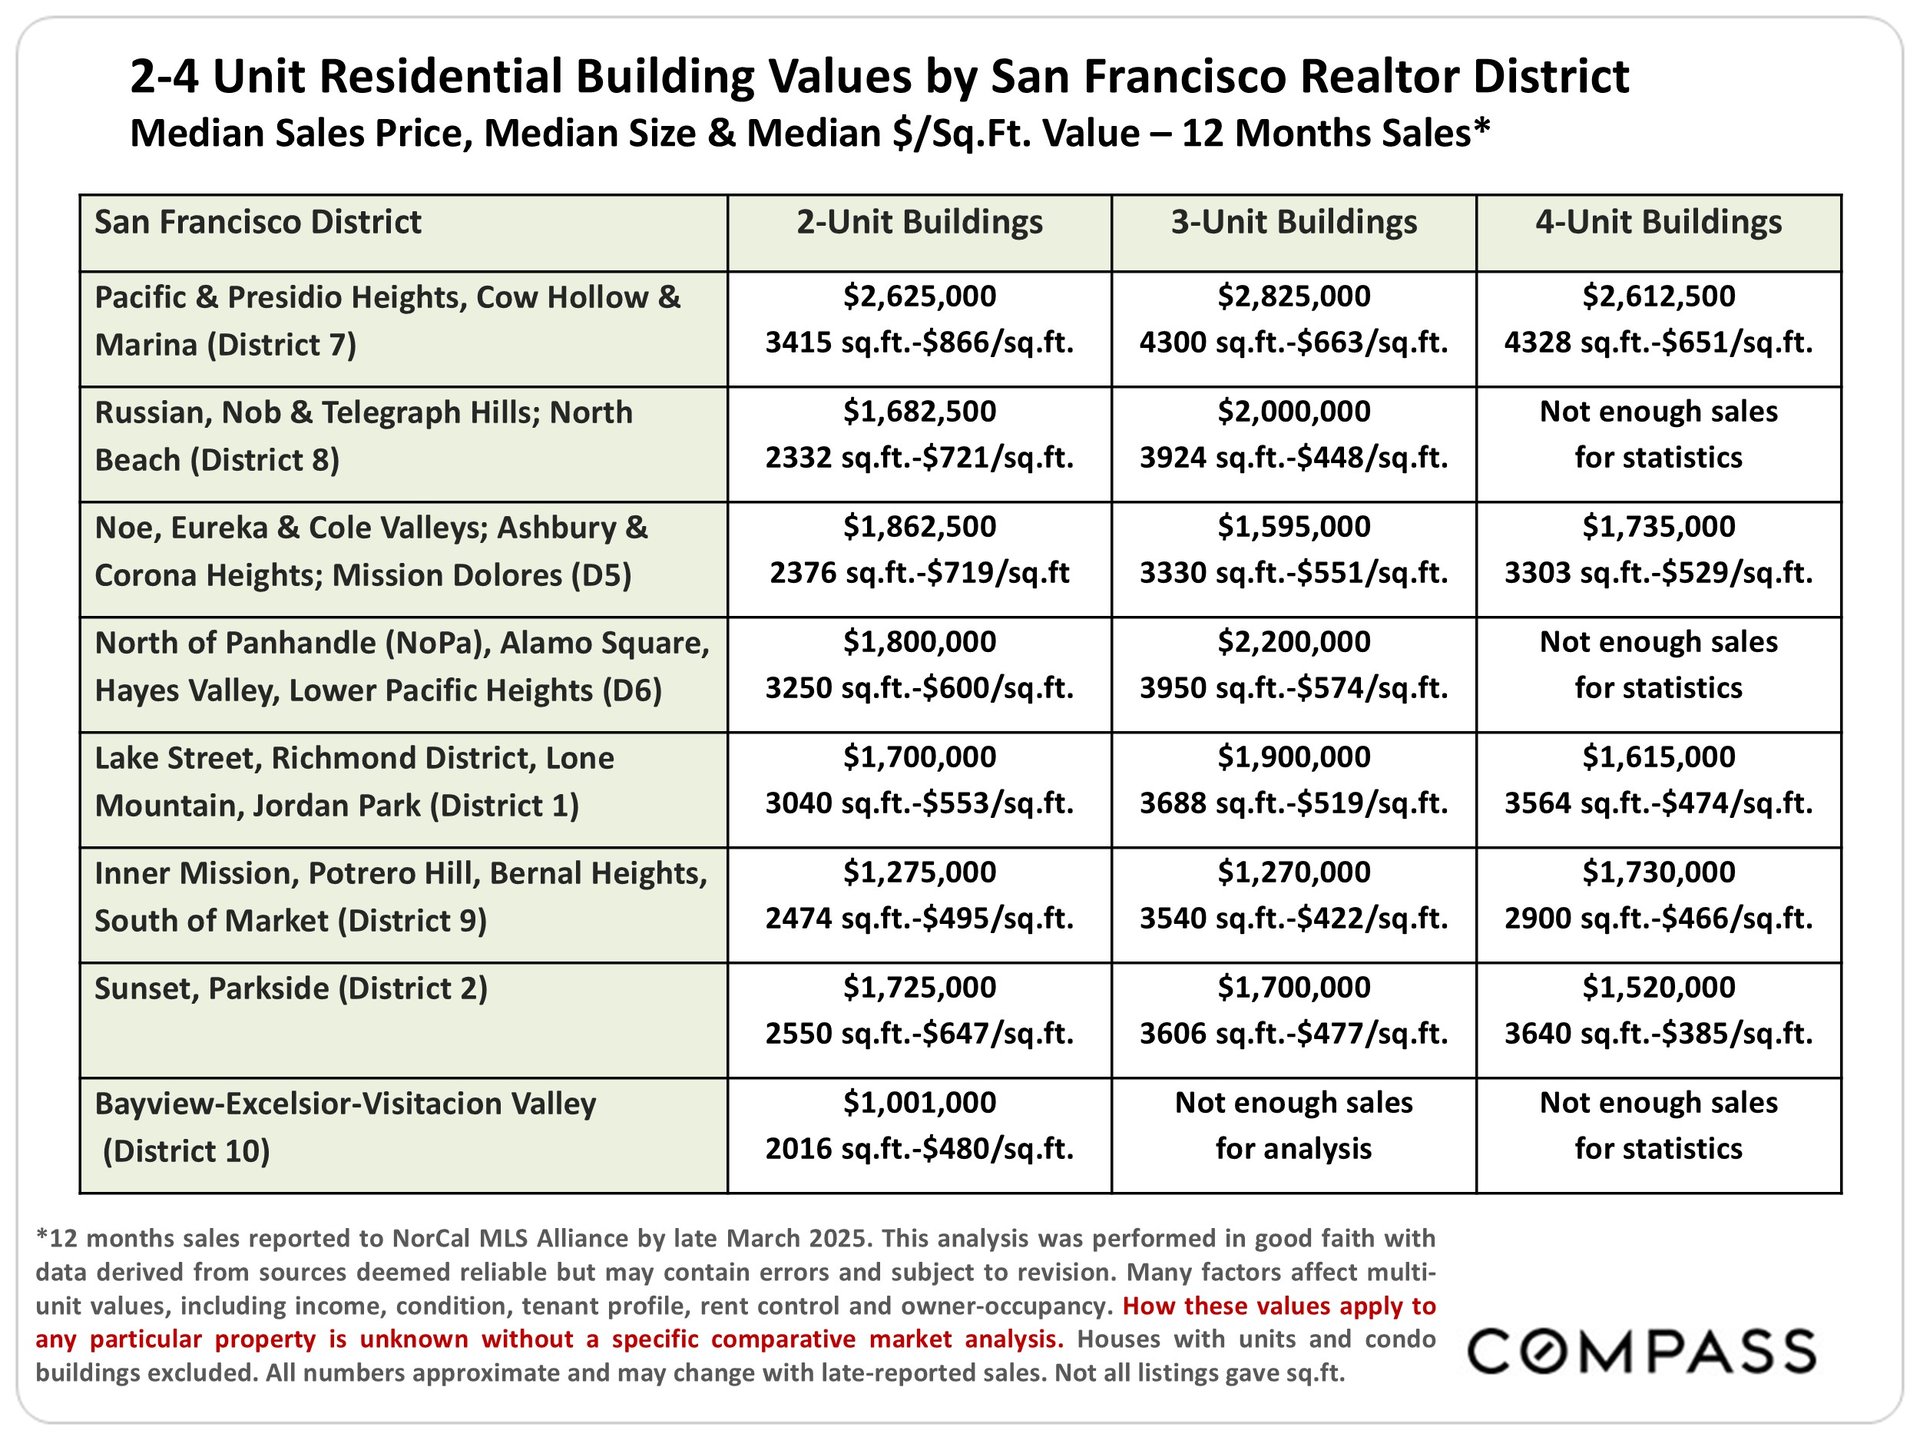
Table comparing San Francisco 2-, 3-, and 4-unit building values across realtor districts.

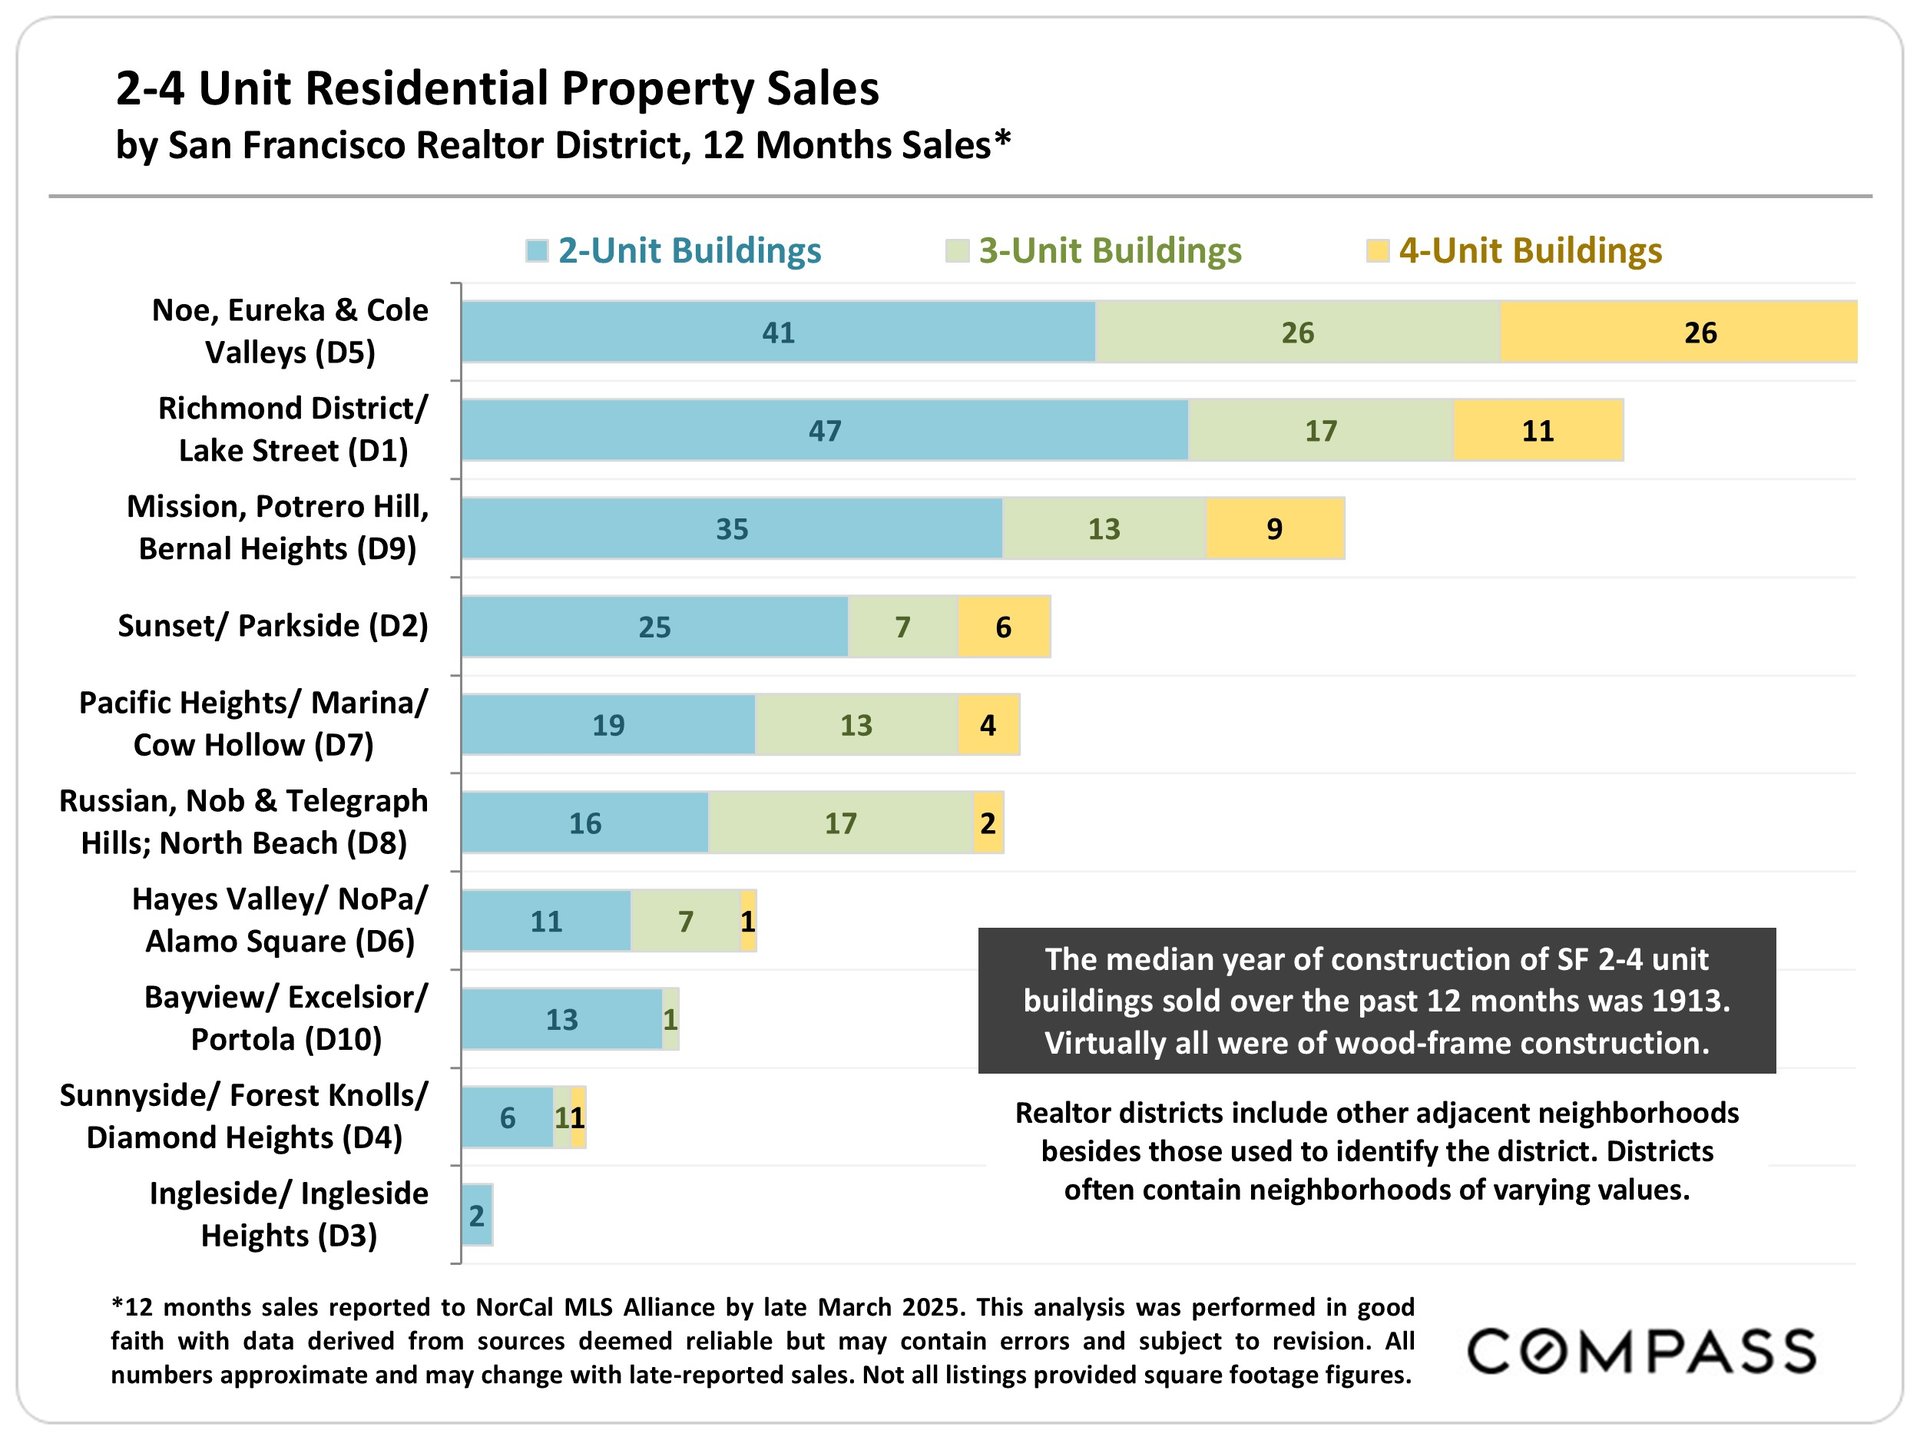
Chart comparing two-, three-, and four-unit building sales across San Francisco Realtor districts.

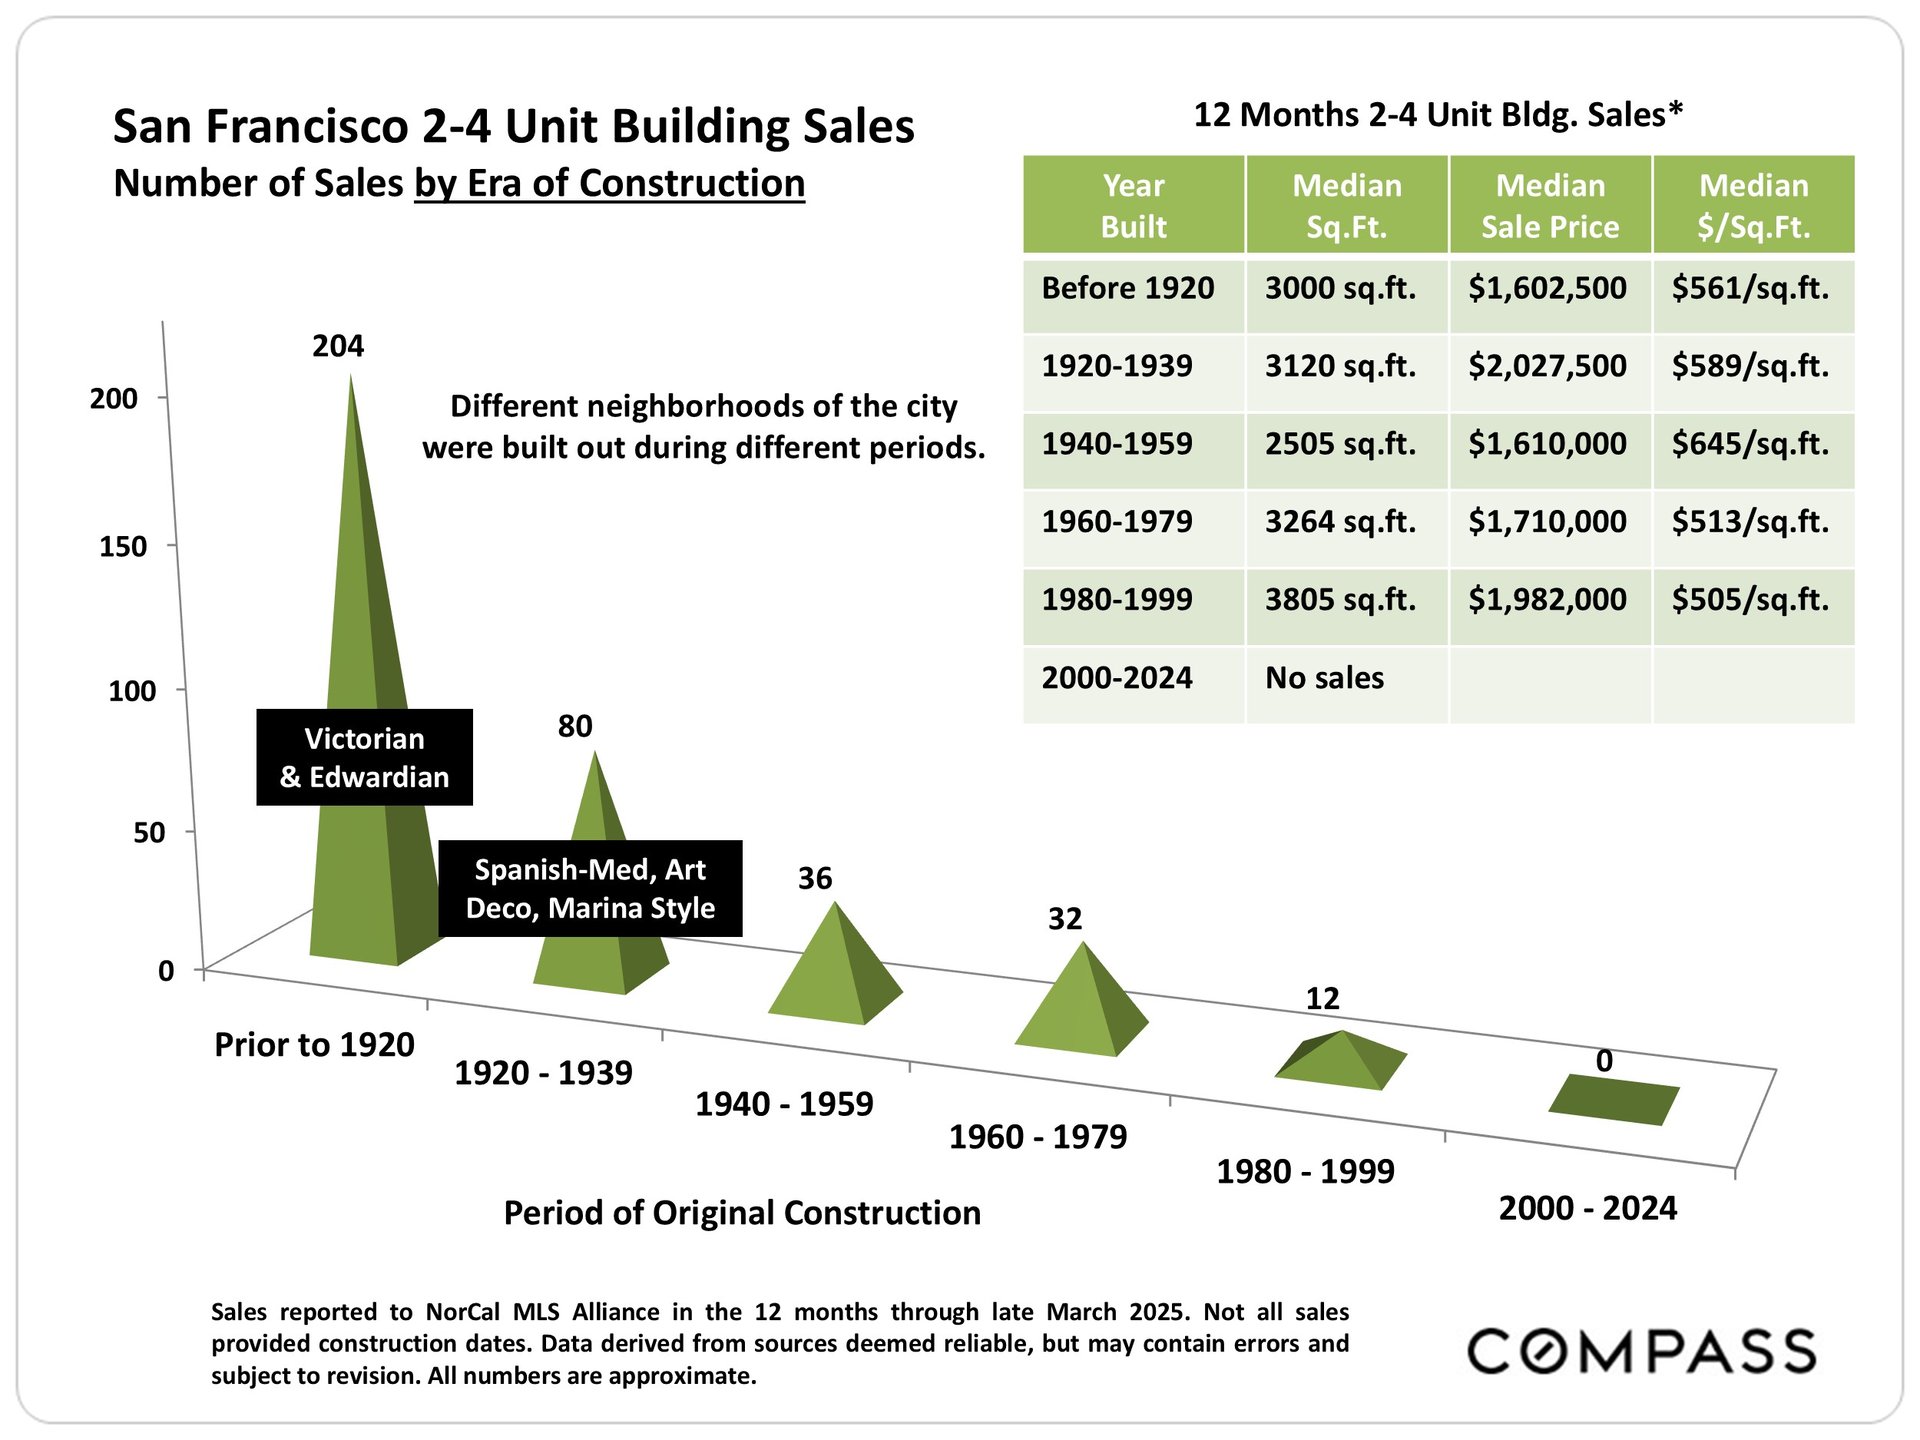
Infographic of San Francisco 2–4 unit building sales by construction era, with a chart and median sale data table.

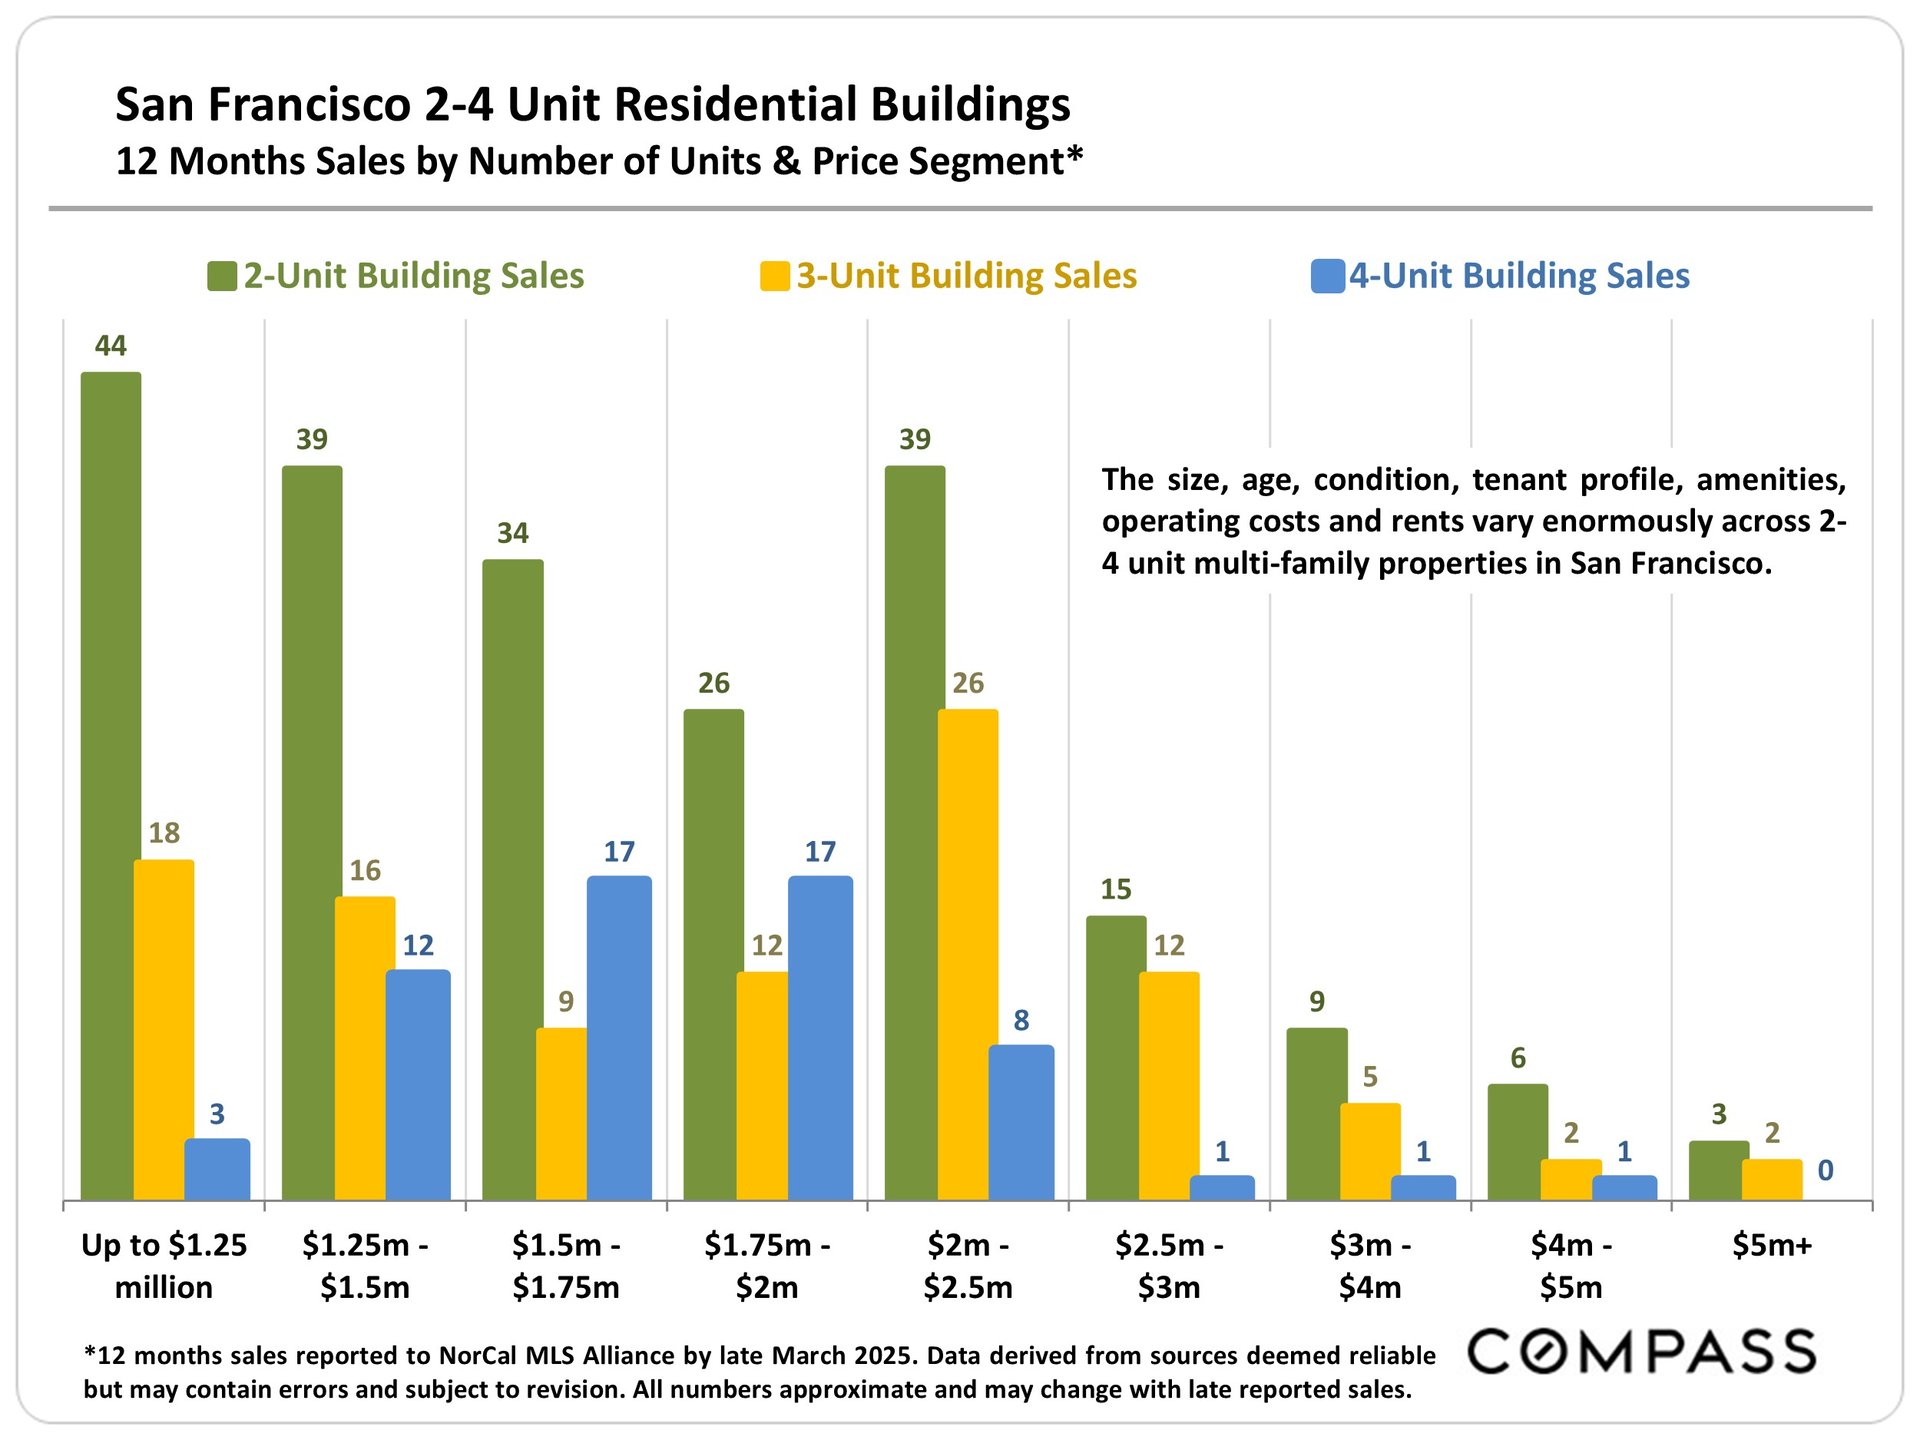
Bar chart of 12-month San Francisco 2–4 unit building sales by unit count and price segment.

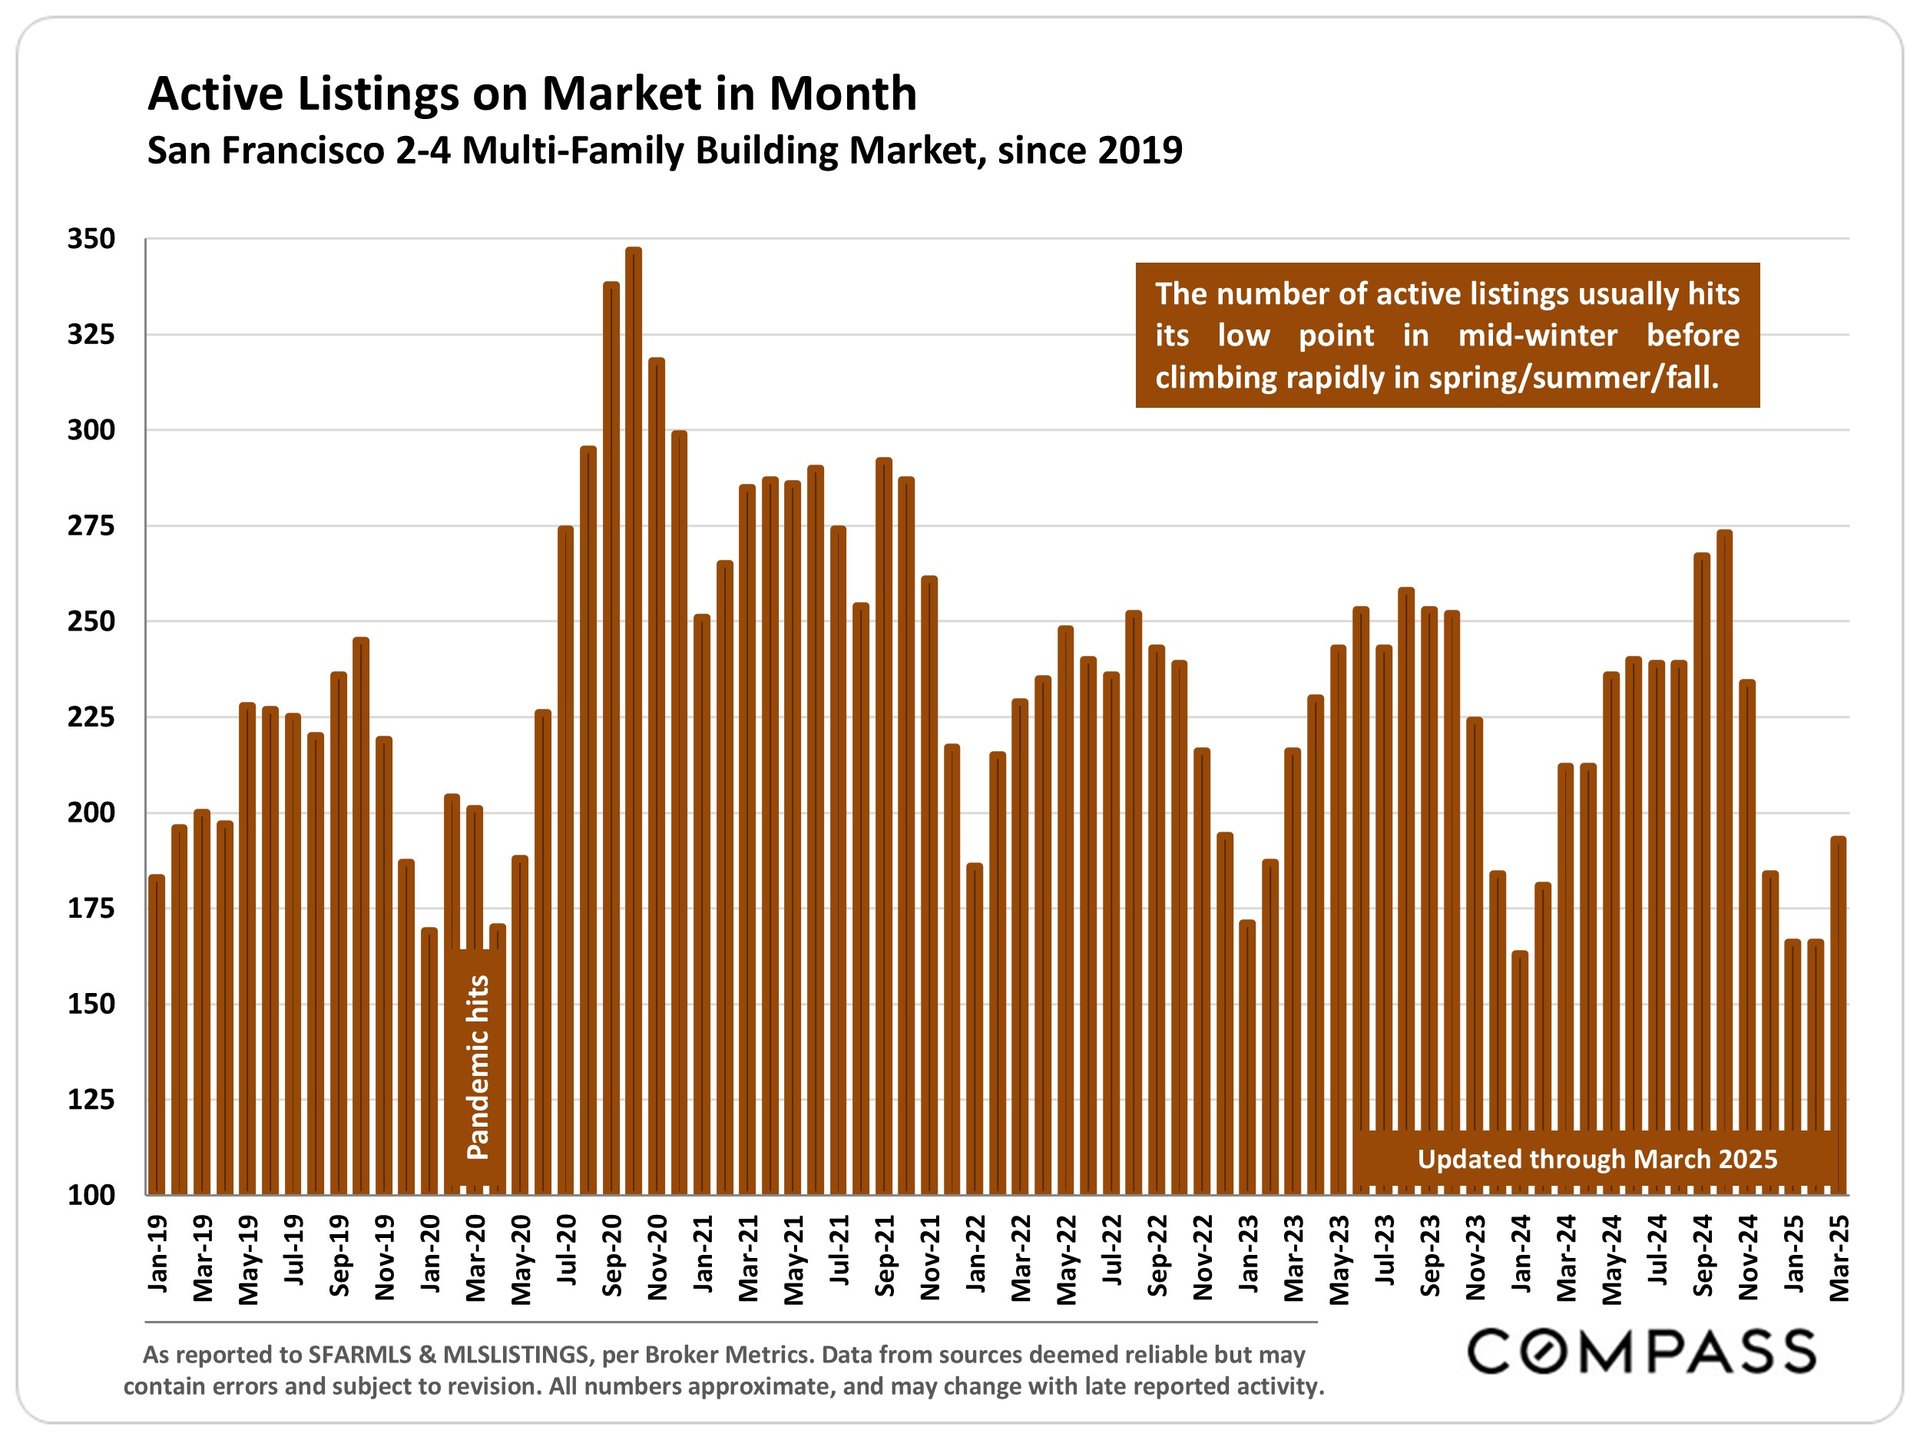
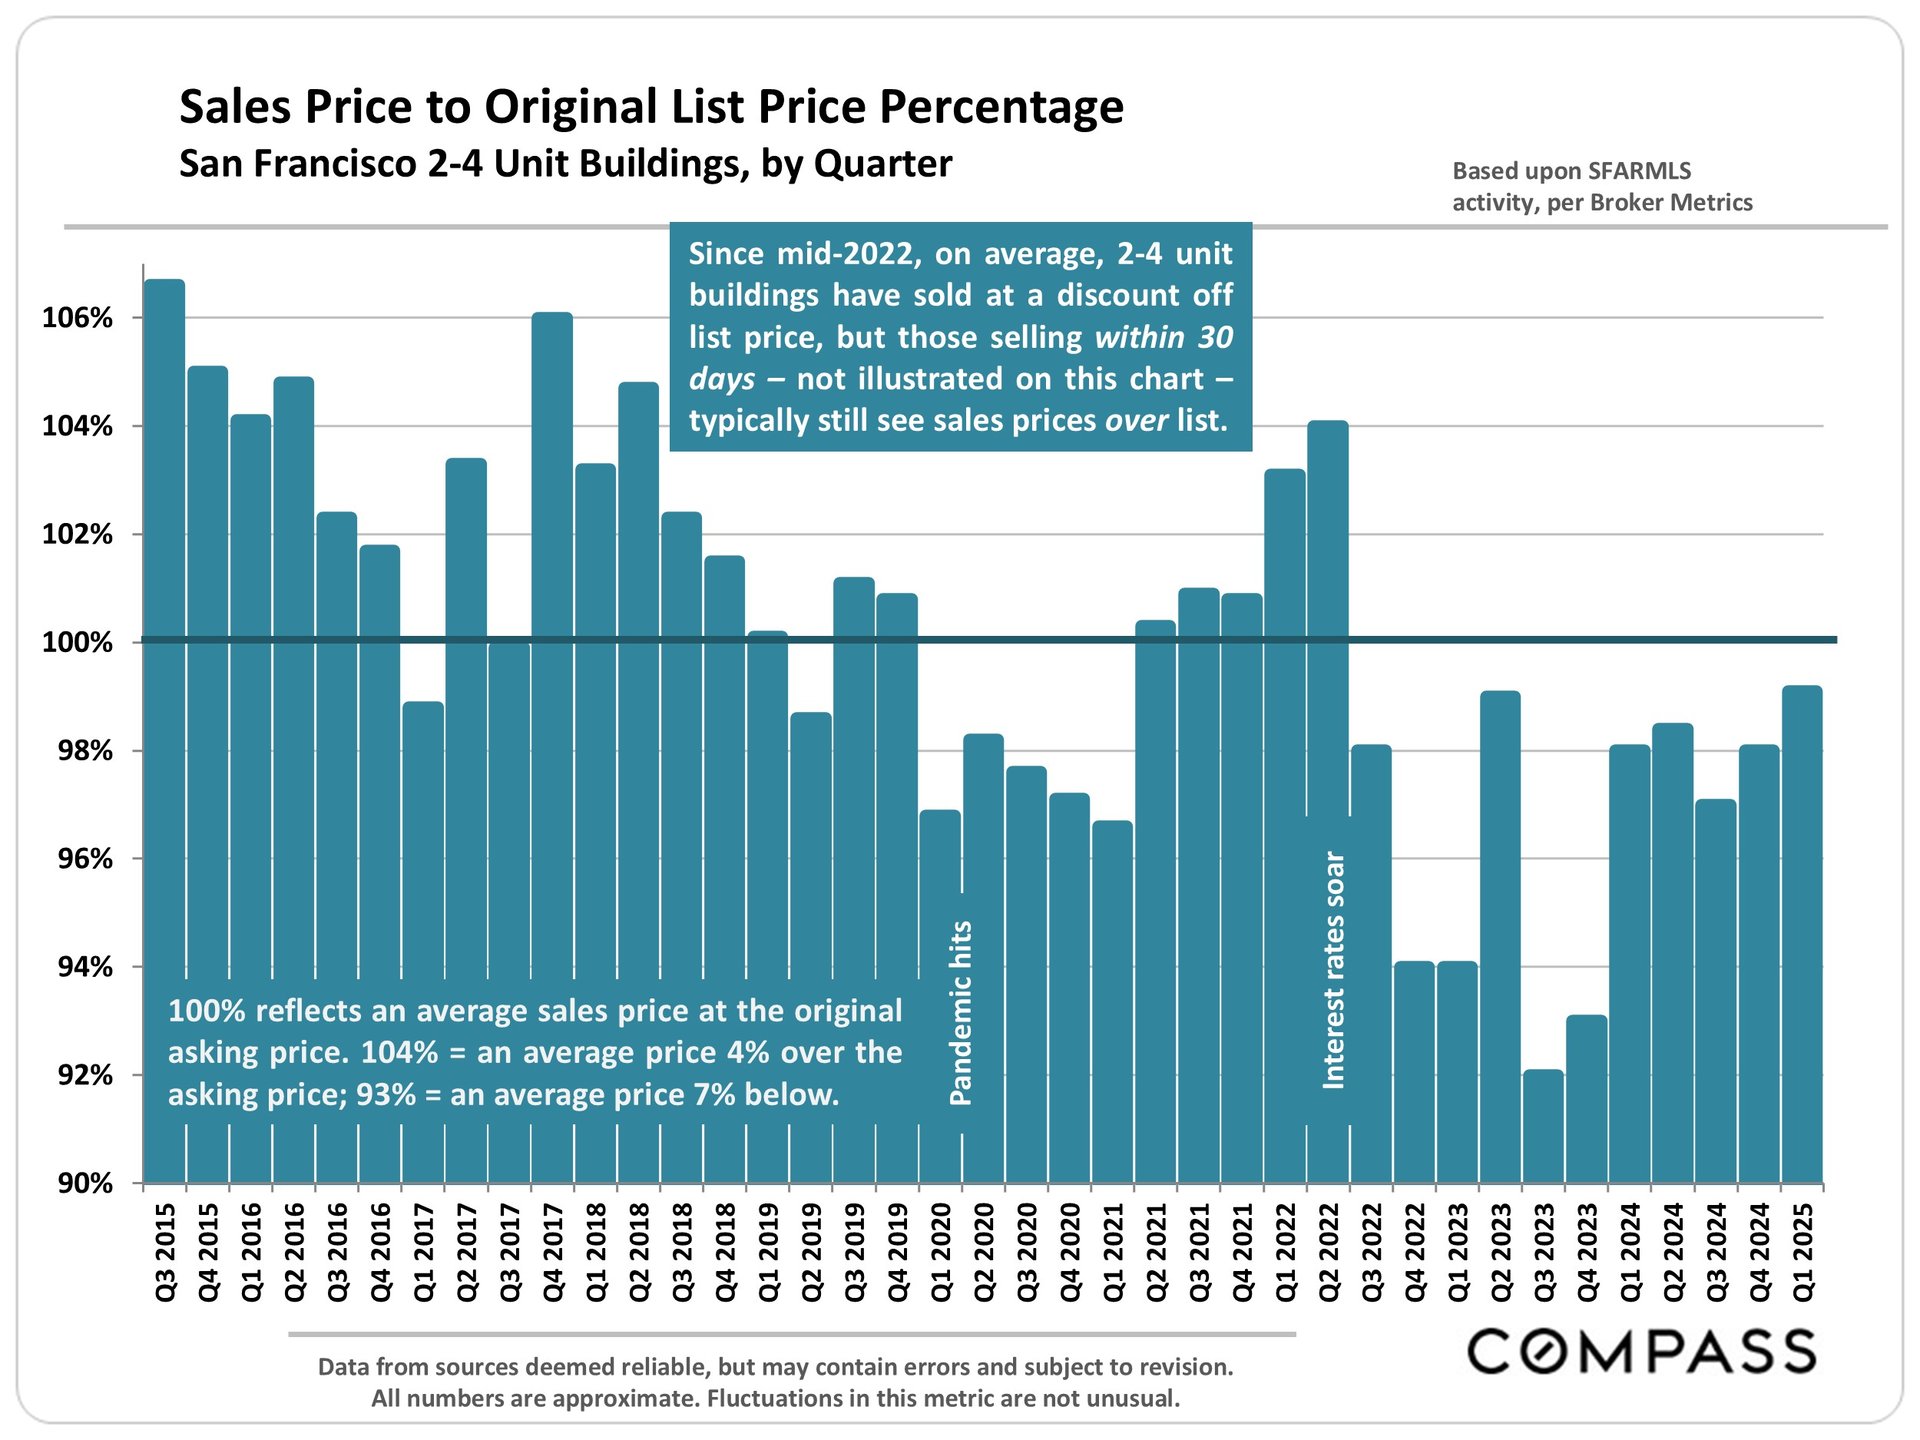
Bar chart of monthly active San Francisco 2–4-unit building listings from 2019 to March 2025, showing seasonal fluctuations.Chart of San Francisco 2–4 unit building sale prices versus original list prices by quarter, Q3 2015–Q1 2025.

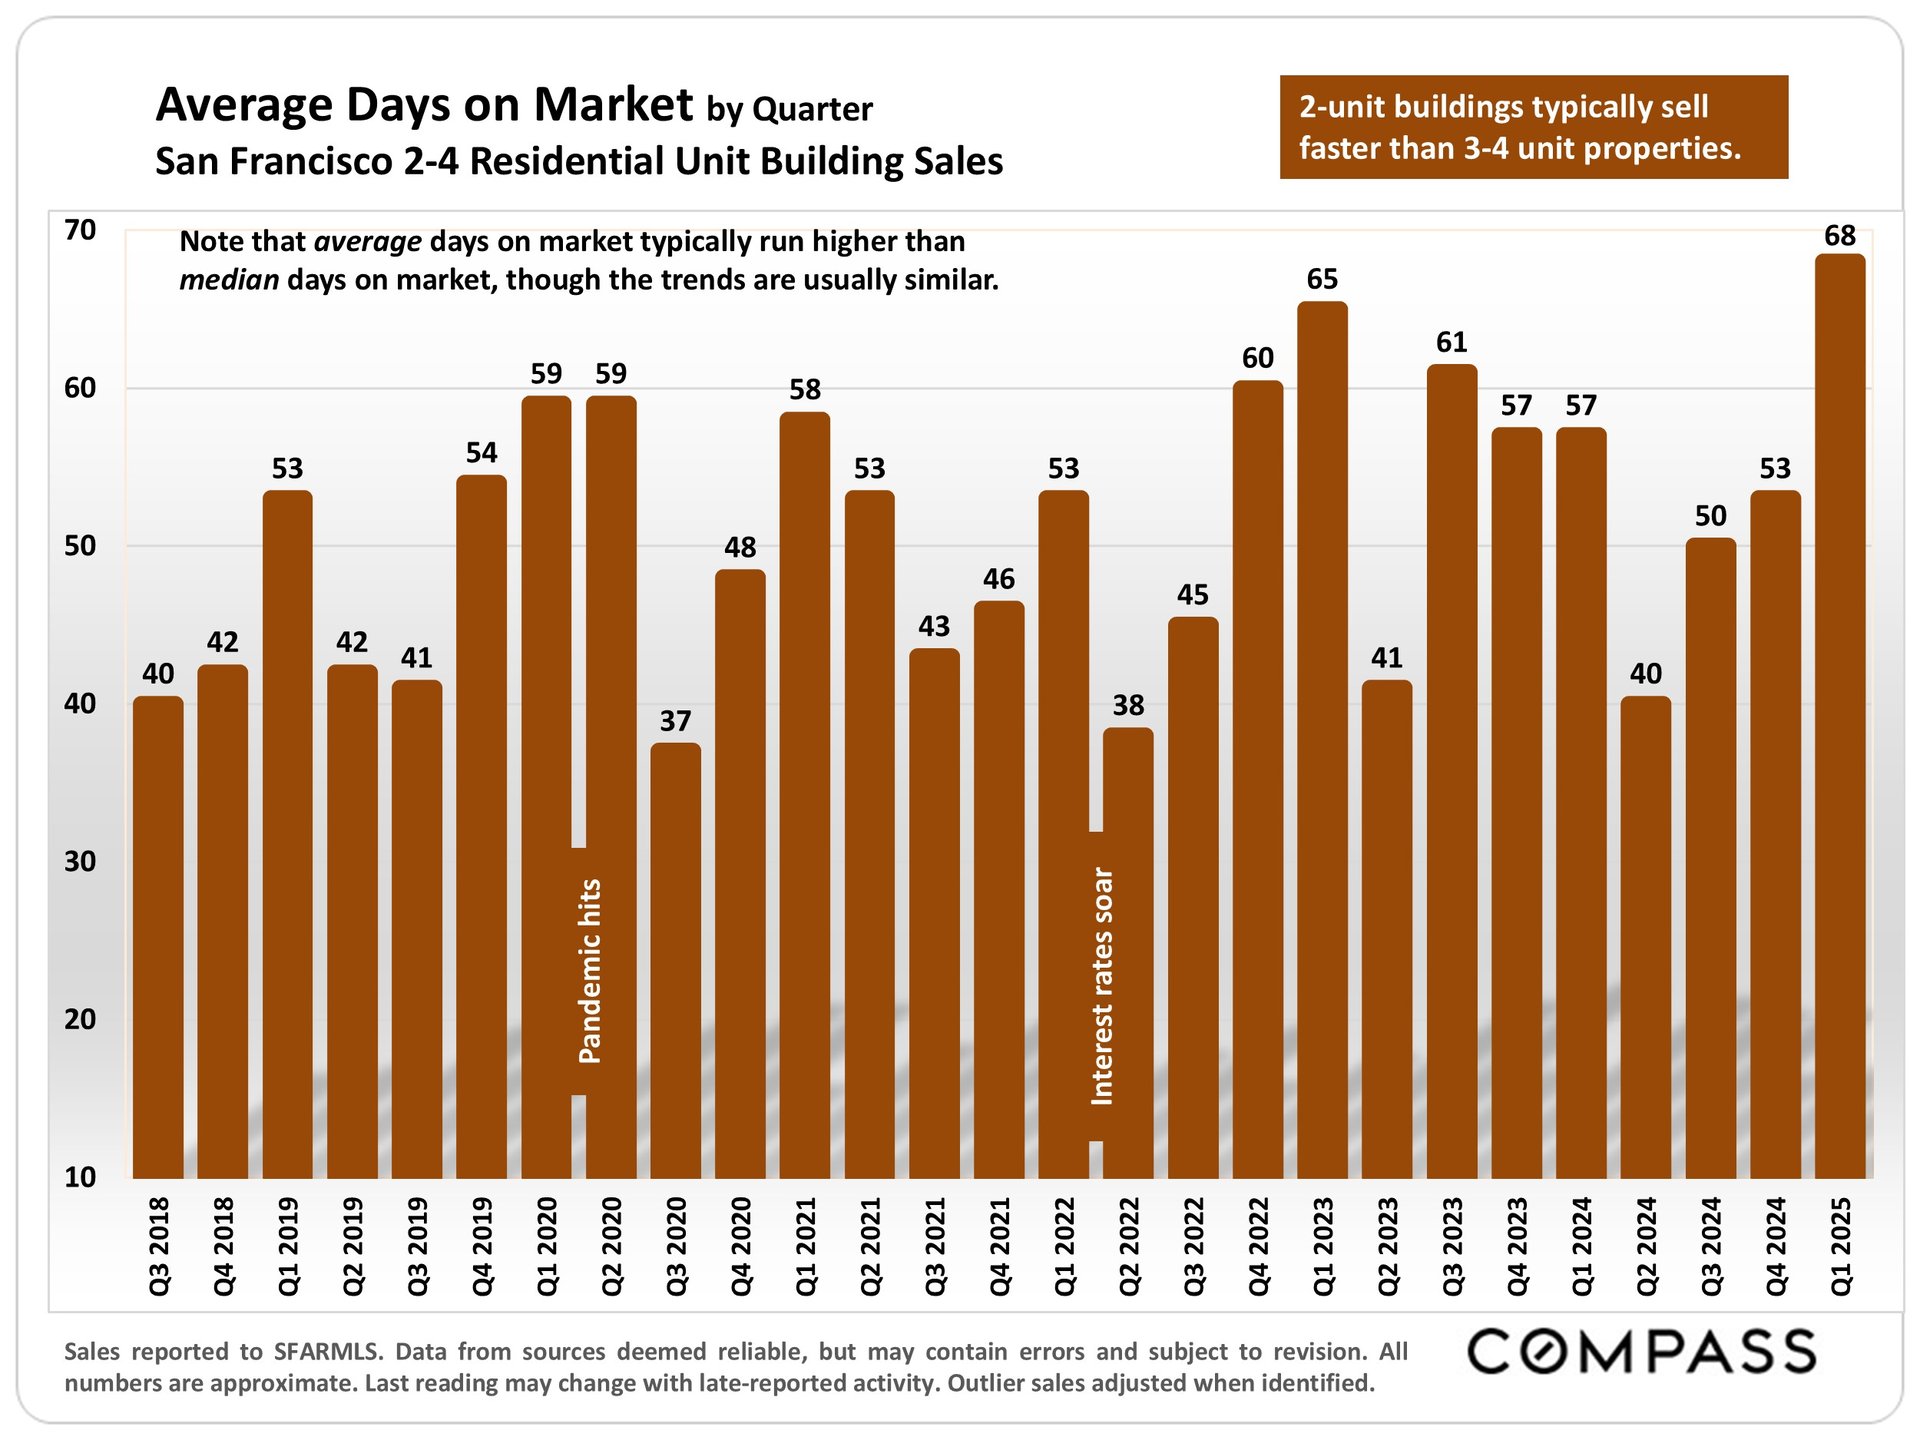
Chart of average market days for San Francisco 2–4 unit buildings by quarter, Q3 2018–Q1 2025.

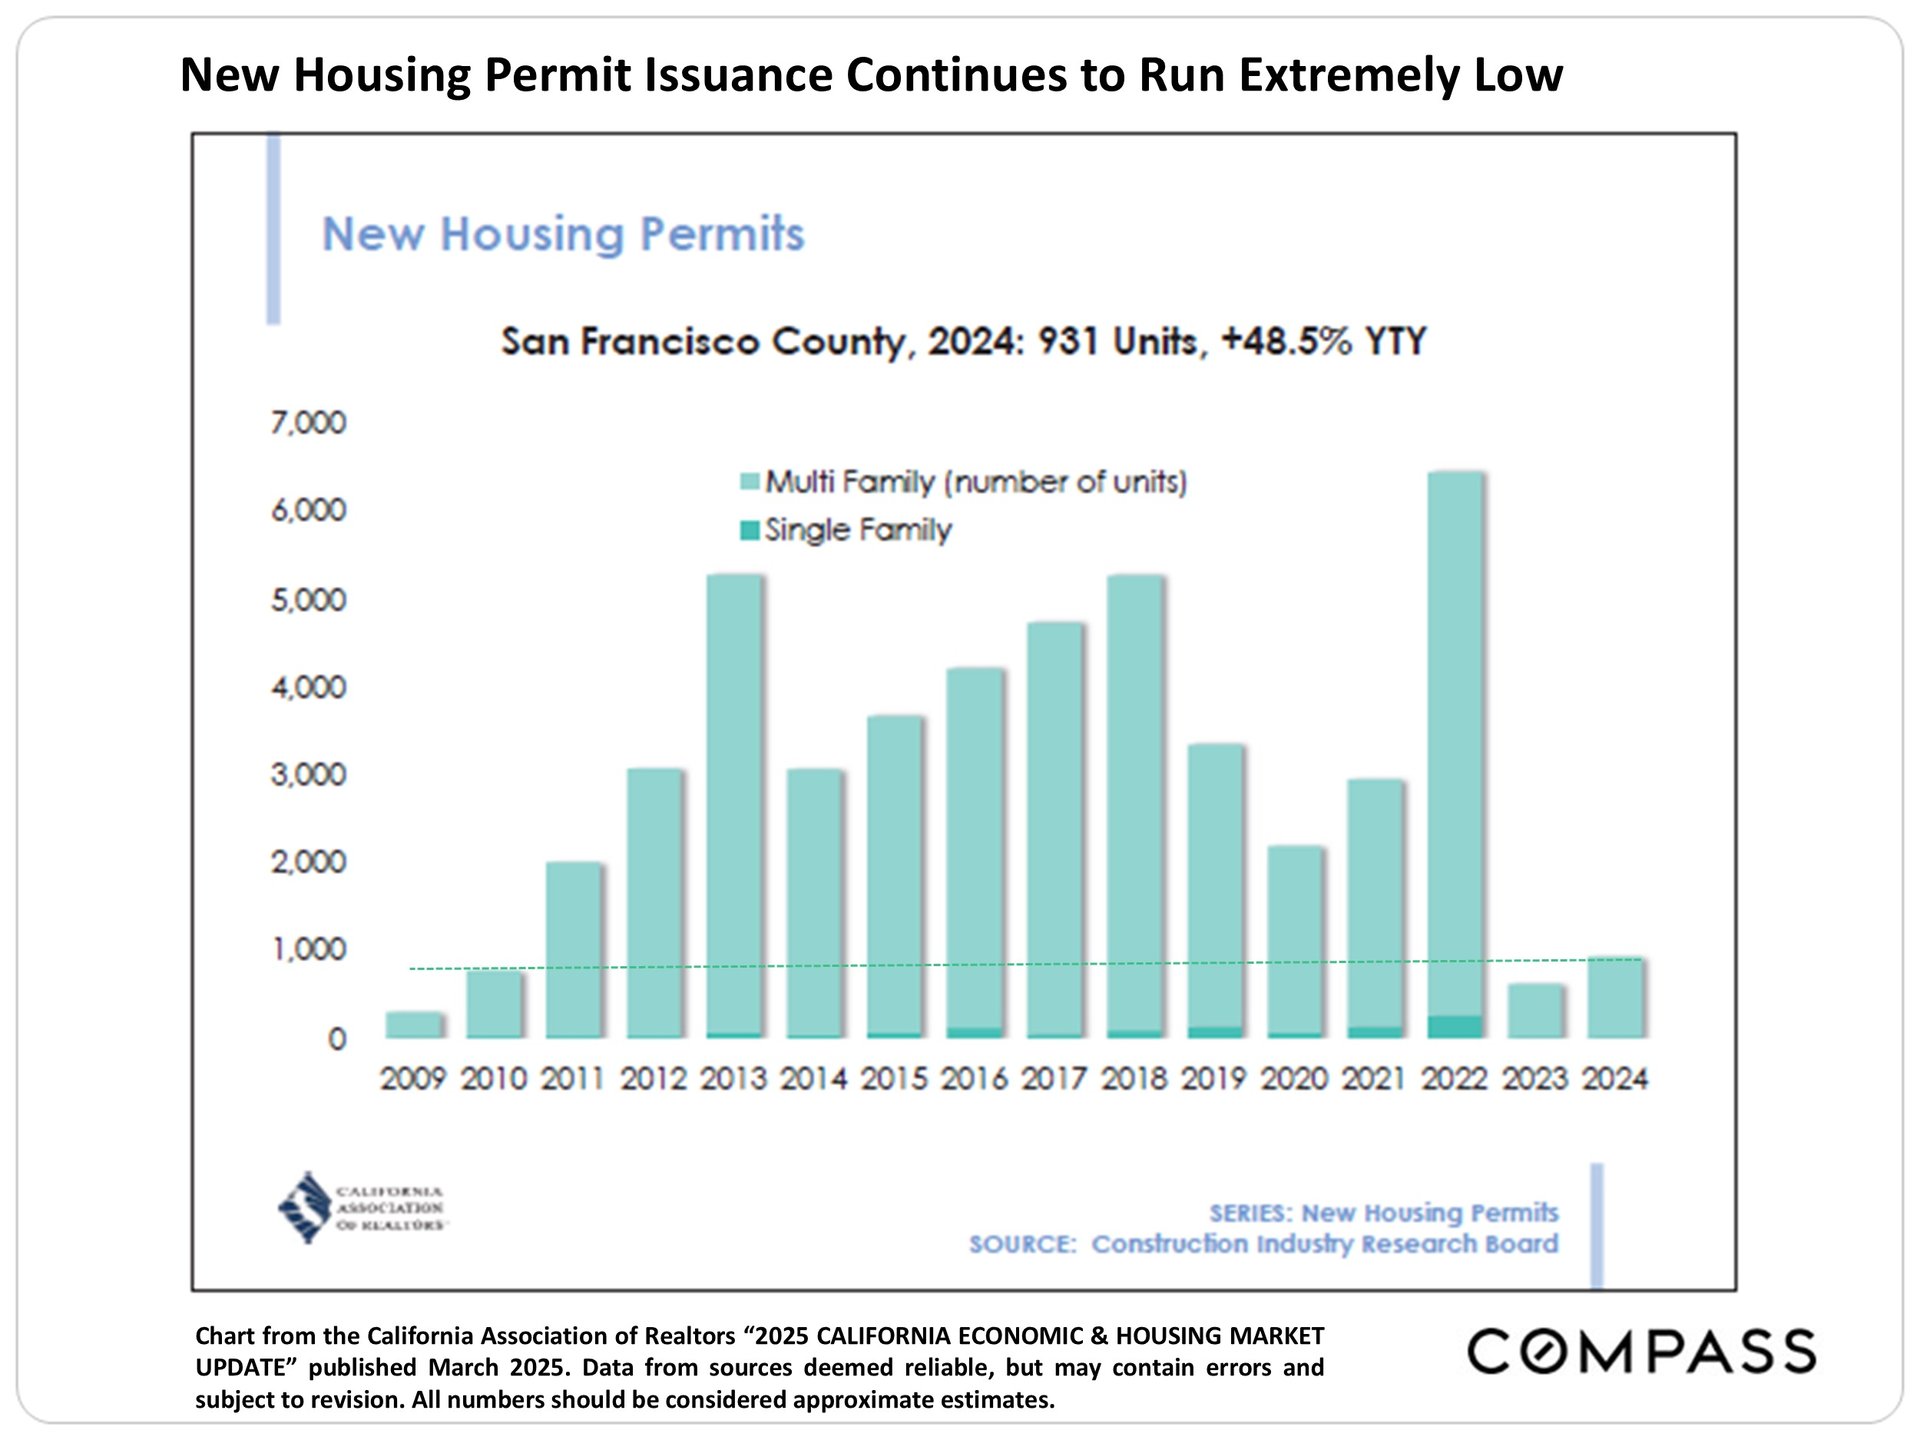
Chart of San Francisco County housing permits from 2009–2024, noting 931 units in 2024, up 48.5% year over year.

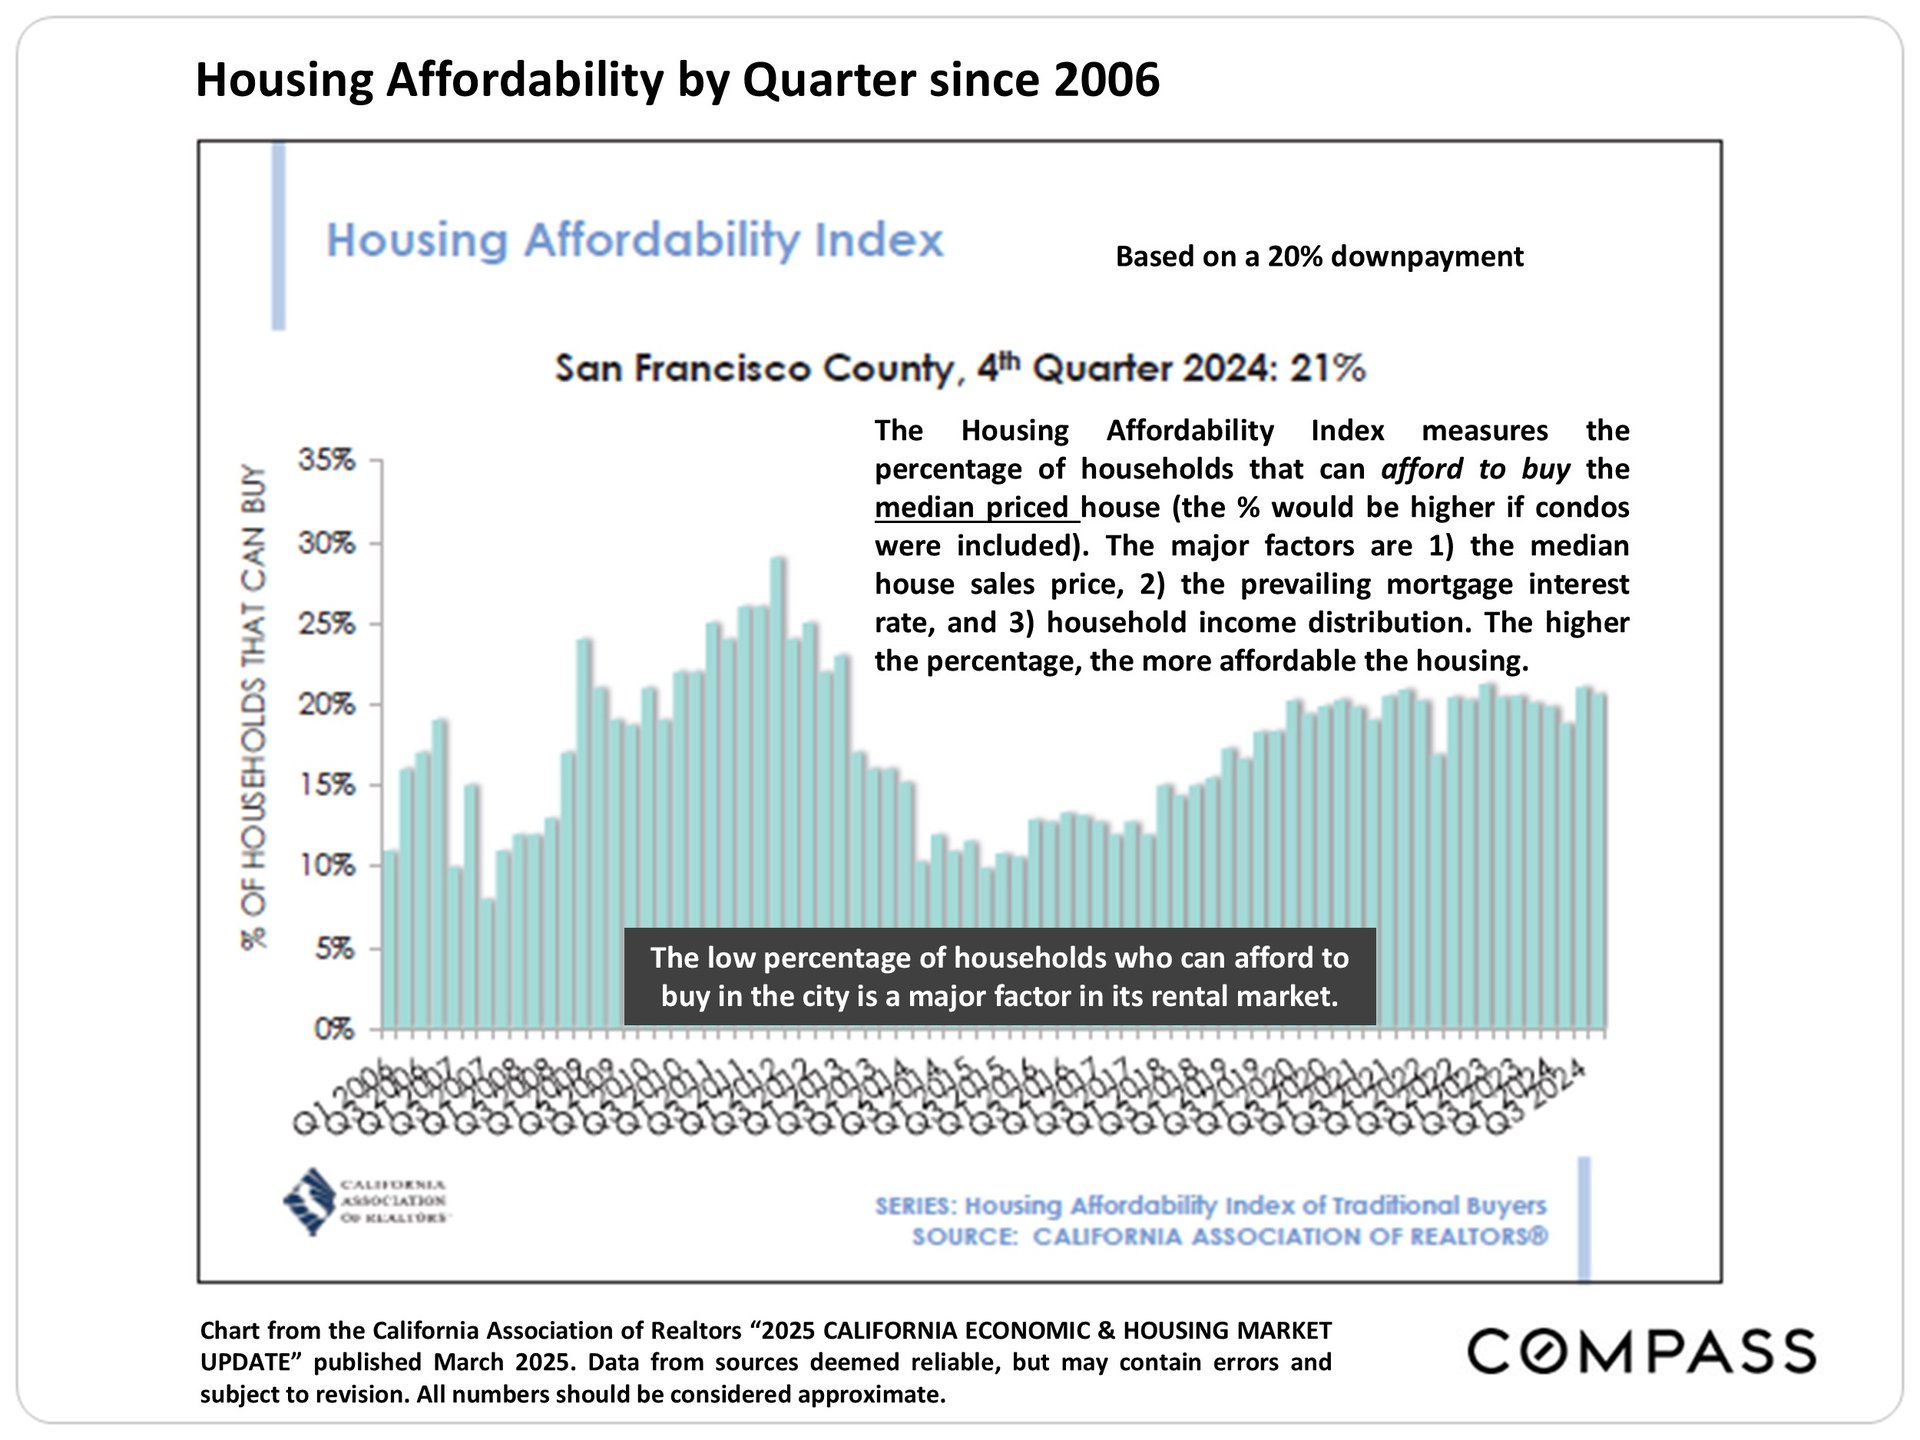
San Francisco housing affordability chart shows 21% of households could afford a home in fourth quarter 2024.

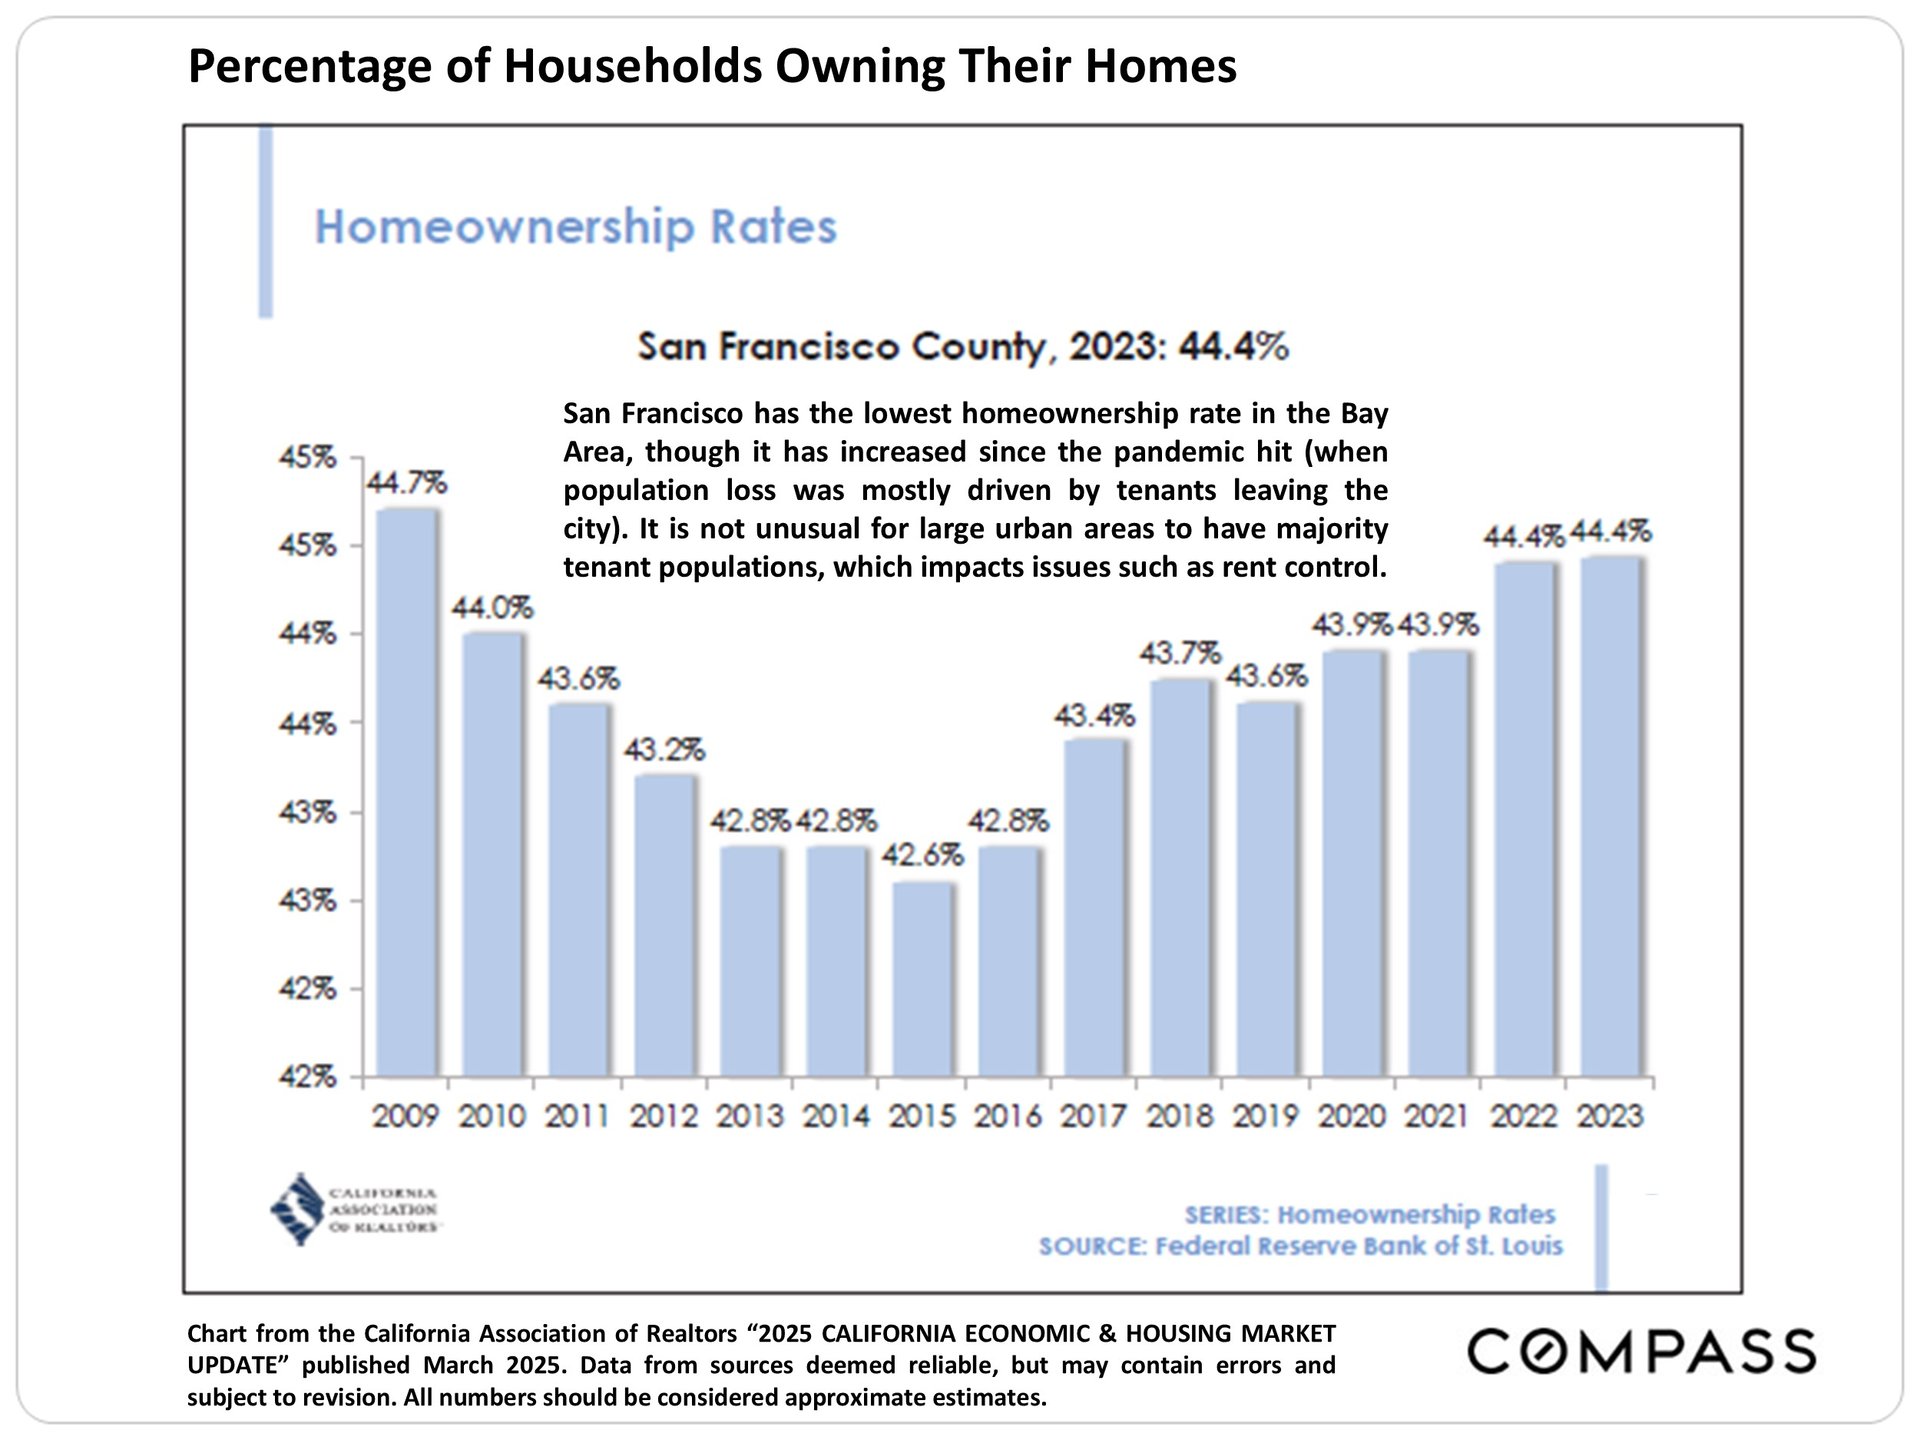
San Francisco County homeownership-rate chart, showing 44.4% in 2023 after a low of 42.6% in 2015.

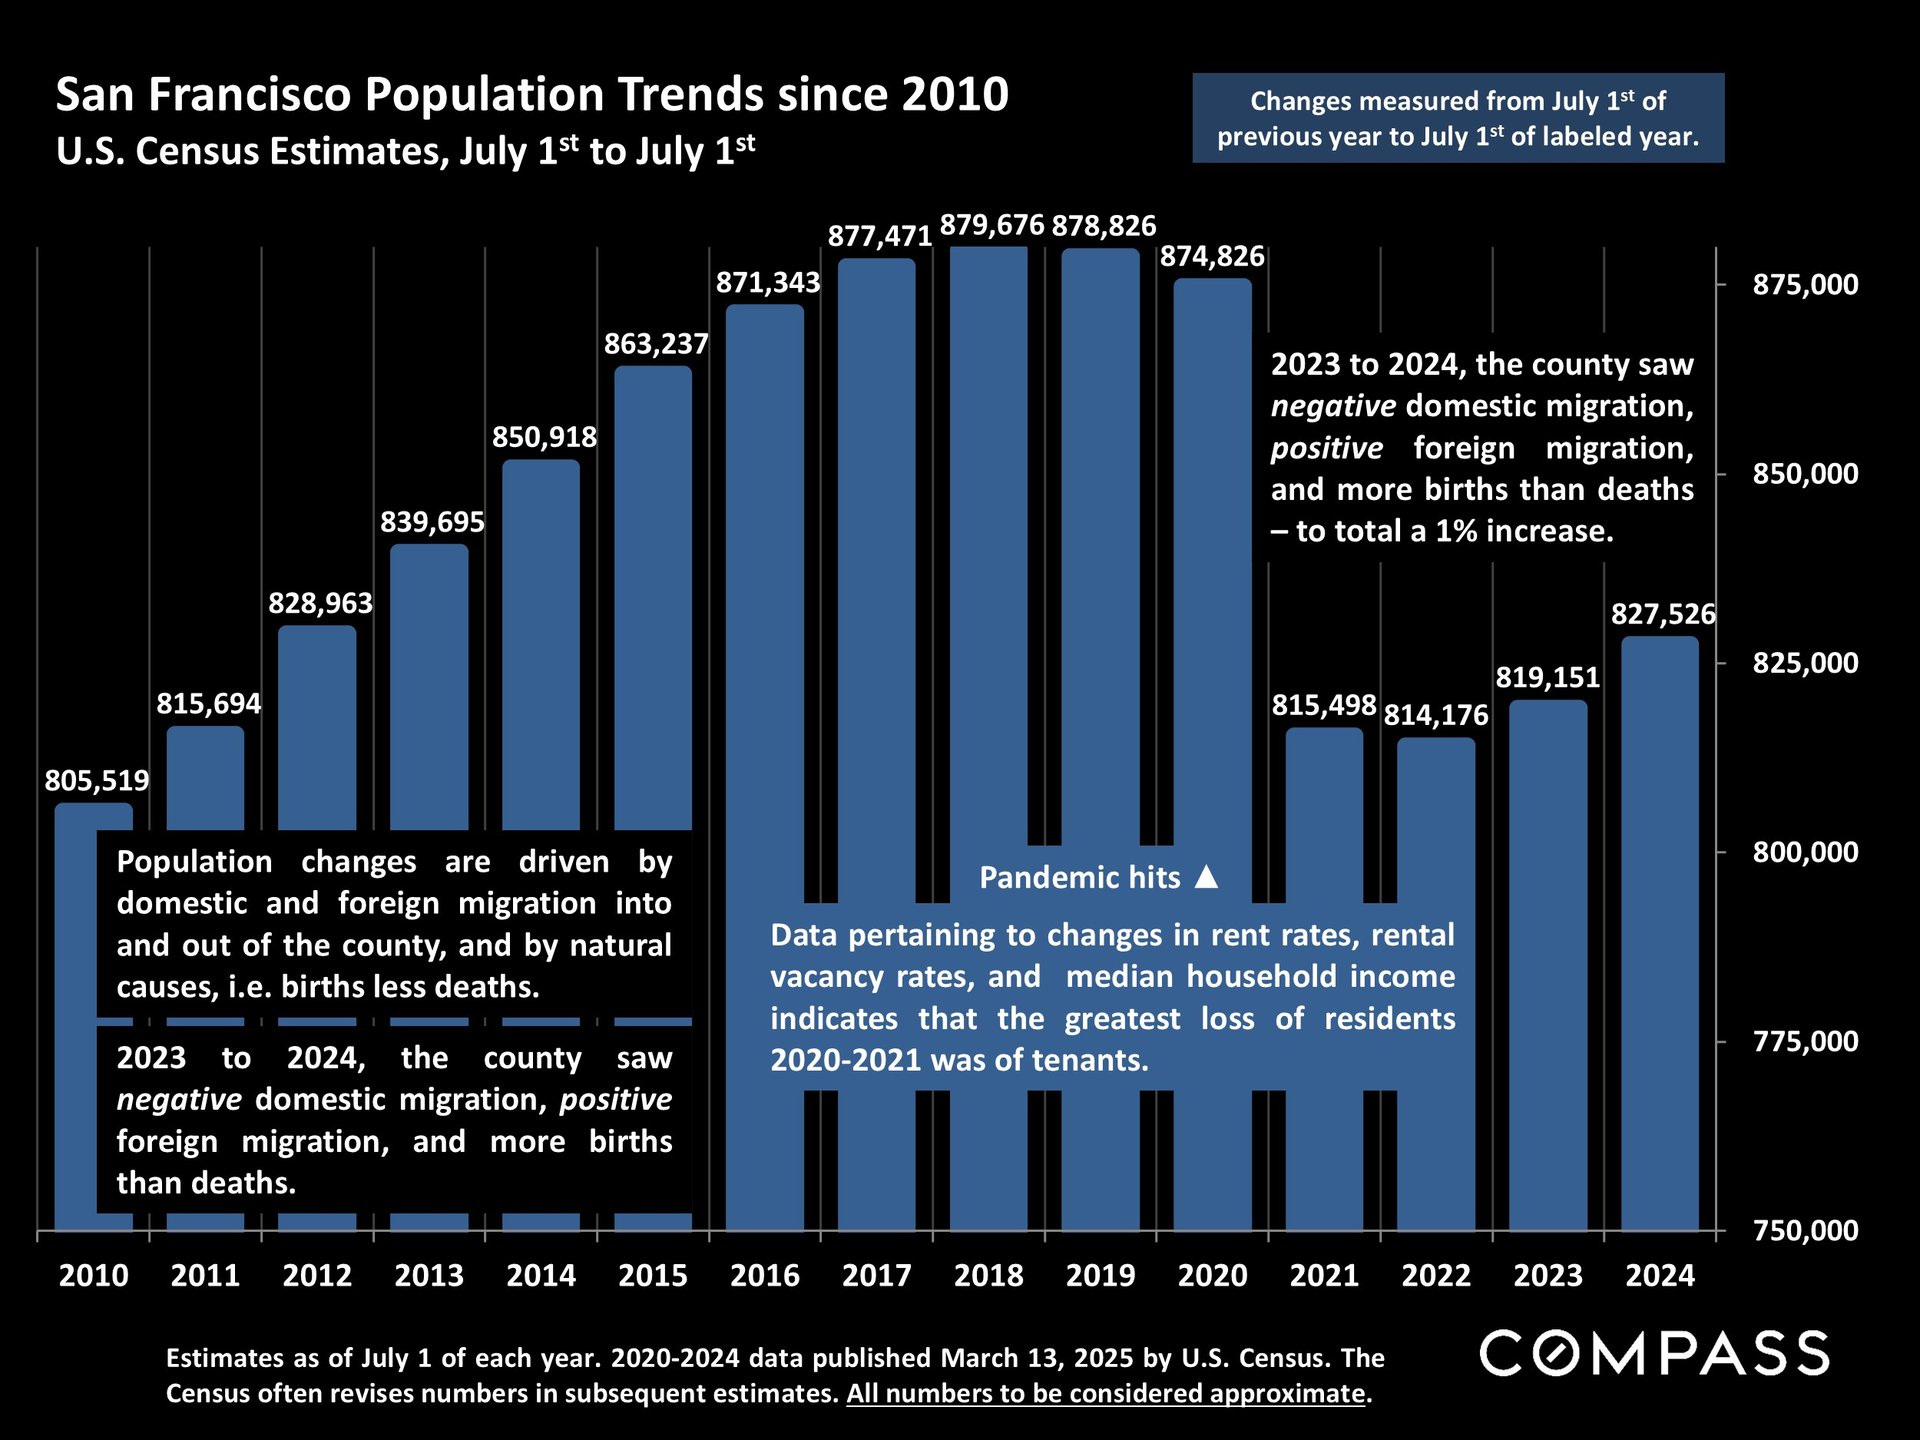
Chart of San Francisco population estimates from 2010 to 2024, peaking in 2018 before declining and partially recovering.

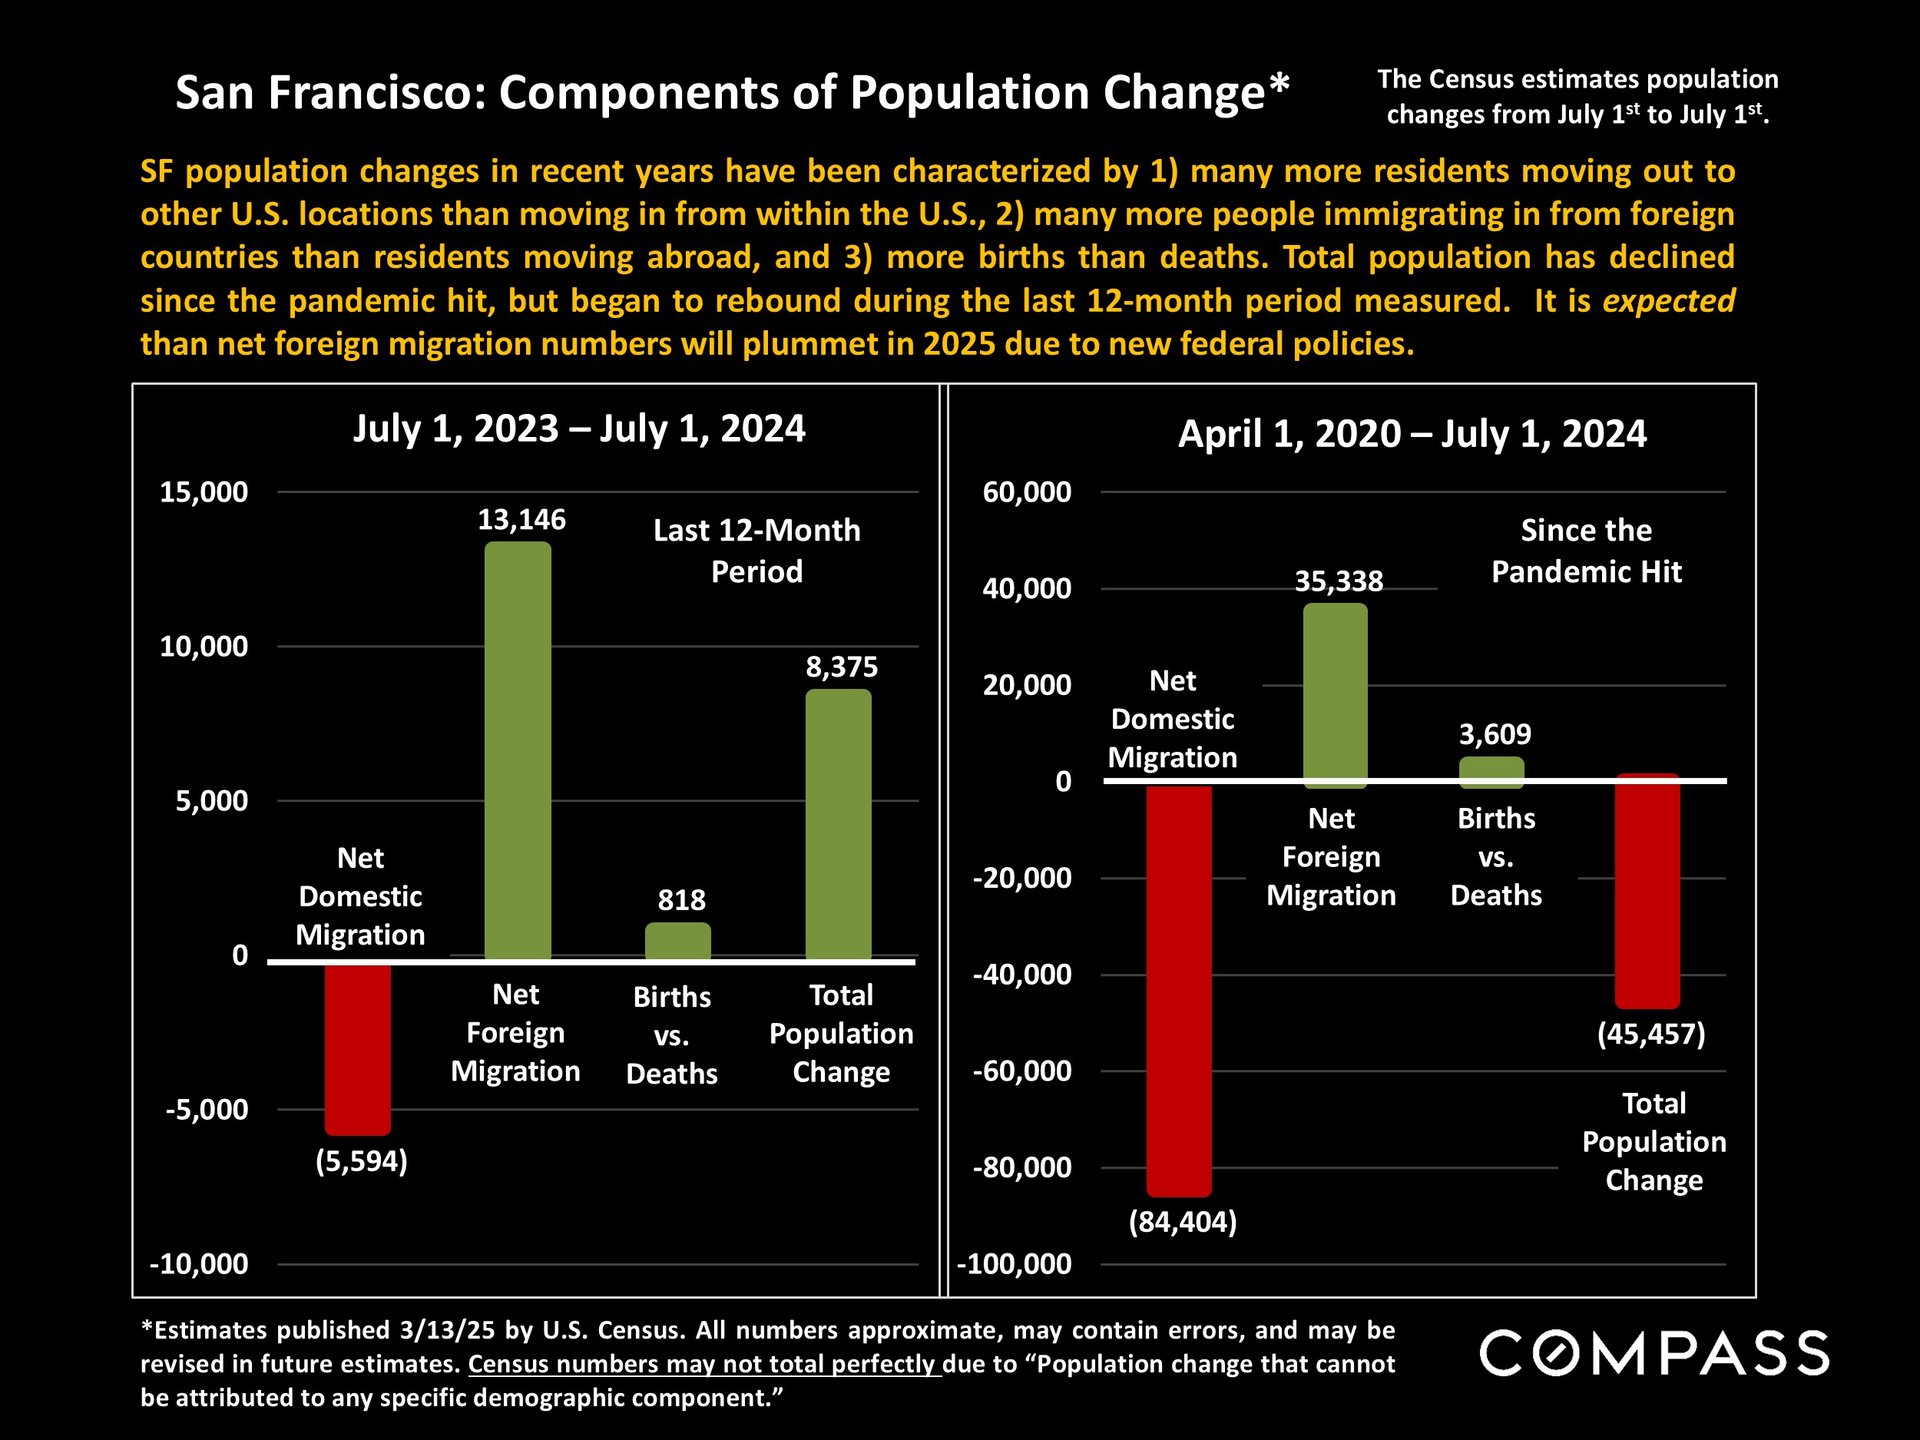
San Francisco population change infographic compares migration, births, deaths, and total change across two periods.

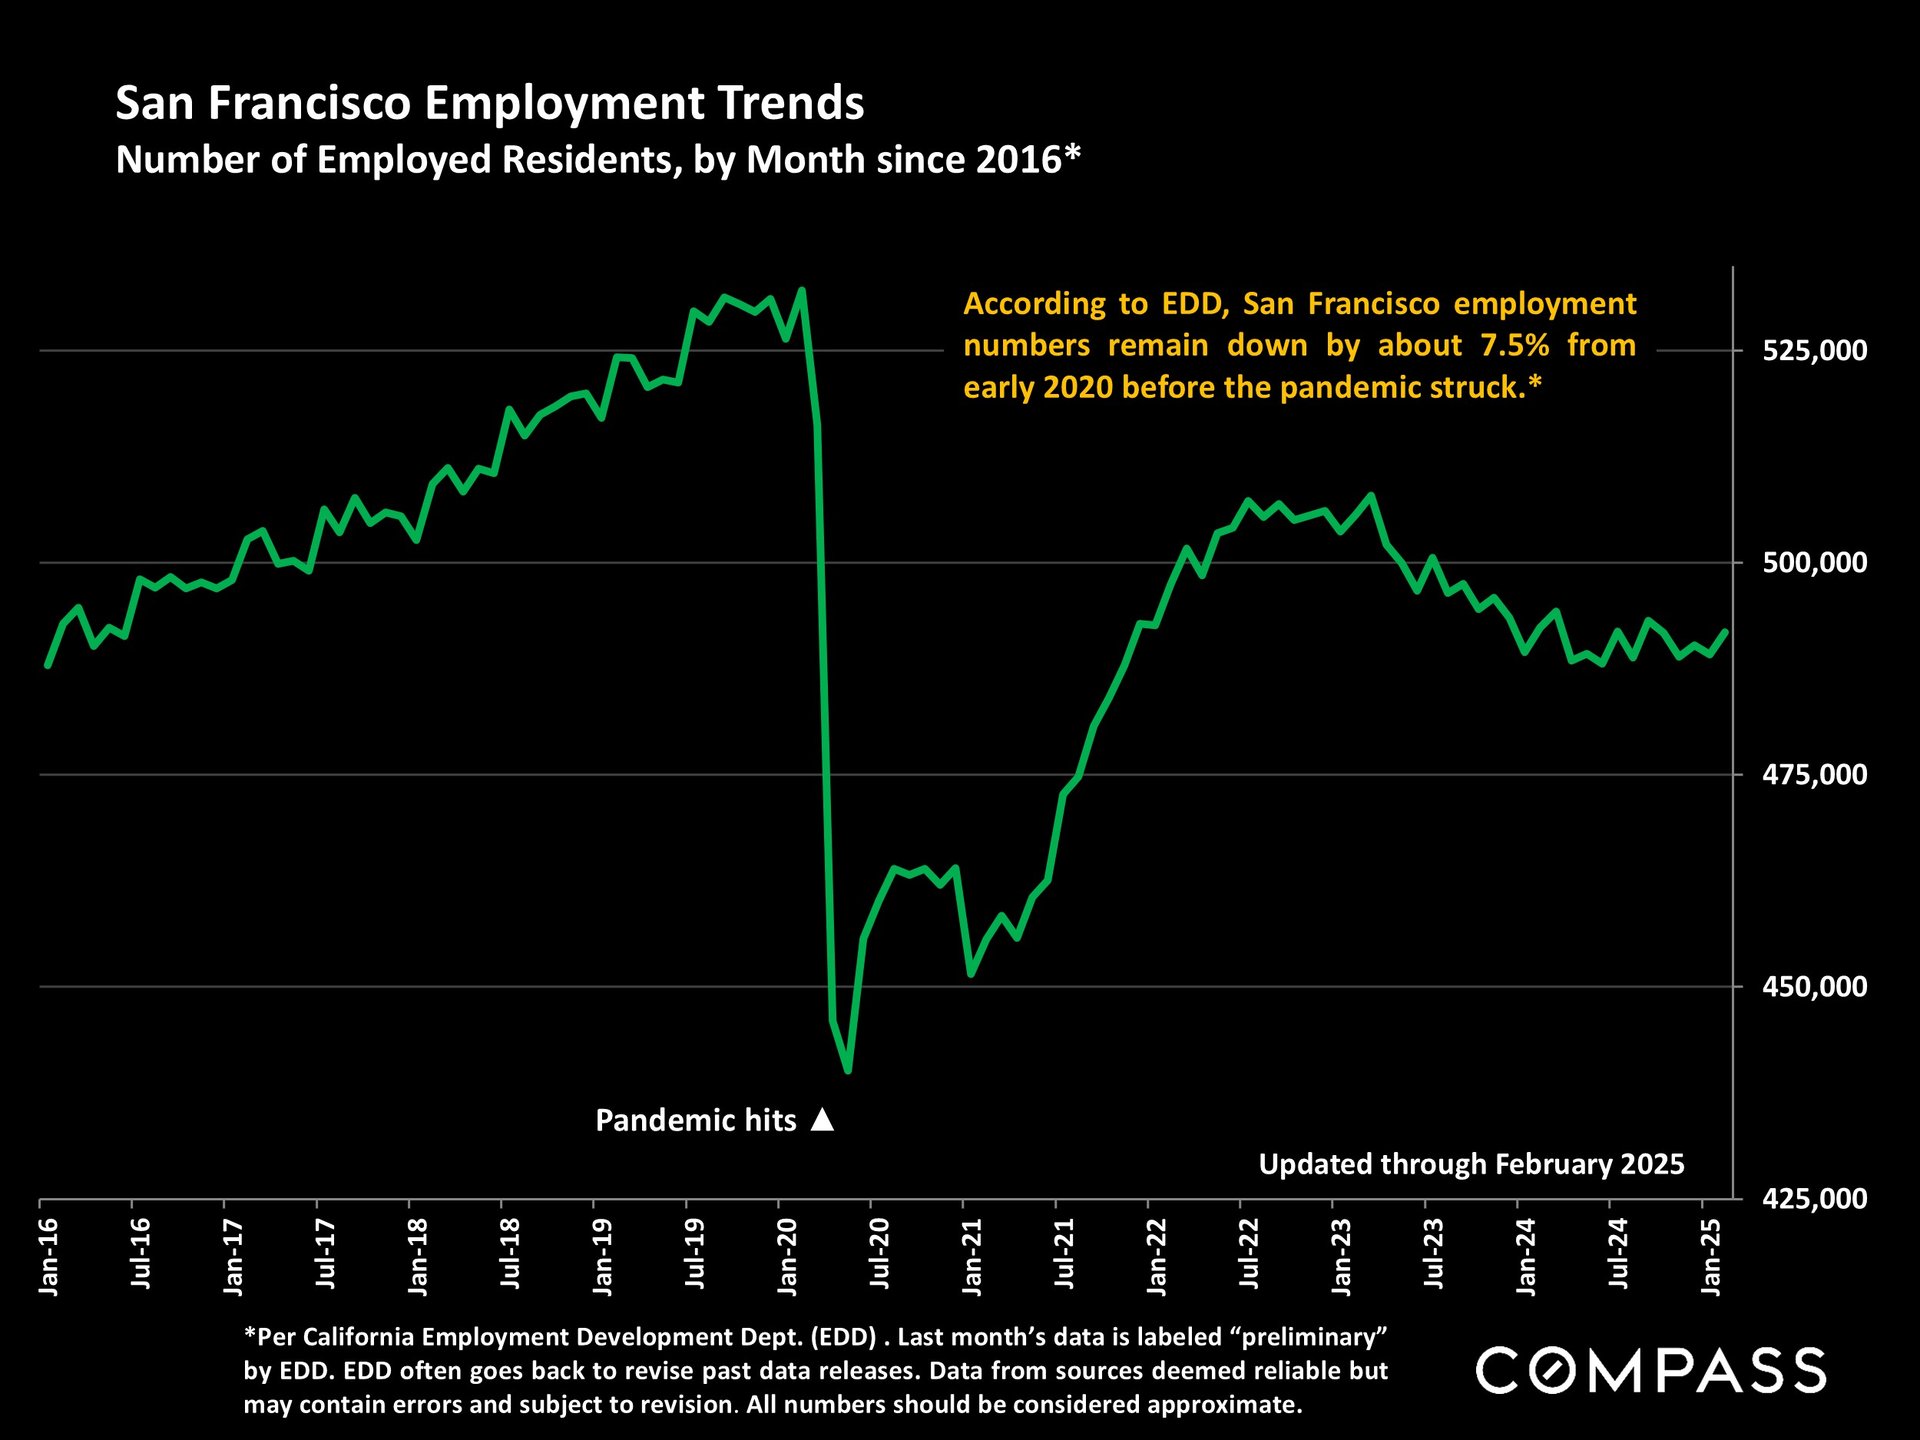
Chart of San Francisco employment from 2016 to February 2025, showing a sharp pandemic decline and incomplete recovery.

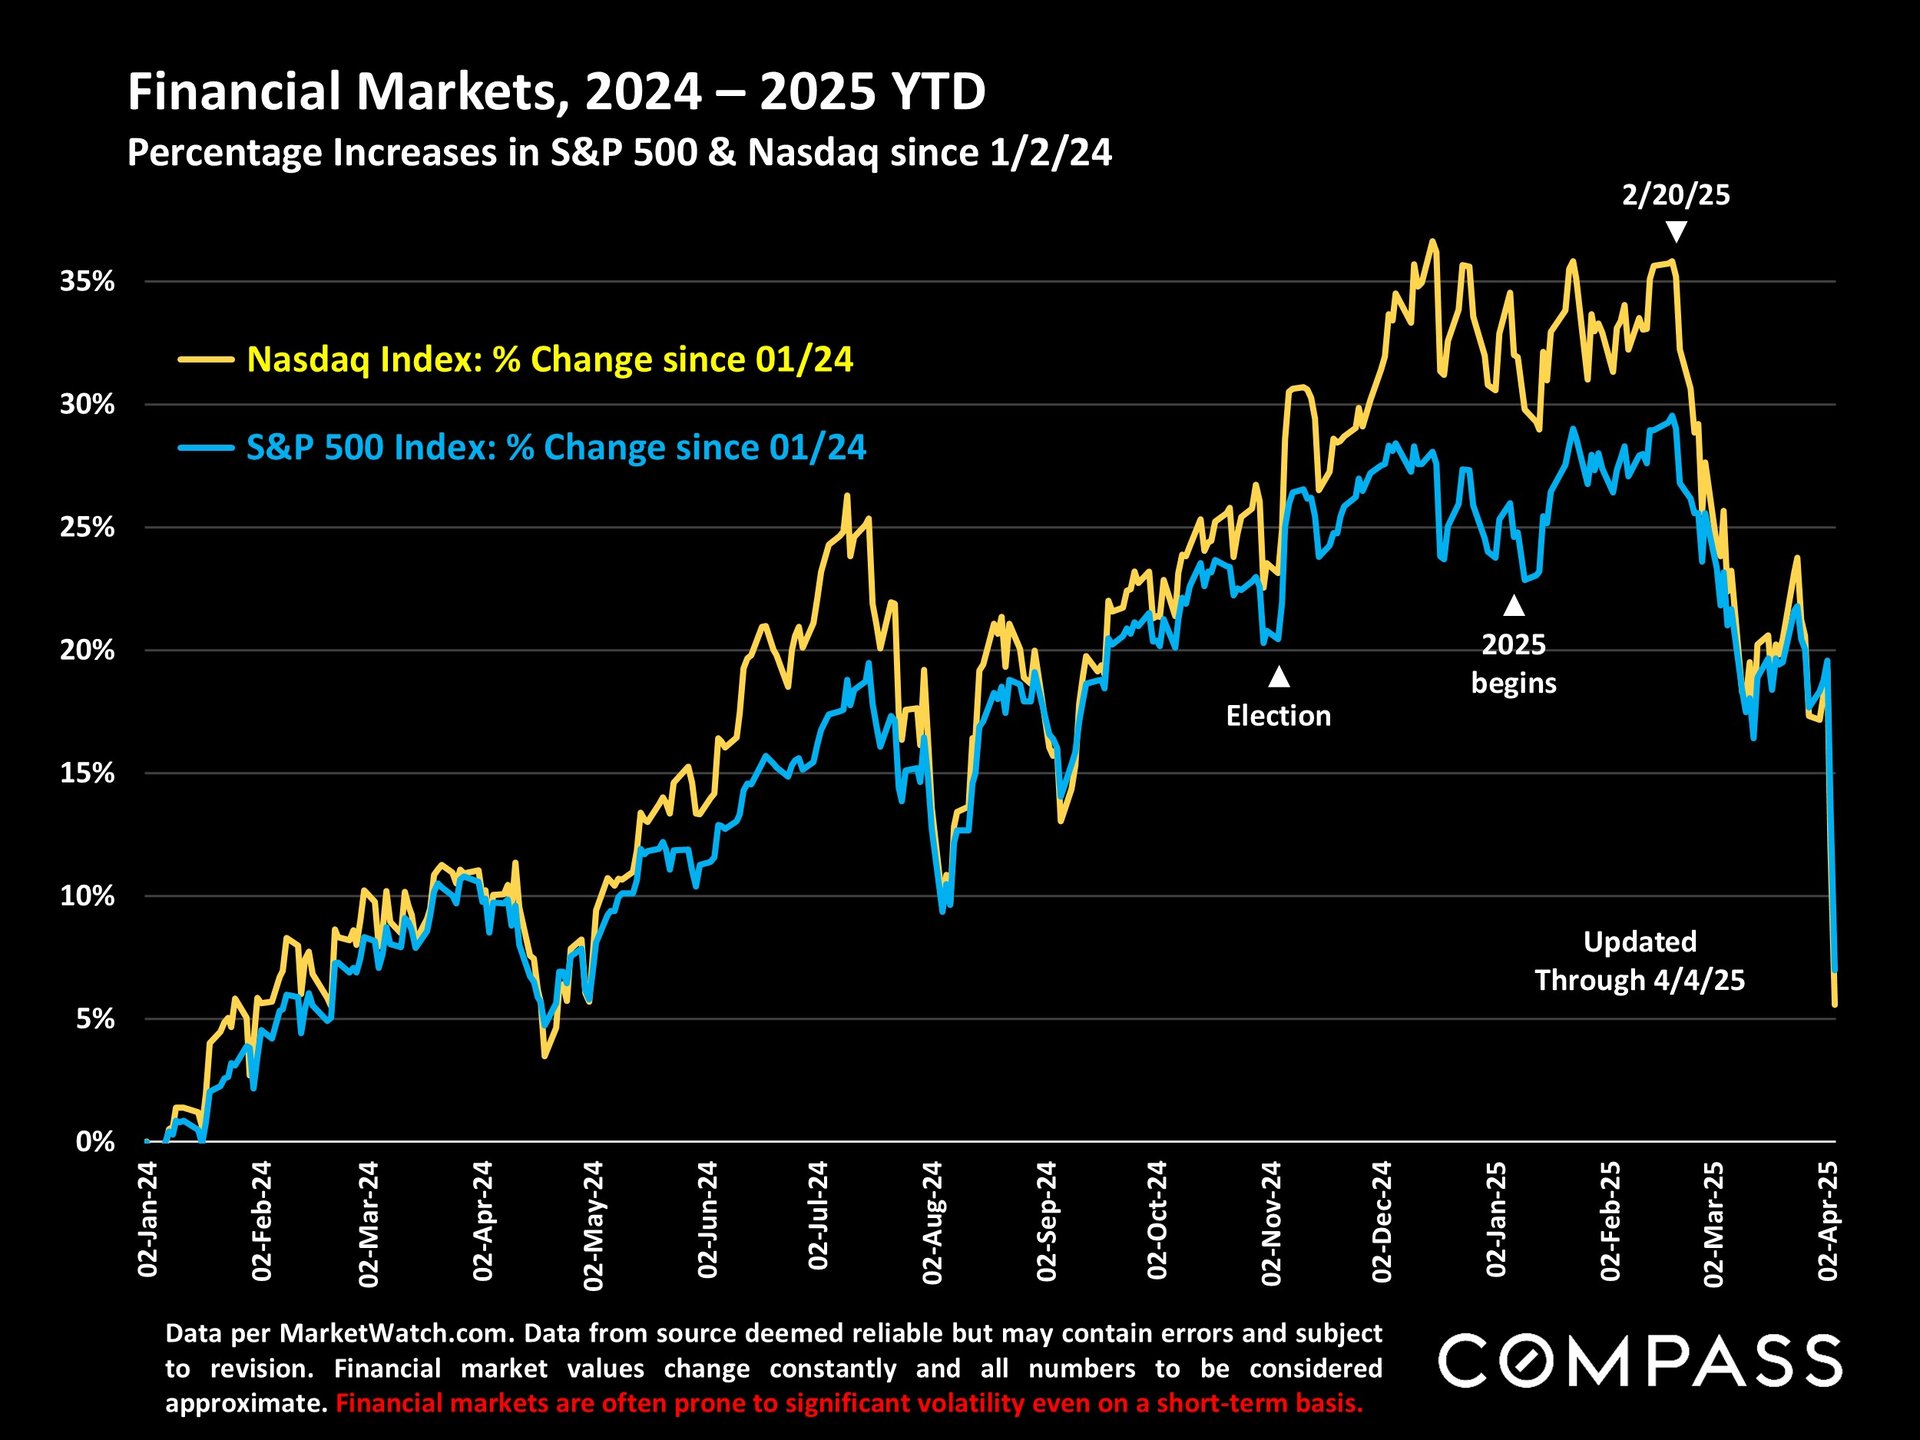
Line chart comparing Nasdaq and S&P 500 gains from January 2024 through April 4, 2025, with sharp declines at the end.

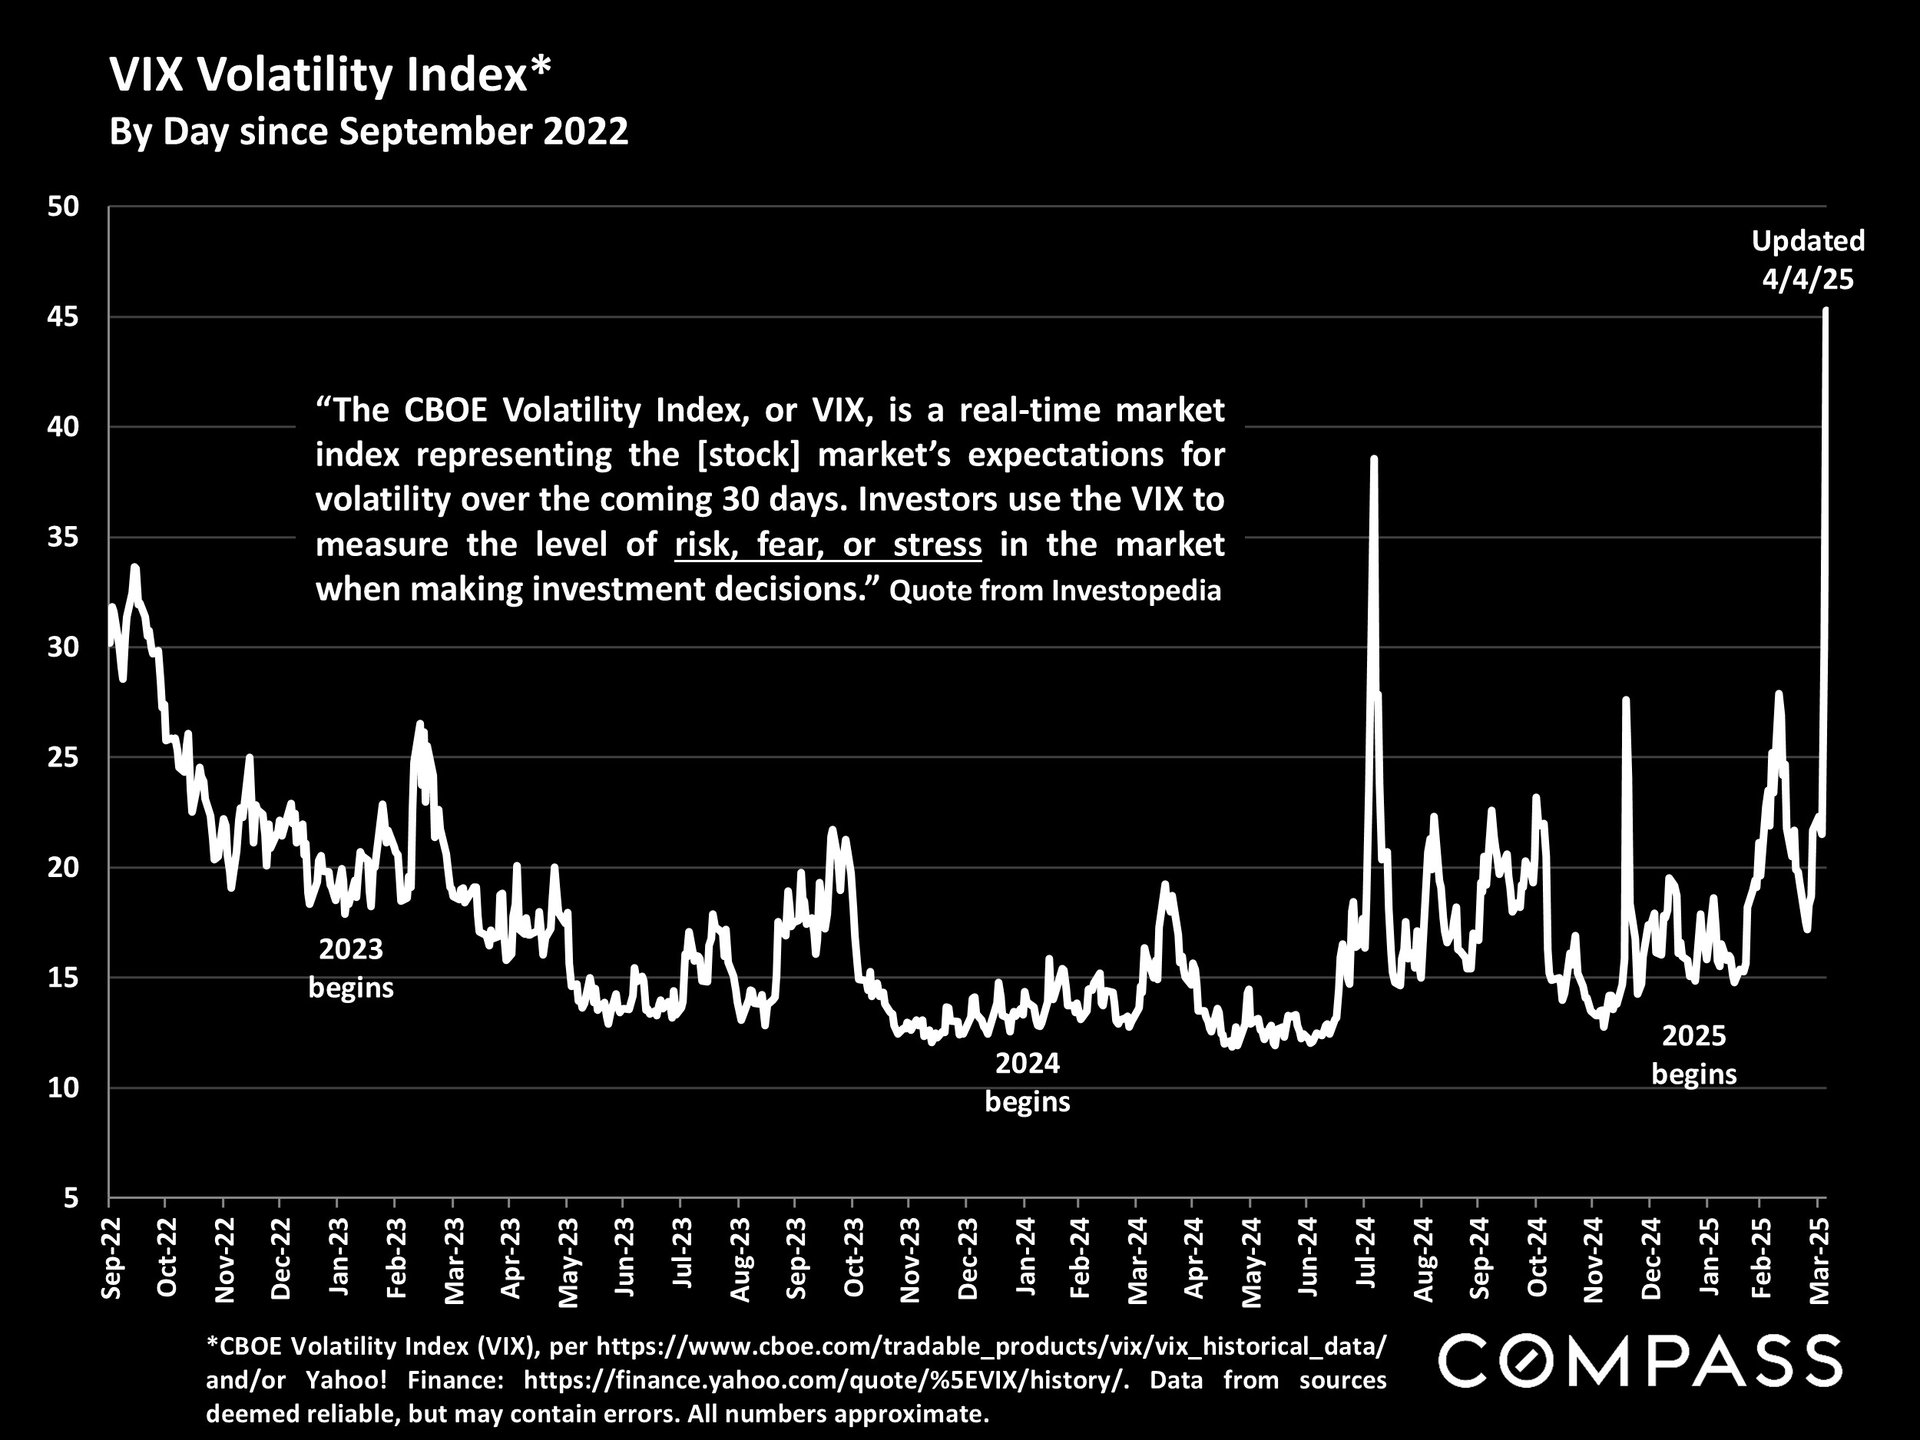
VIX line chart from September 2022 to March 2025, with a sharp rise to about 45 at the end.

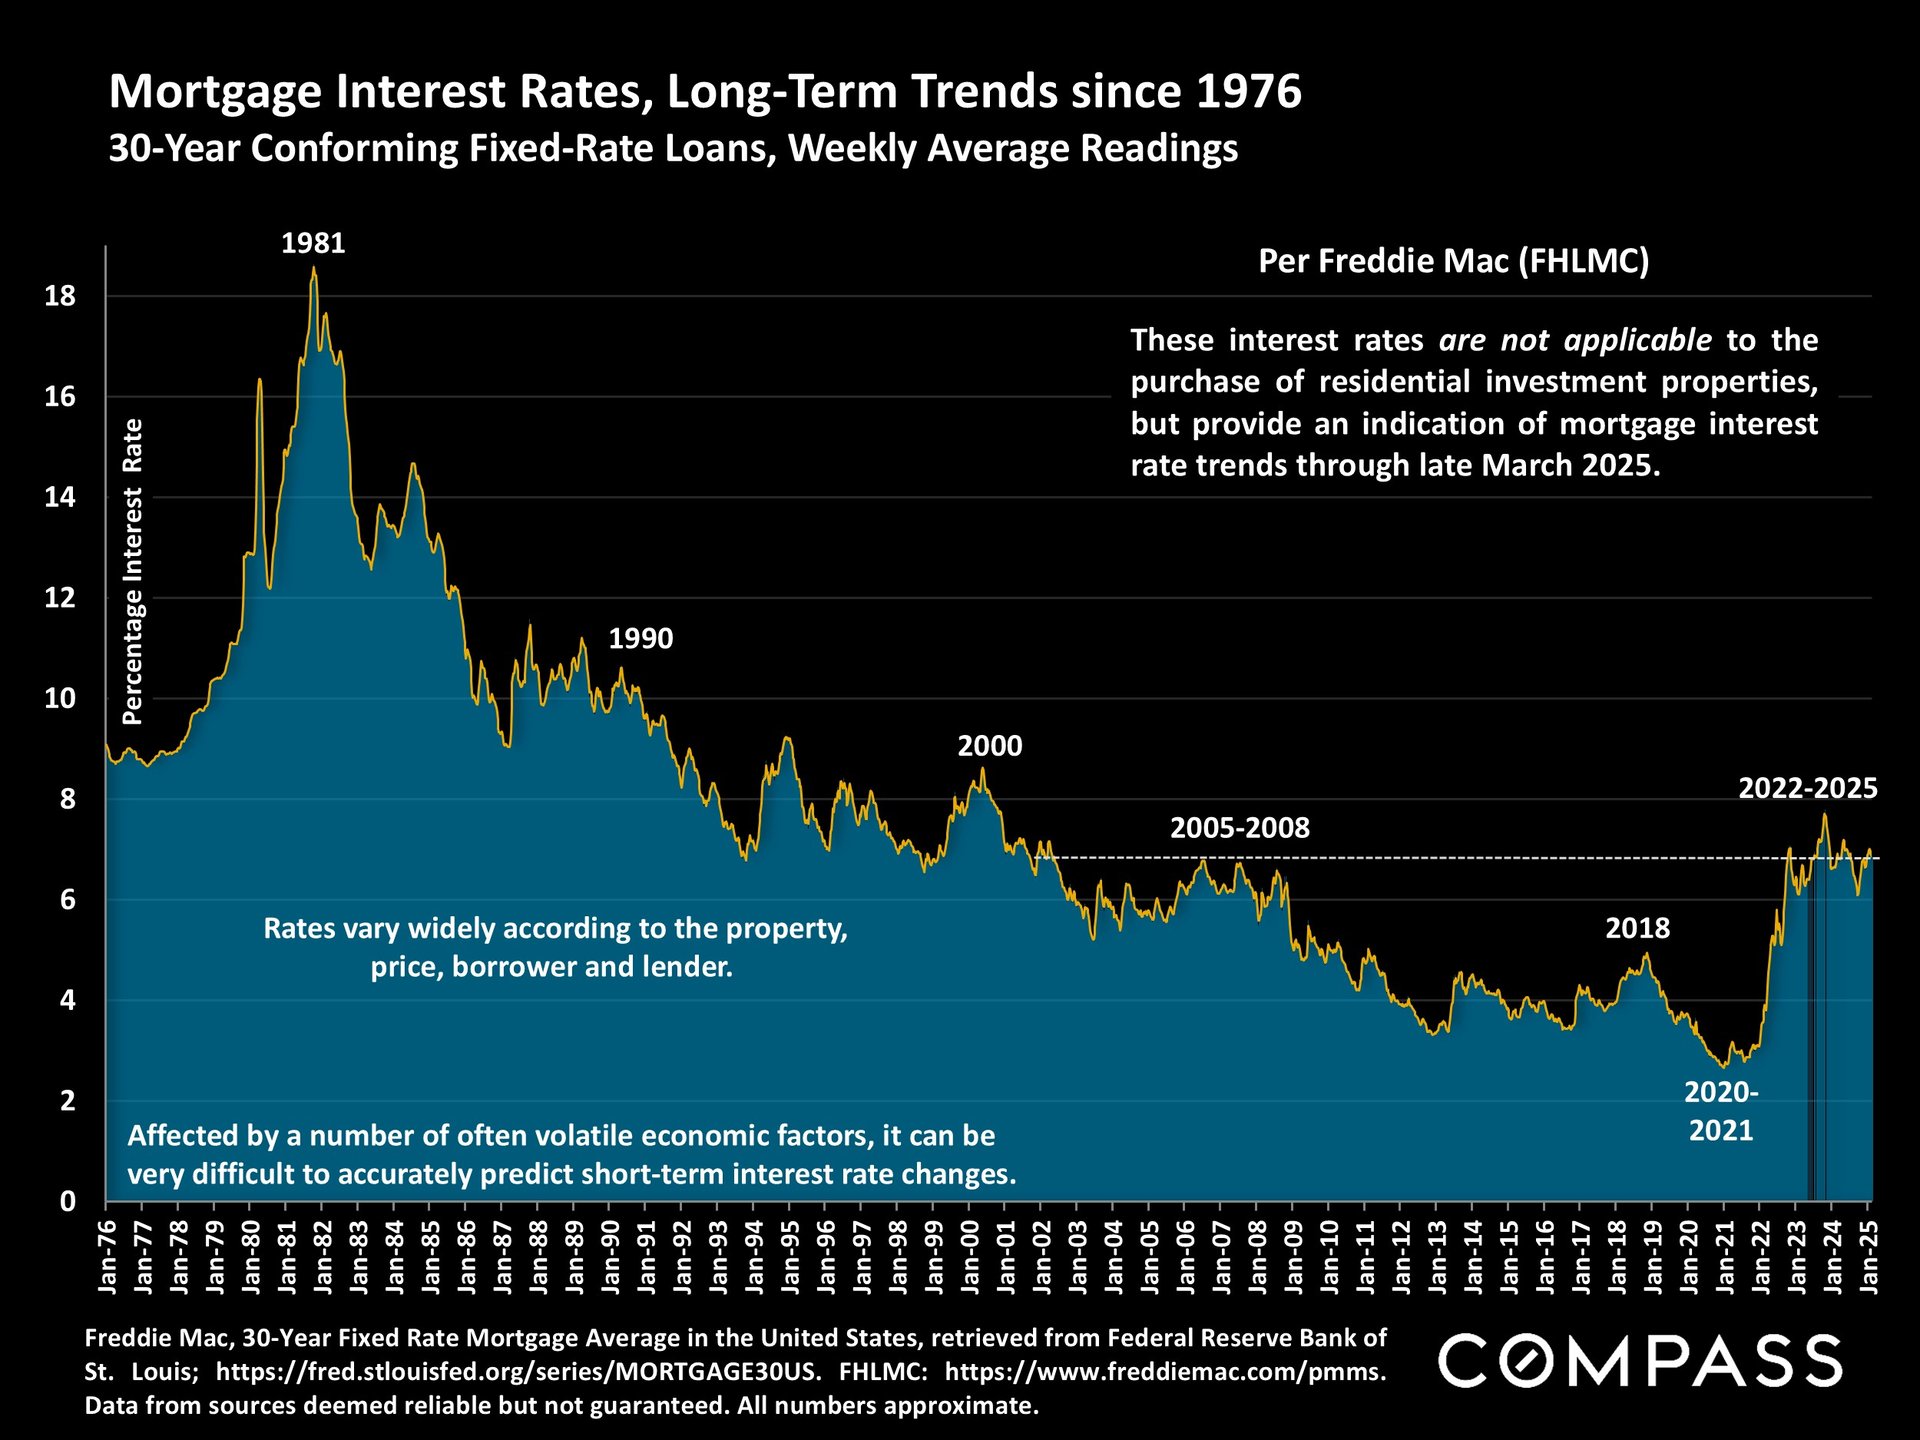
Chart of mortgage interest rates from 1976 to 2025, peaking near 18% in 1981 and rising to about 7% in 2025.

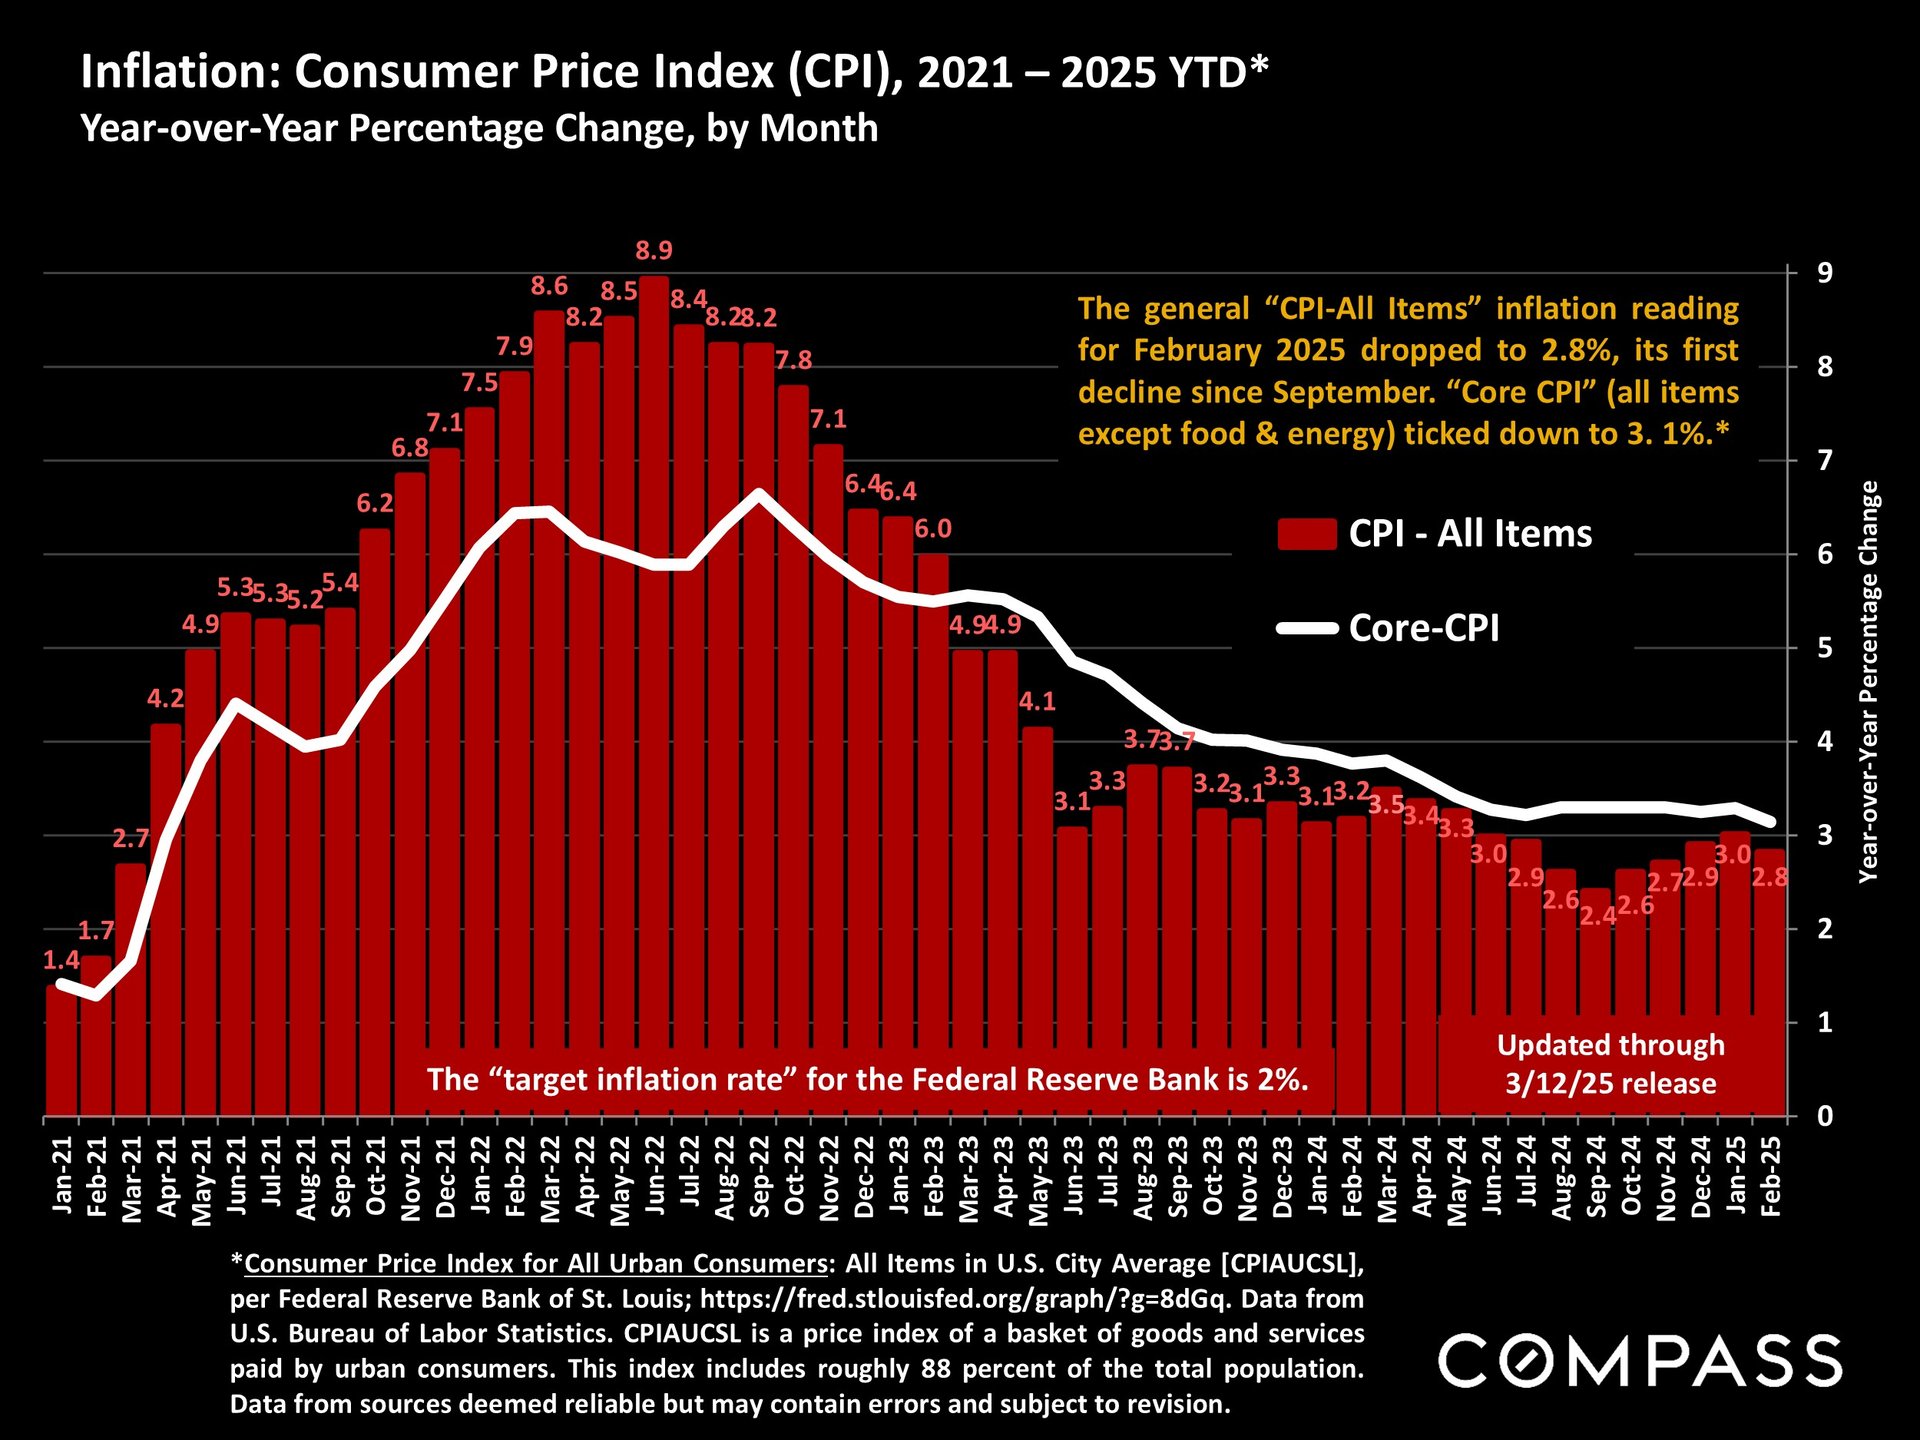
Chart of U.S. CPI and core inflation from January 2021 through February 2025, with monthly values and a 2% target.

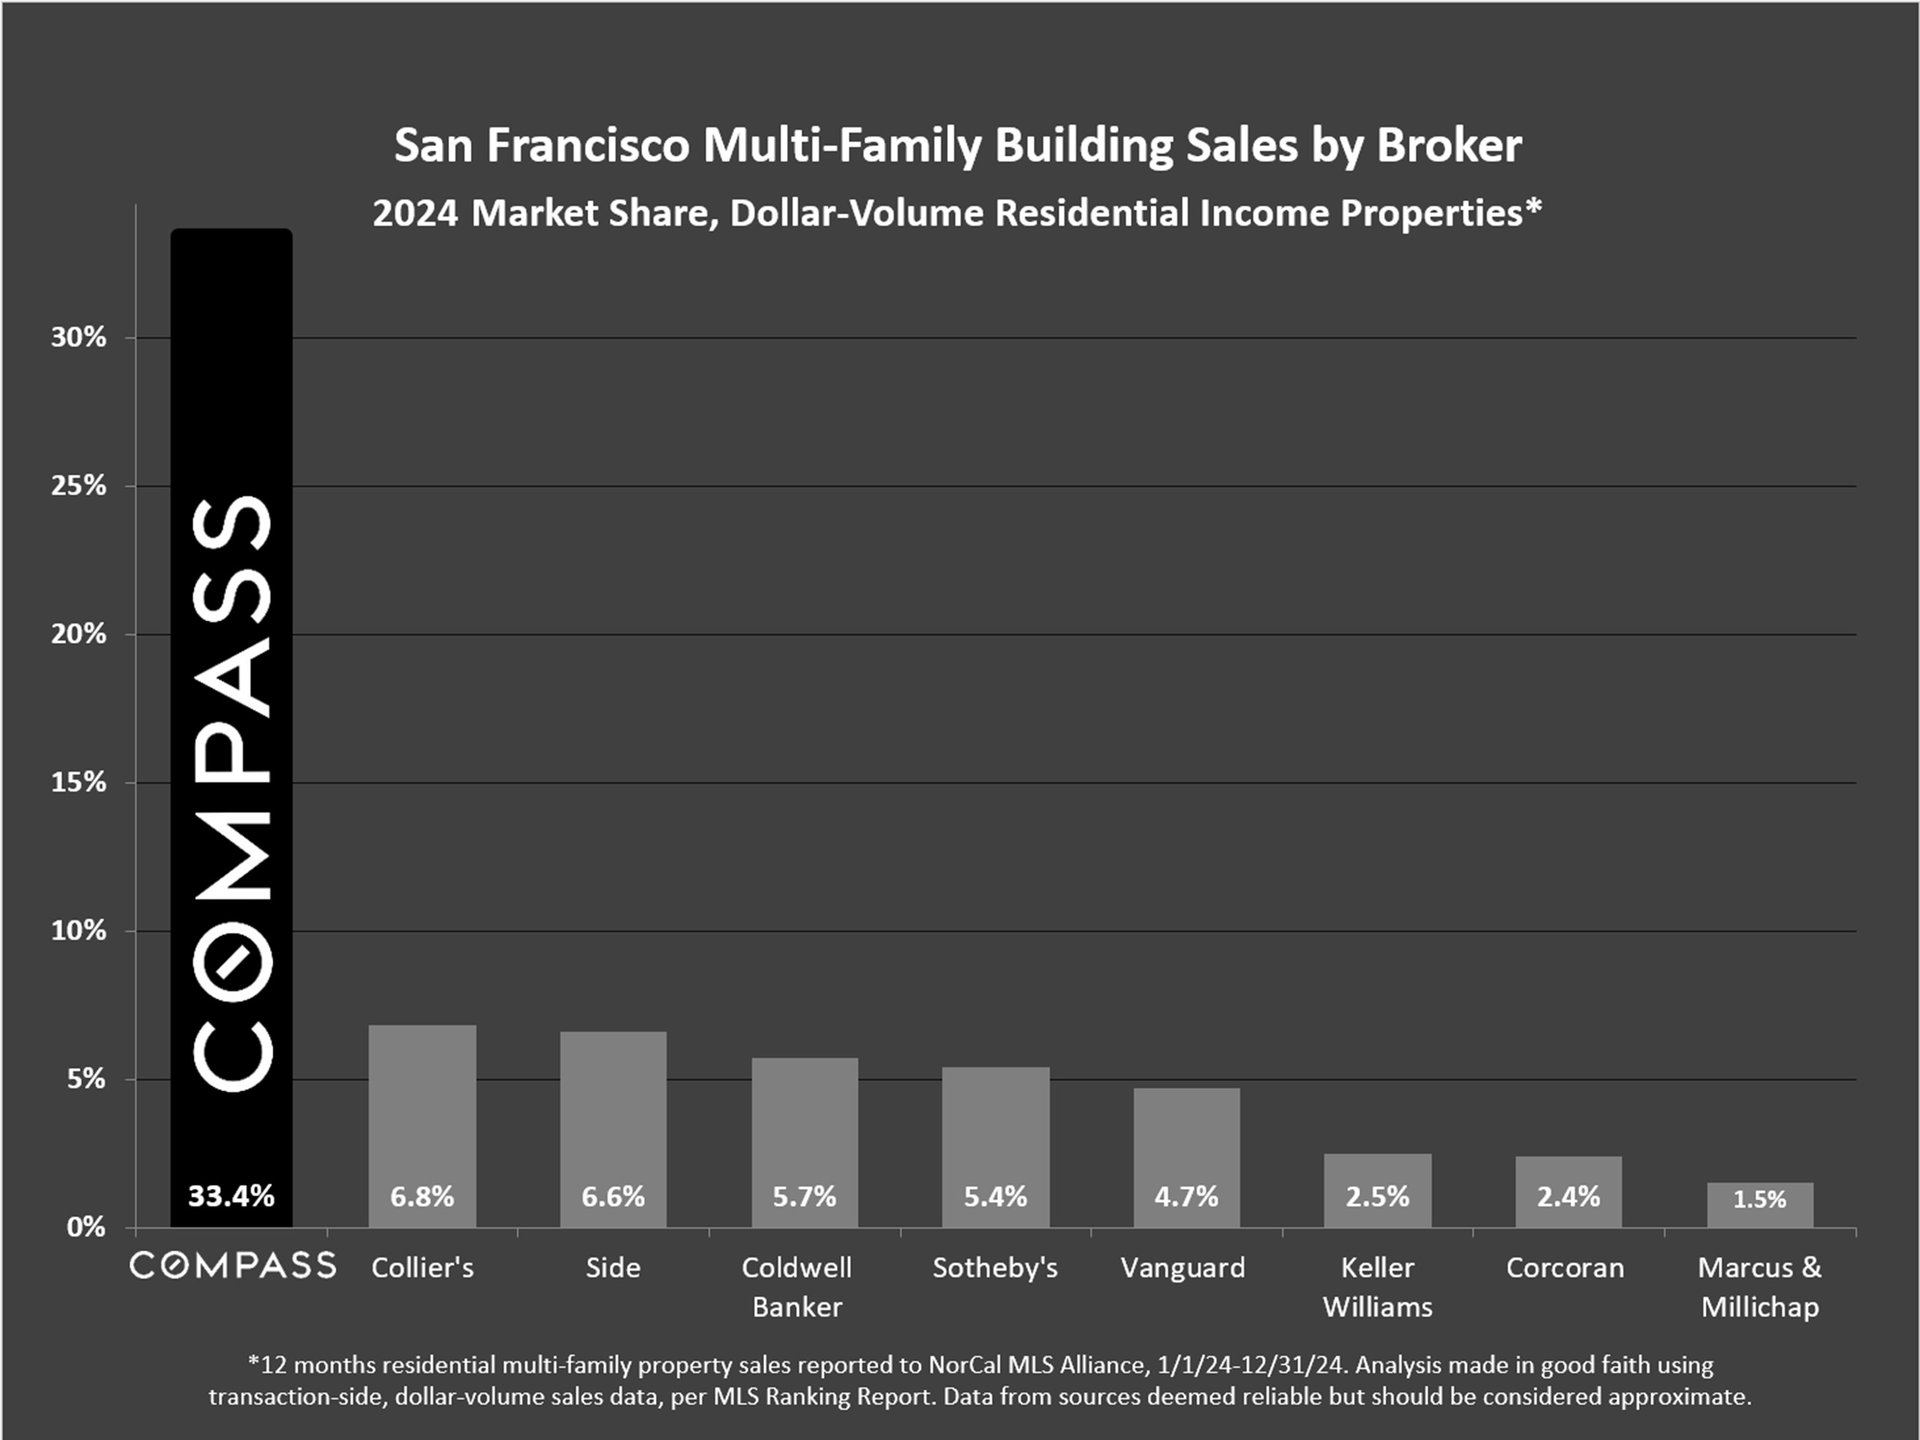
Bar chart of 2024 San Francisco multifamily sales market share by broker; Compass leads with 33.4%.

Compass market report disclaimer page with statistical cautions, legal notice, and 2025 copyright.

Work With Hanna John Azar

During his past experiences, Hanna John Azar has gained particularly strong knowledge and hands-on experience in maneuvering complex multi-faceted value-add investments.
Contact