Blog

The San Francisco 2-4 Unit Apartment Building Market

January 2025 Report

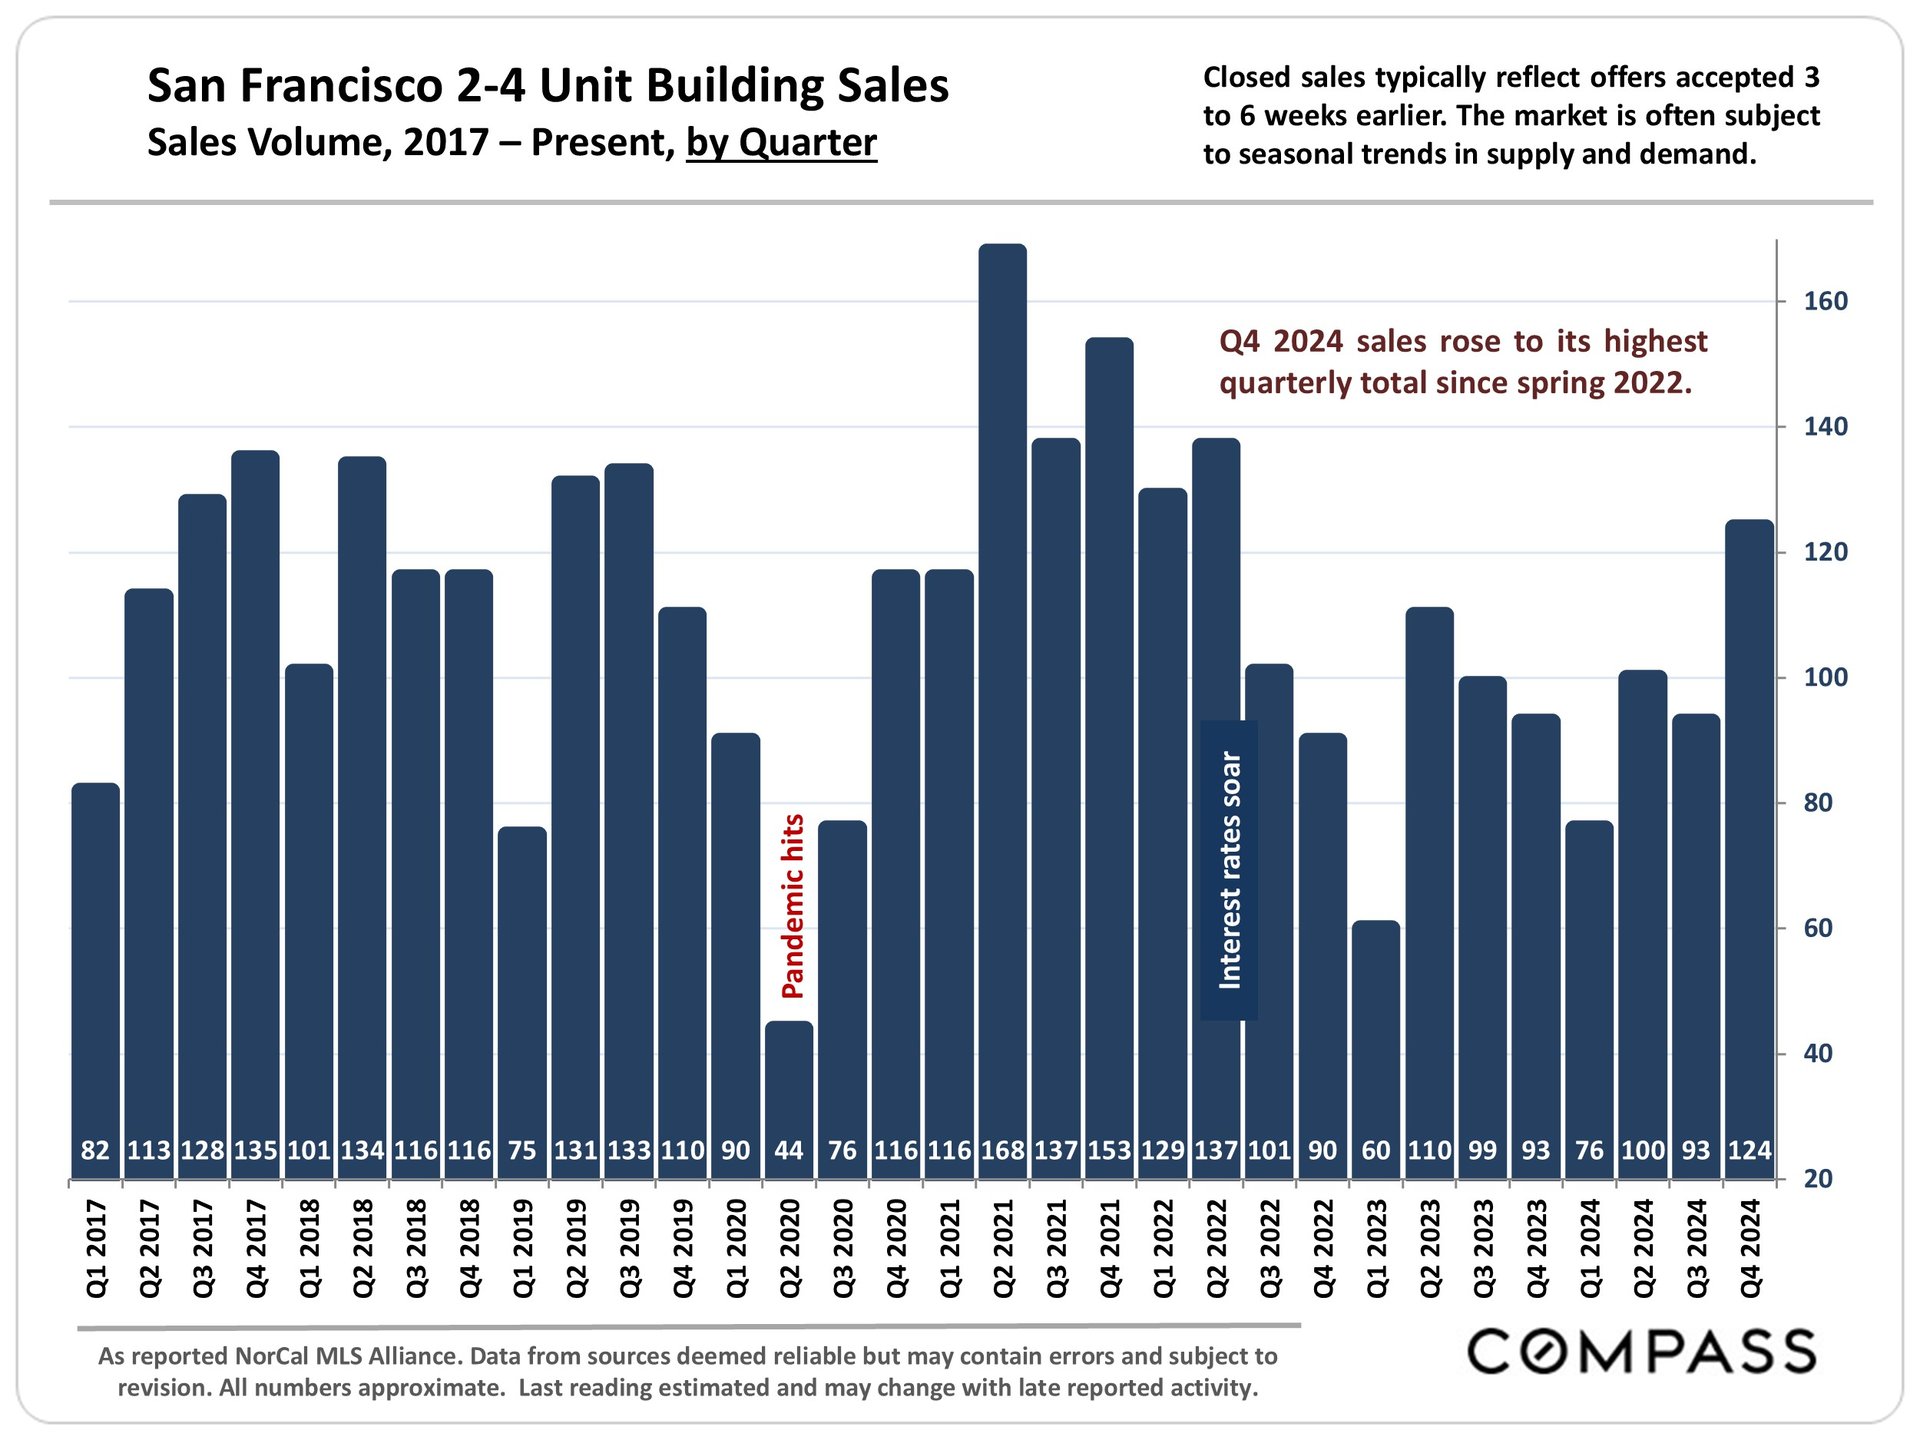
Bar chart of San Francisco 2–4 unit building sales by quarter from 2017 through 2024.

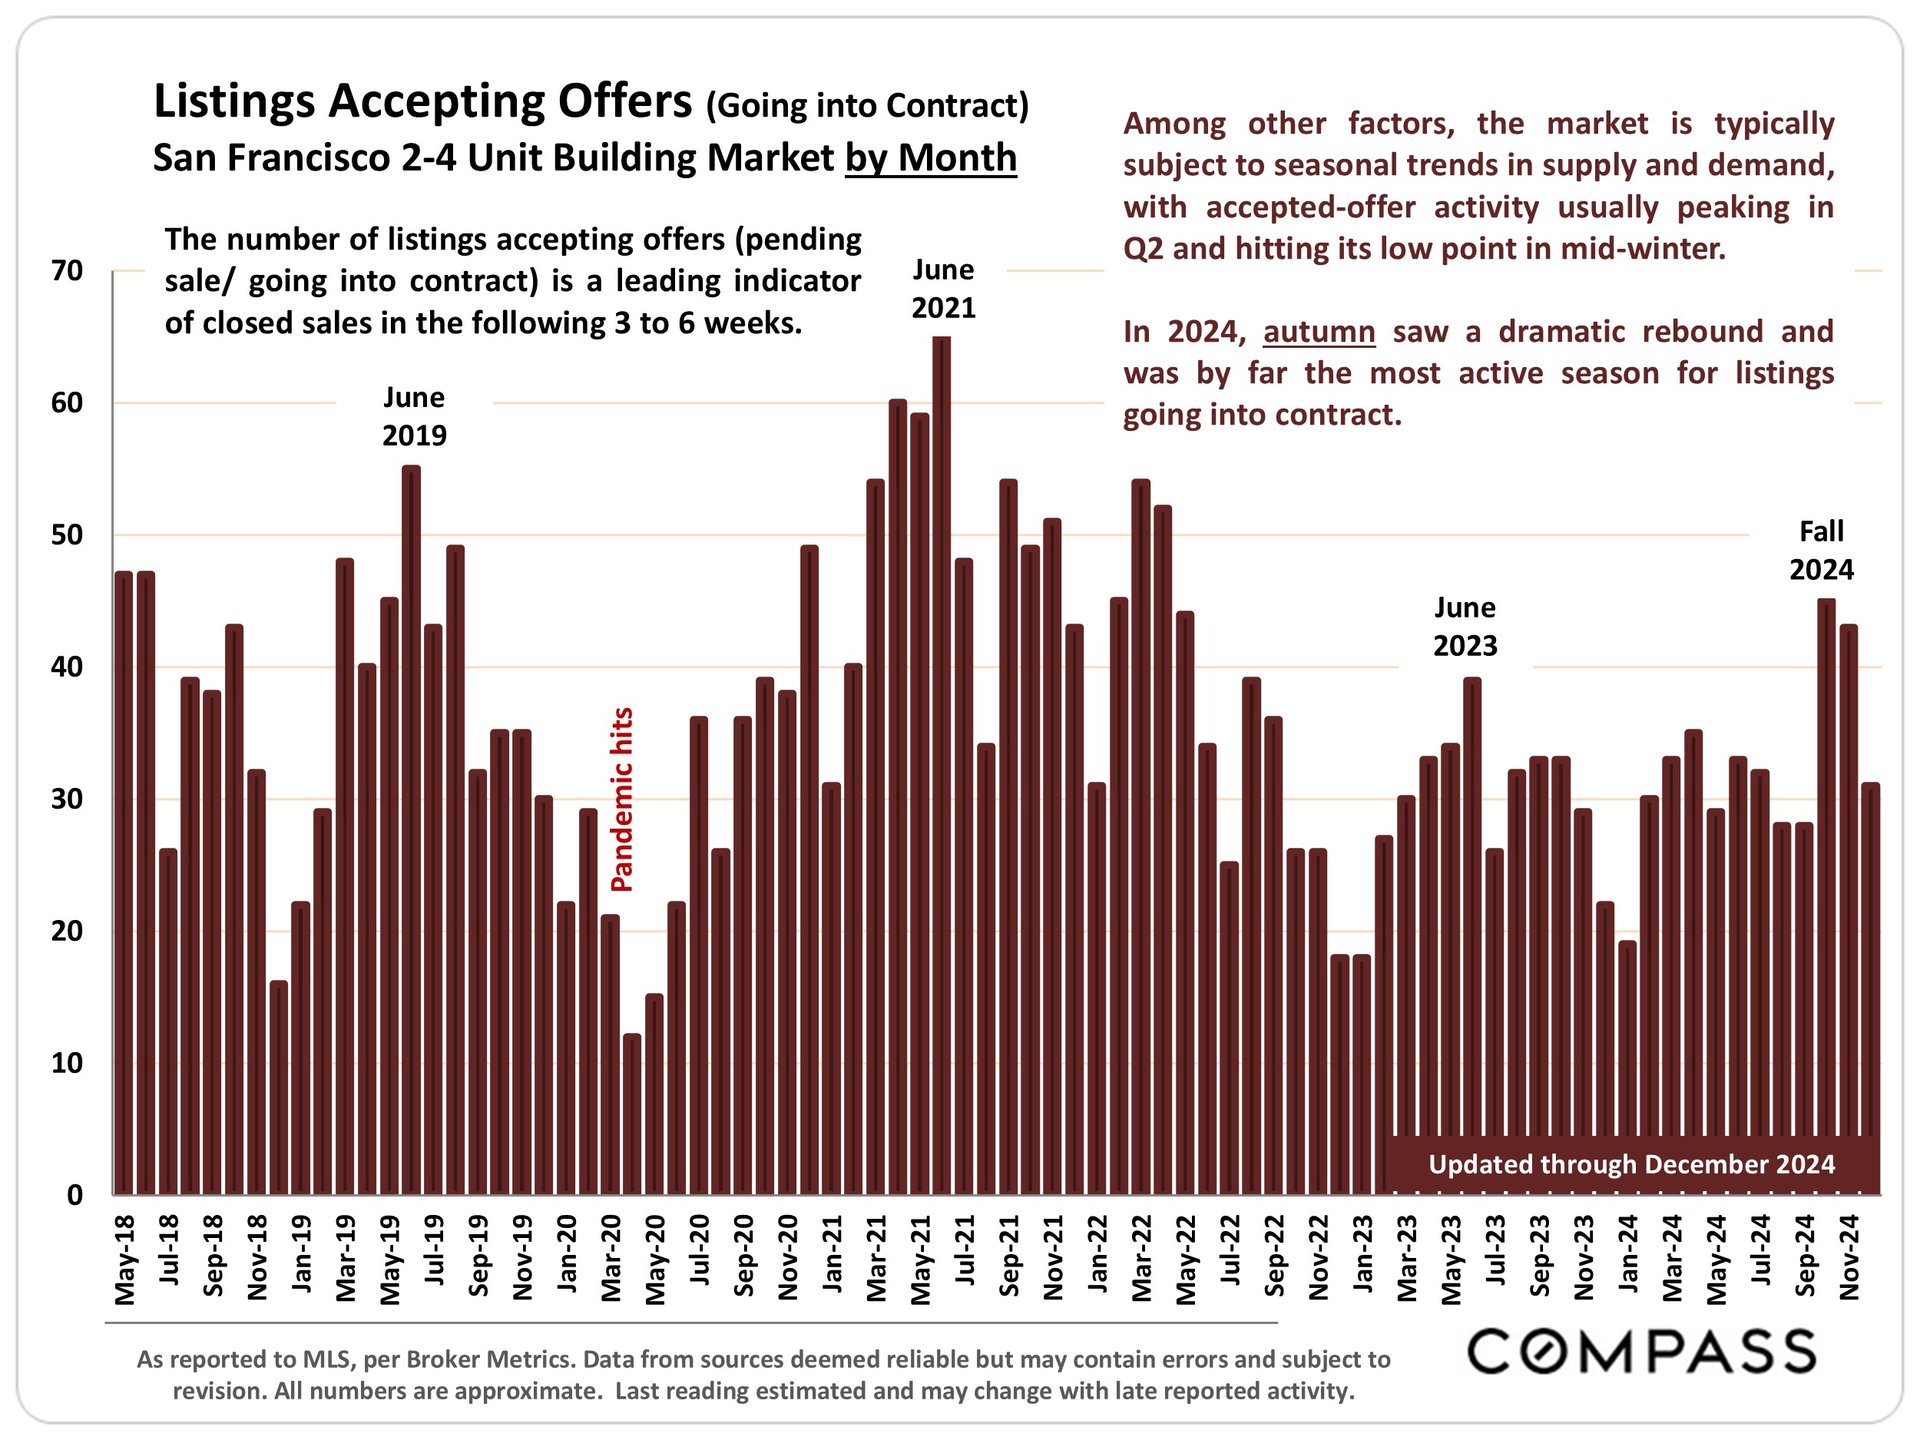
Bar chart of San Francisco 2–4 unit listings accepting offers monthly, May 2018–December 2024, with a fall 2024 rebound.

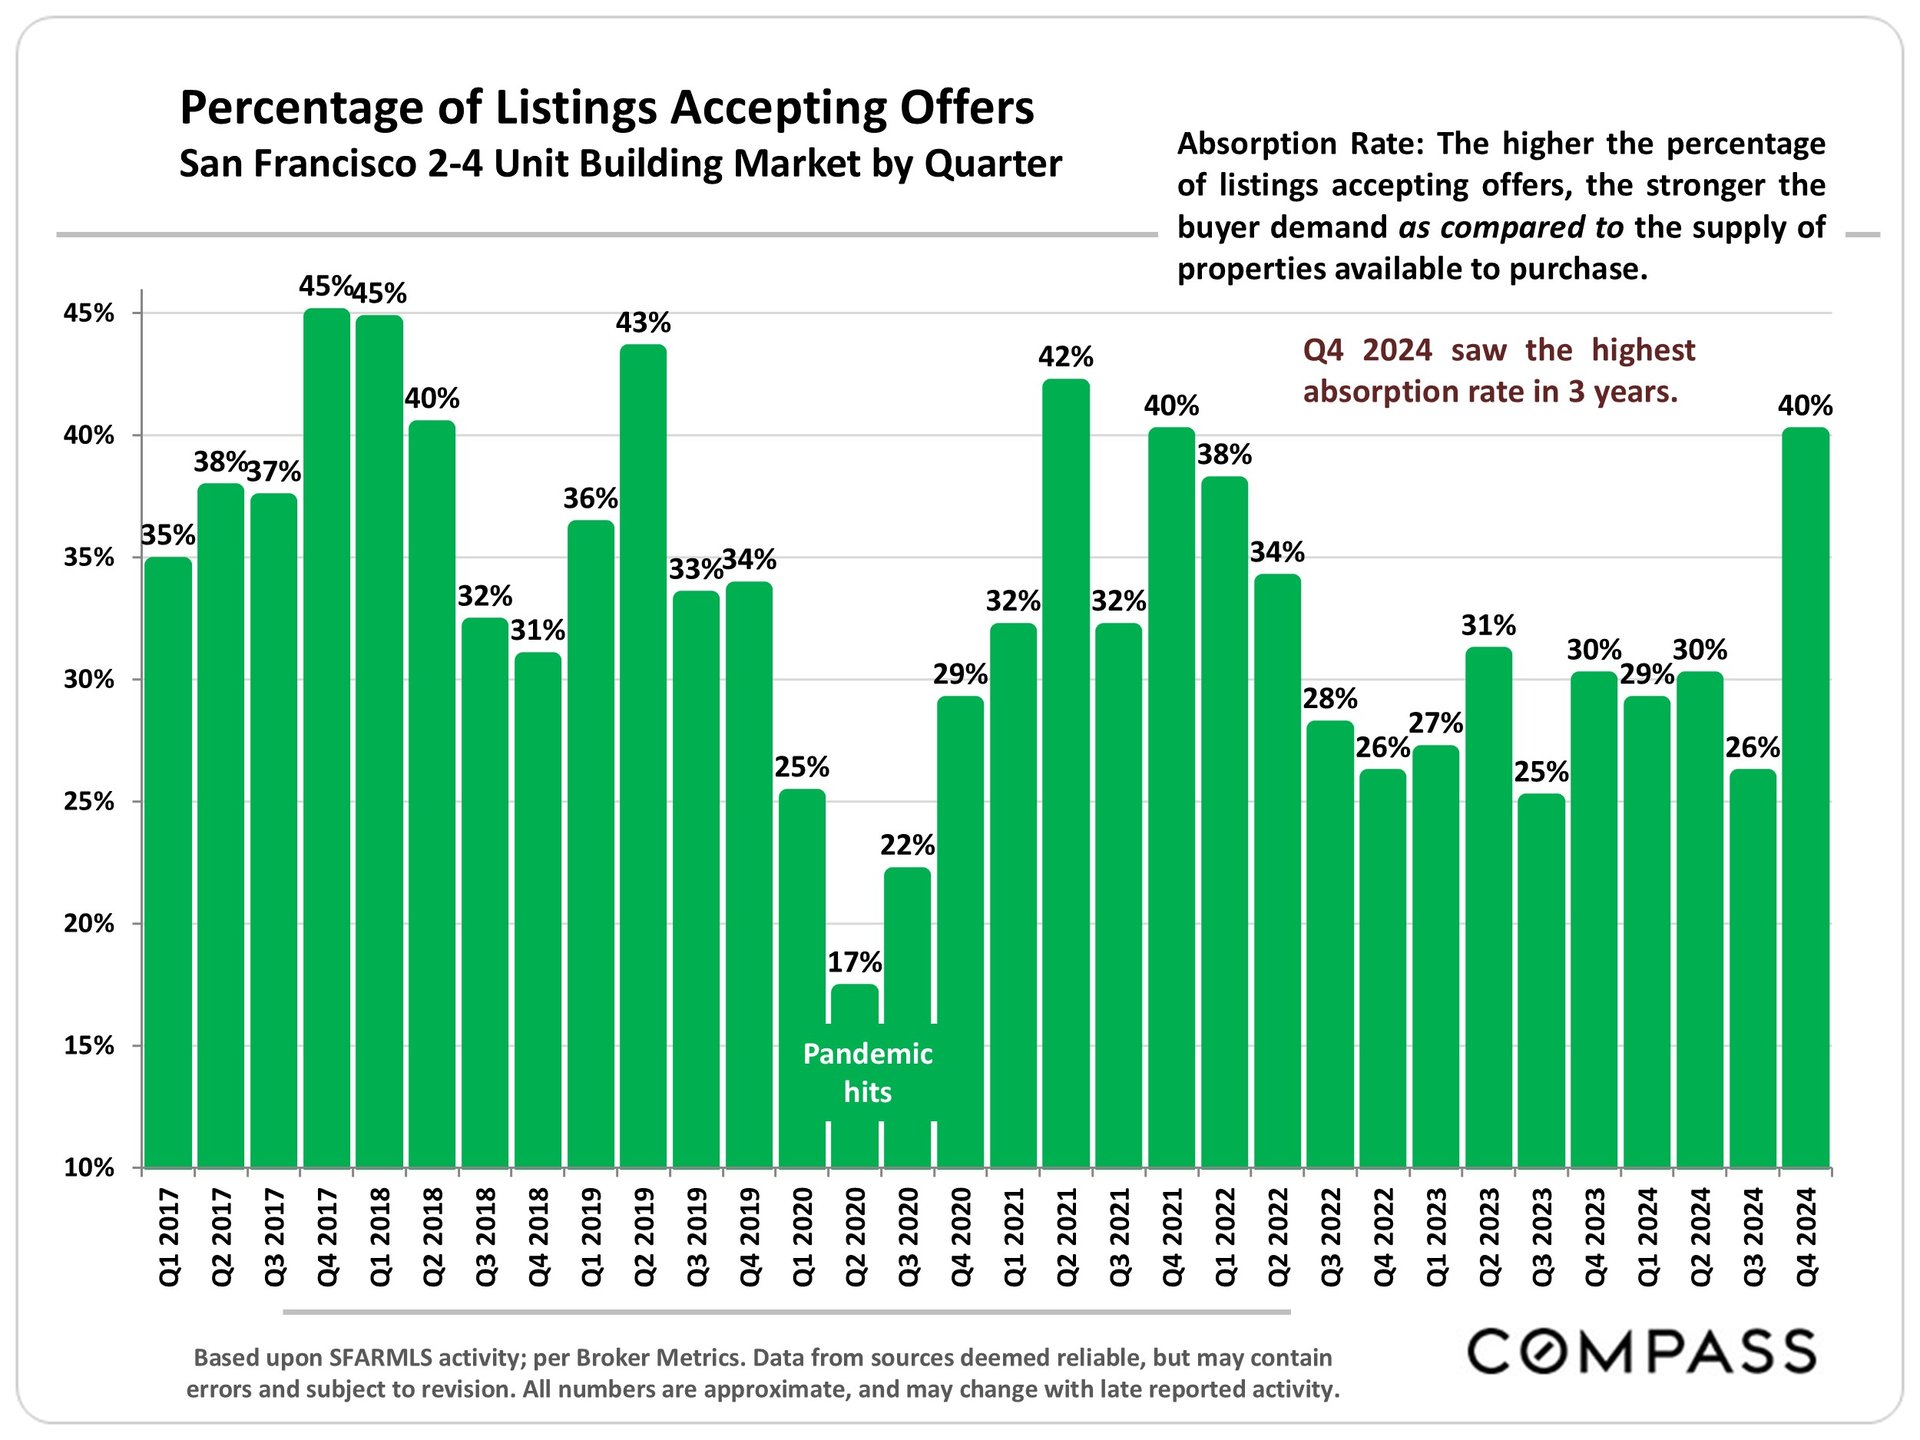
Chart of San Francisco 2–4 unit building offer absorption rates by quarter, with Q4 2024 reaching 40%.

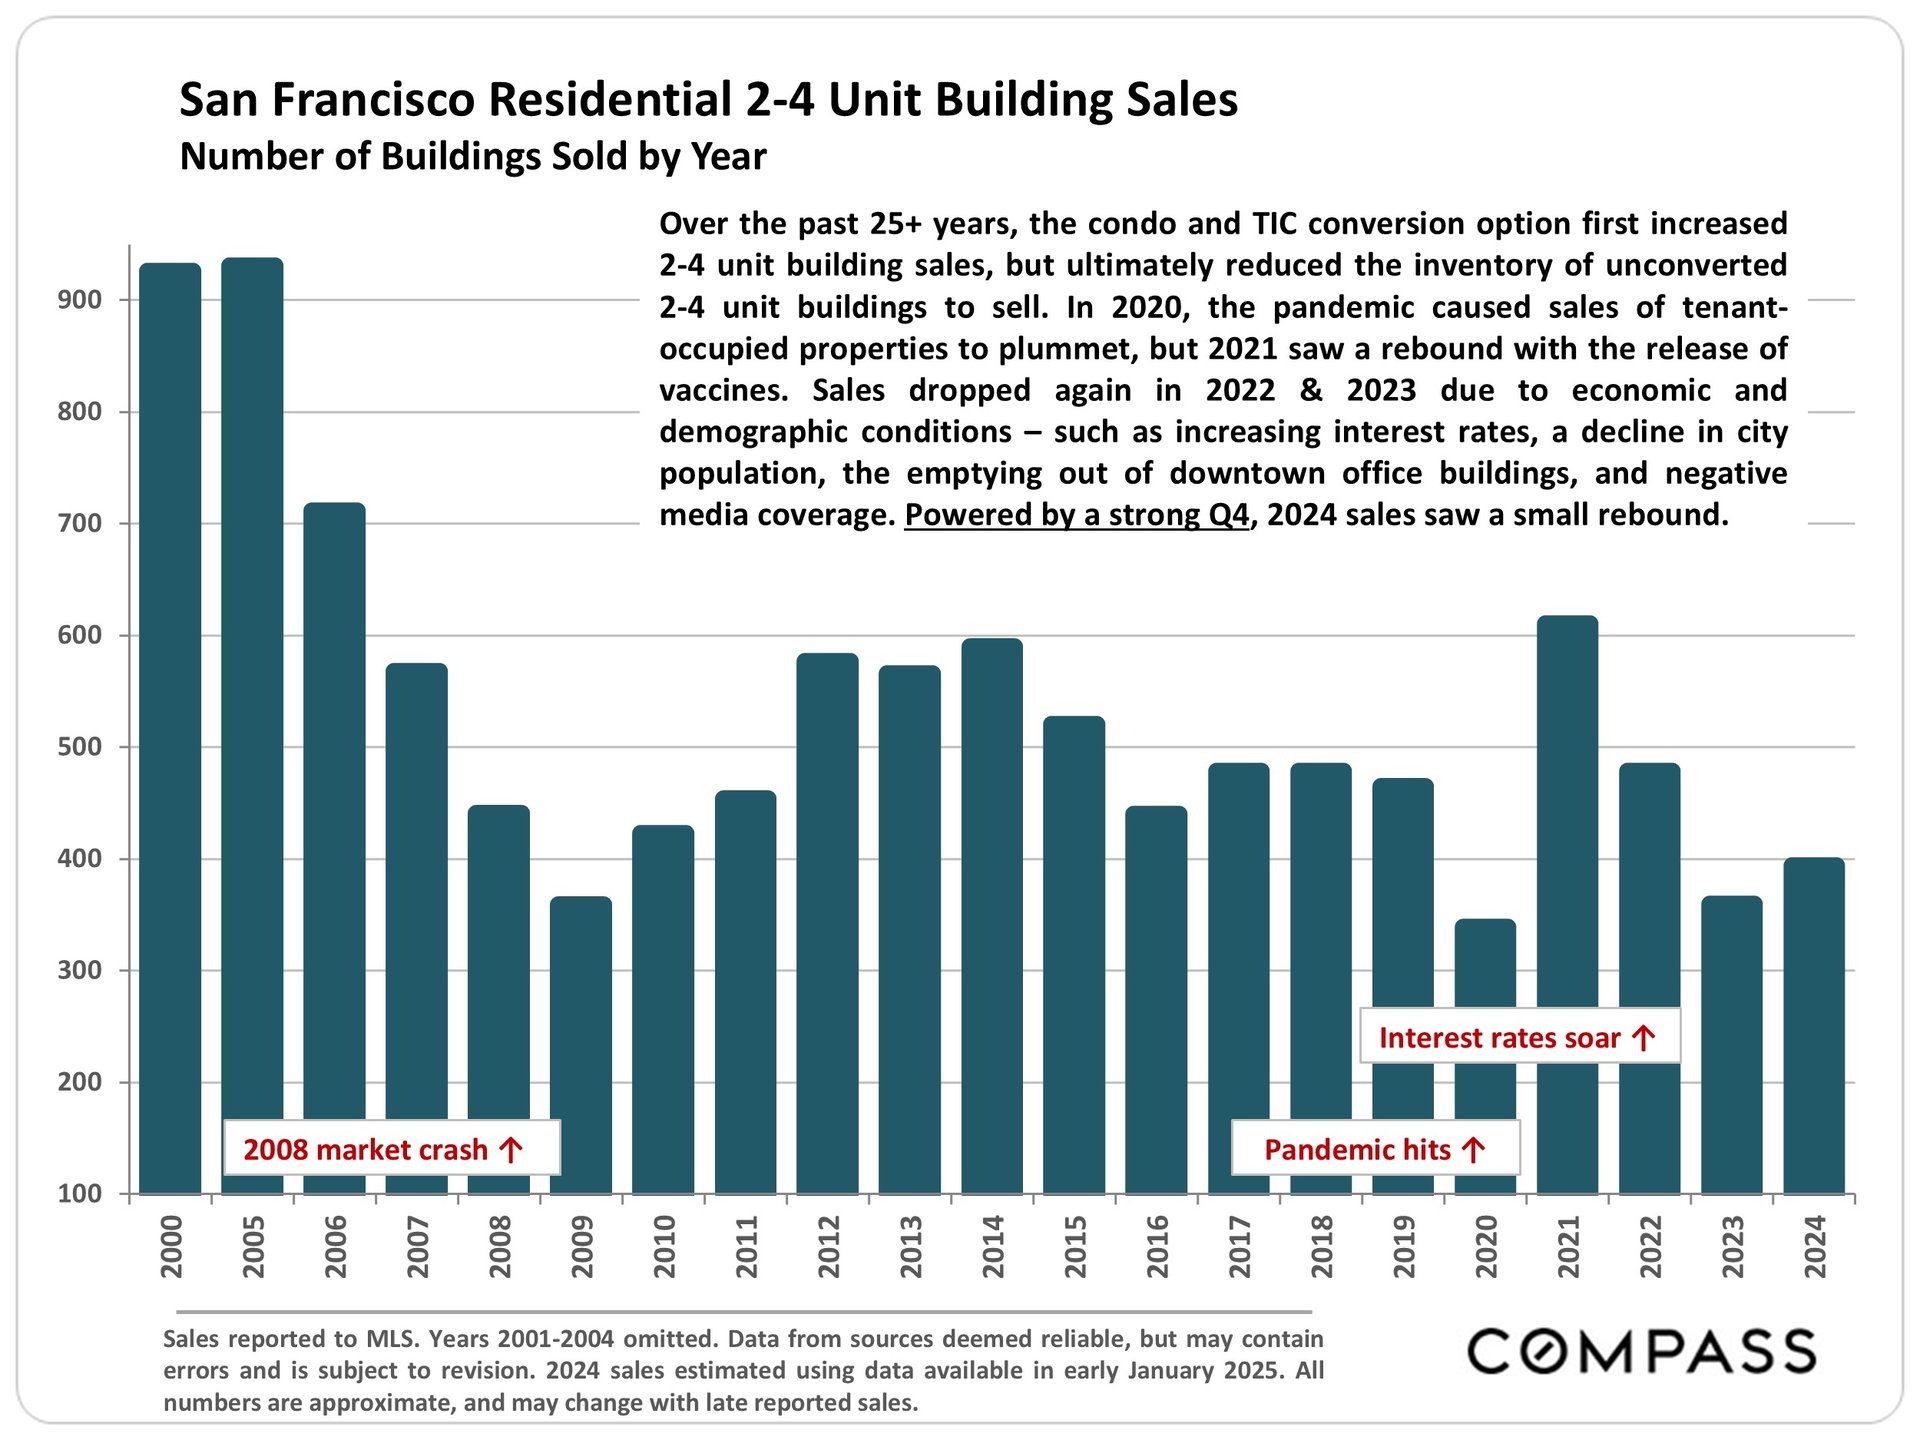
Bar chart of San Francisco 2–4 unit building sales, showing a small rebound in 2024 after a pandemic-era decline.

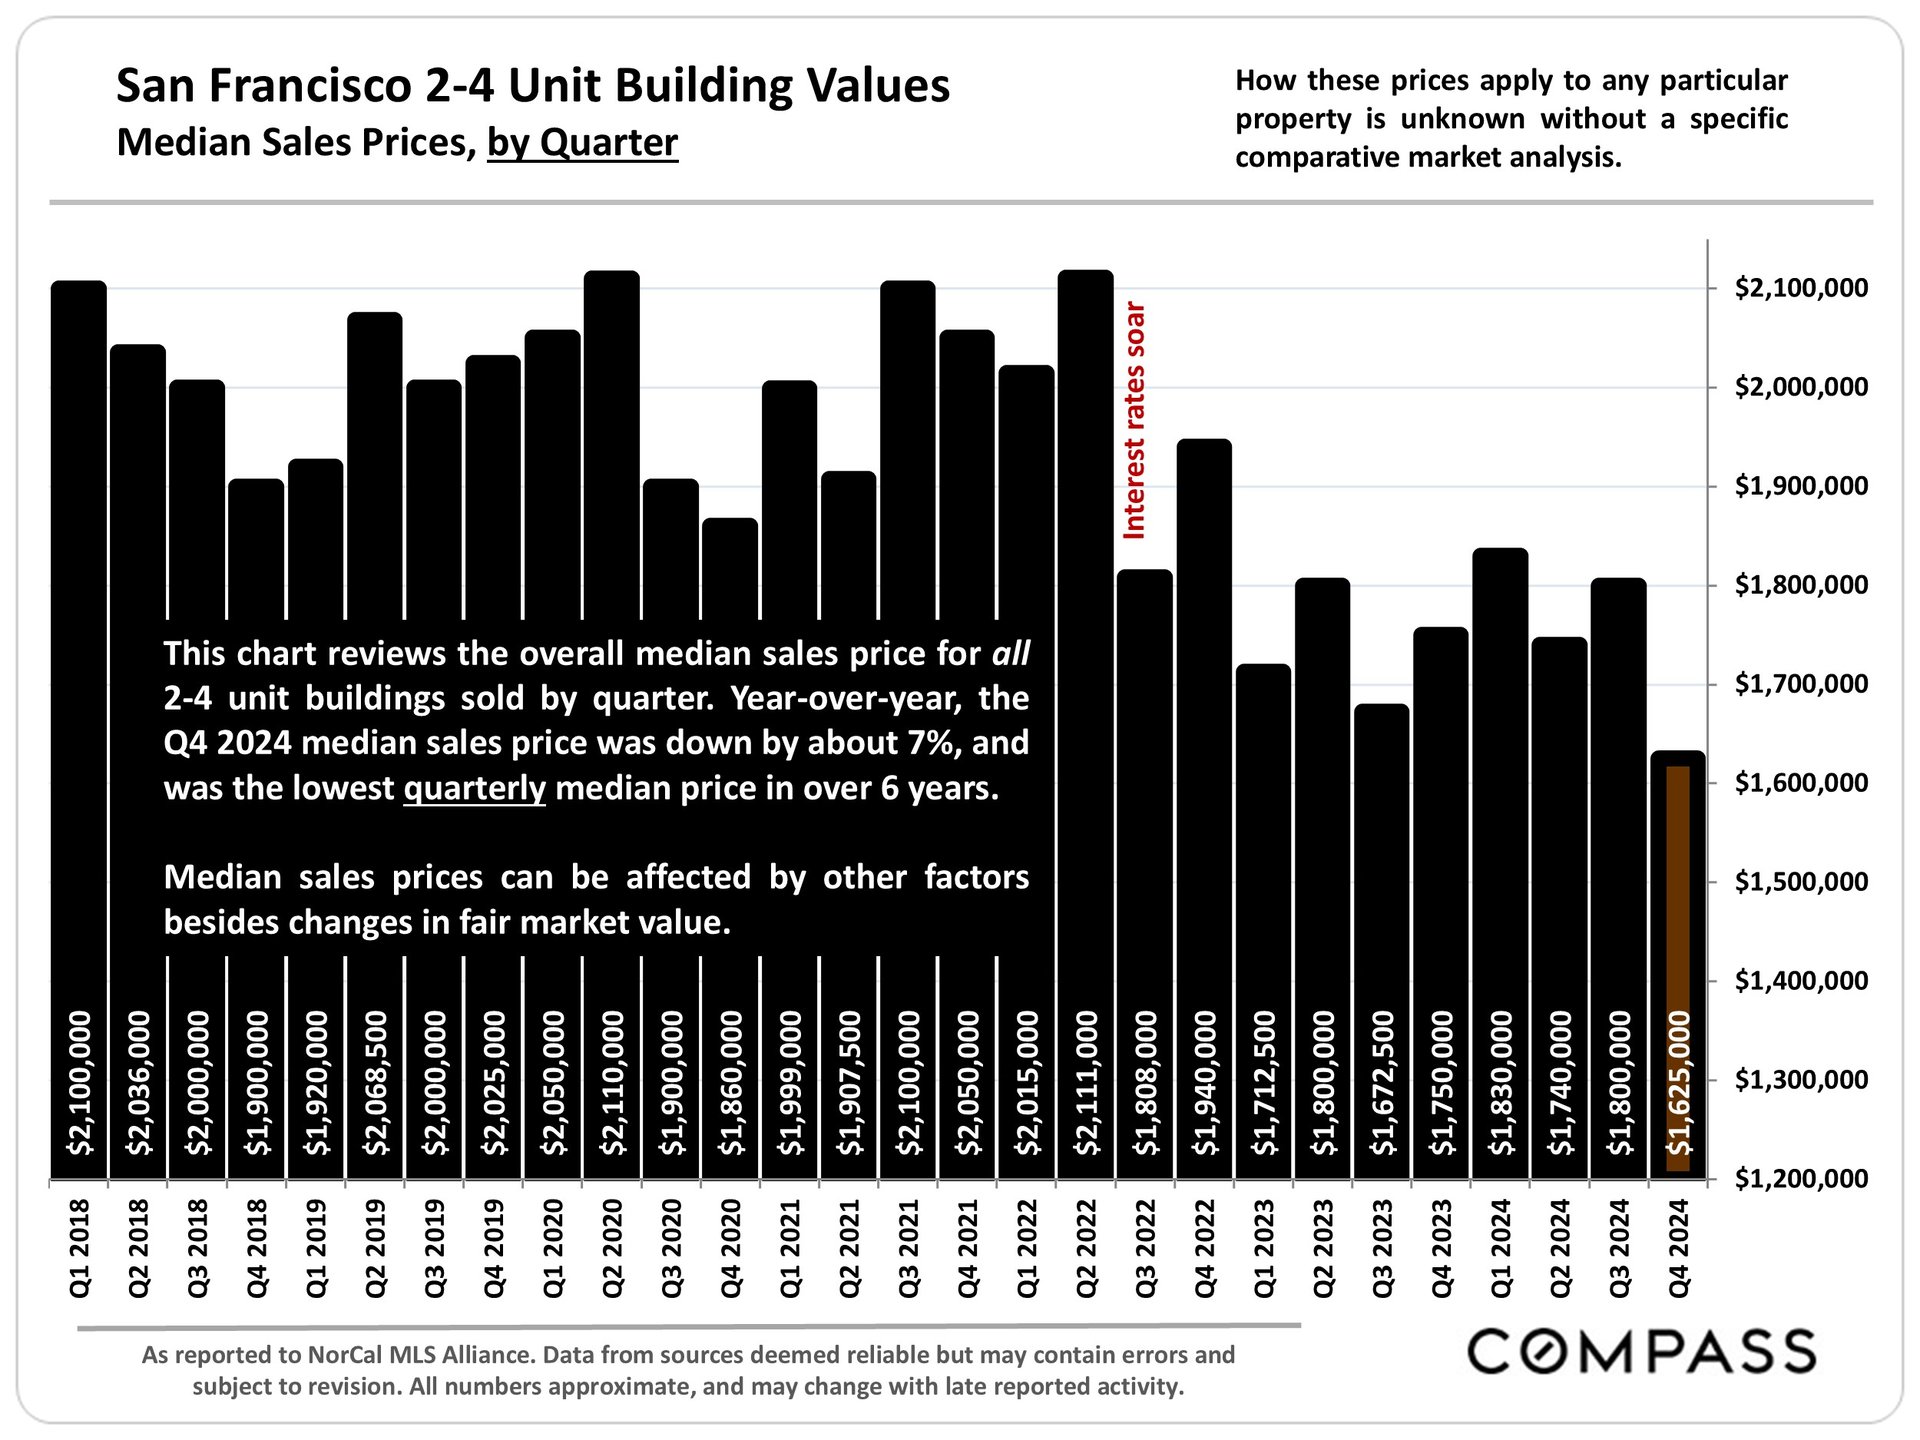
Chart of San Francisco 2–4 unit building median sale prices by quarter, 2018–2024; Q4 2024 is $1,625,000.

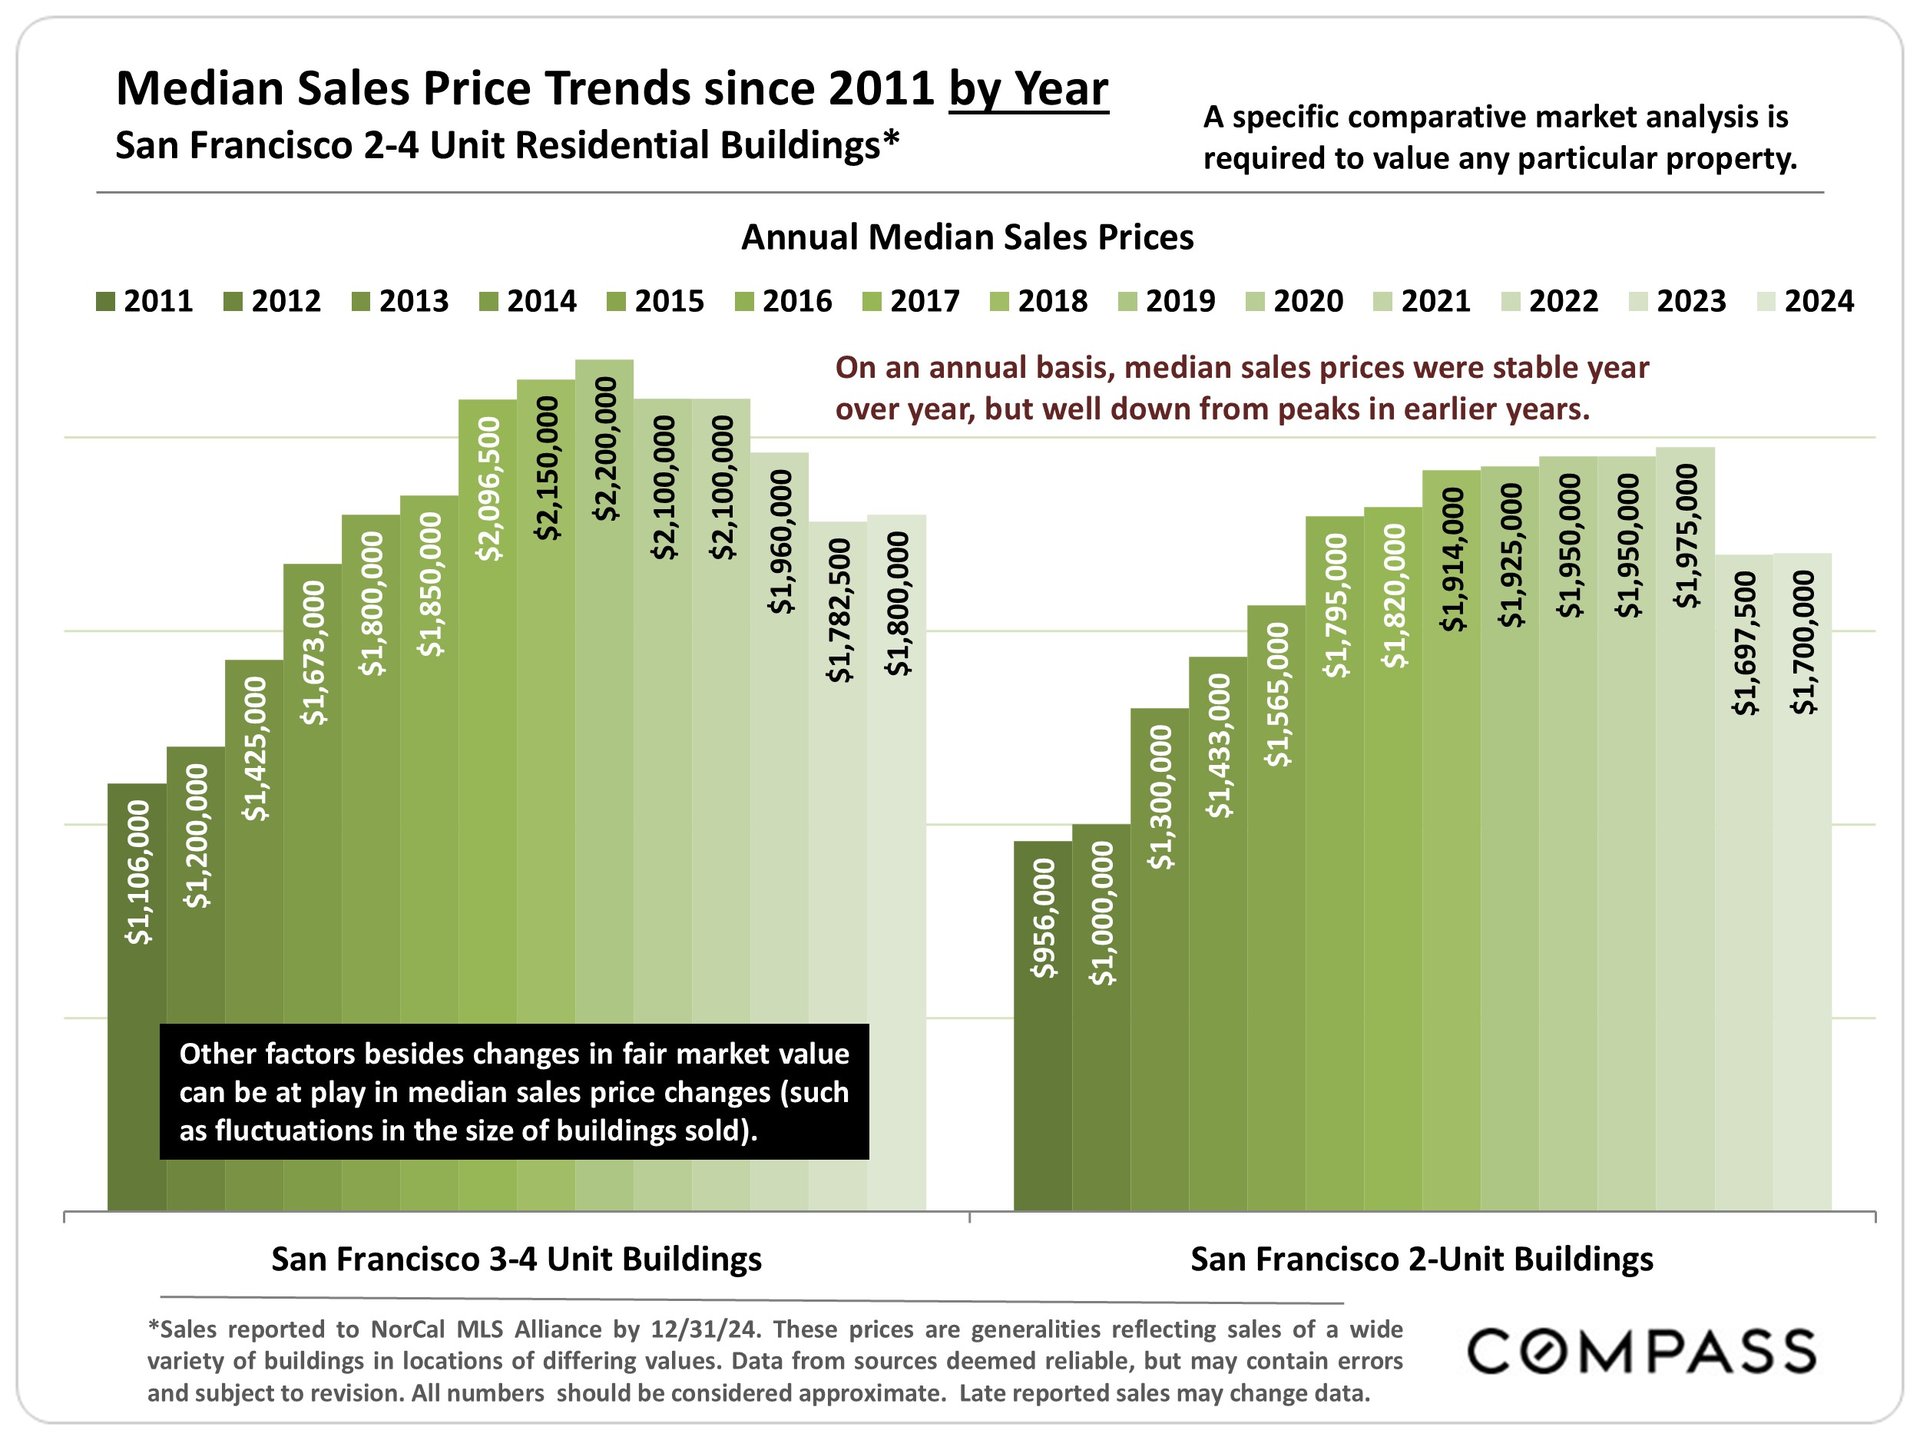
Chart comparing annual median sales prices for San Francisco 2-unit and 3–4-unit buildings, 2011–2024.

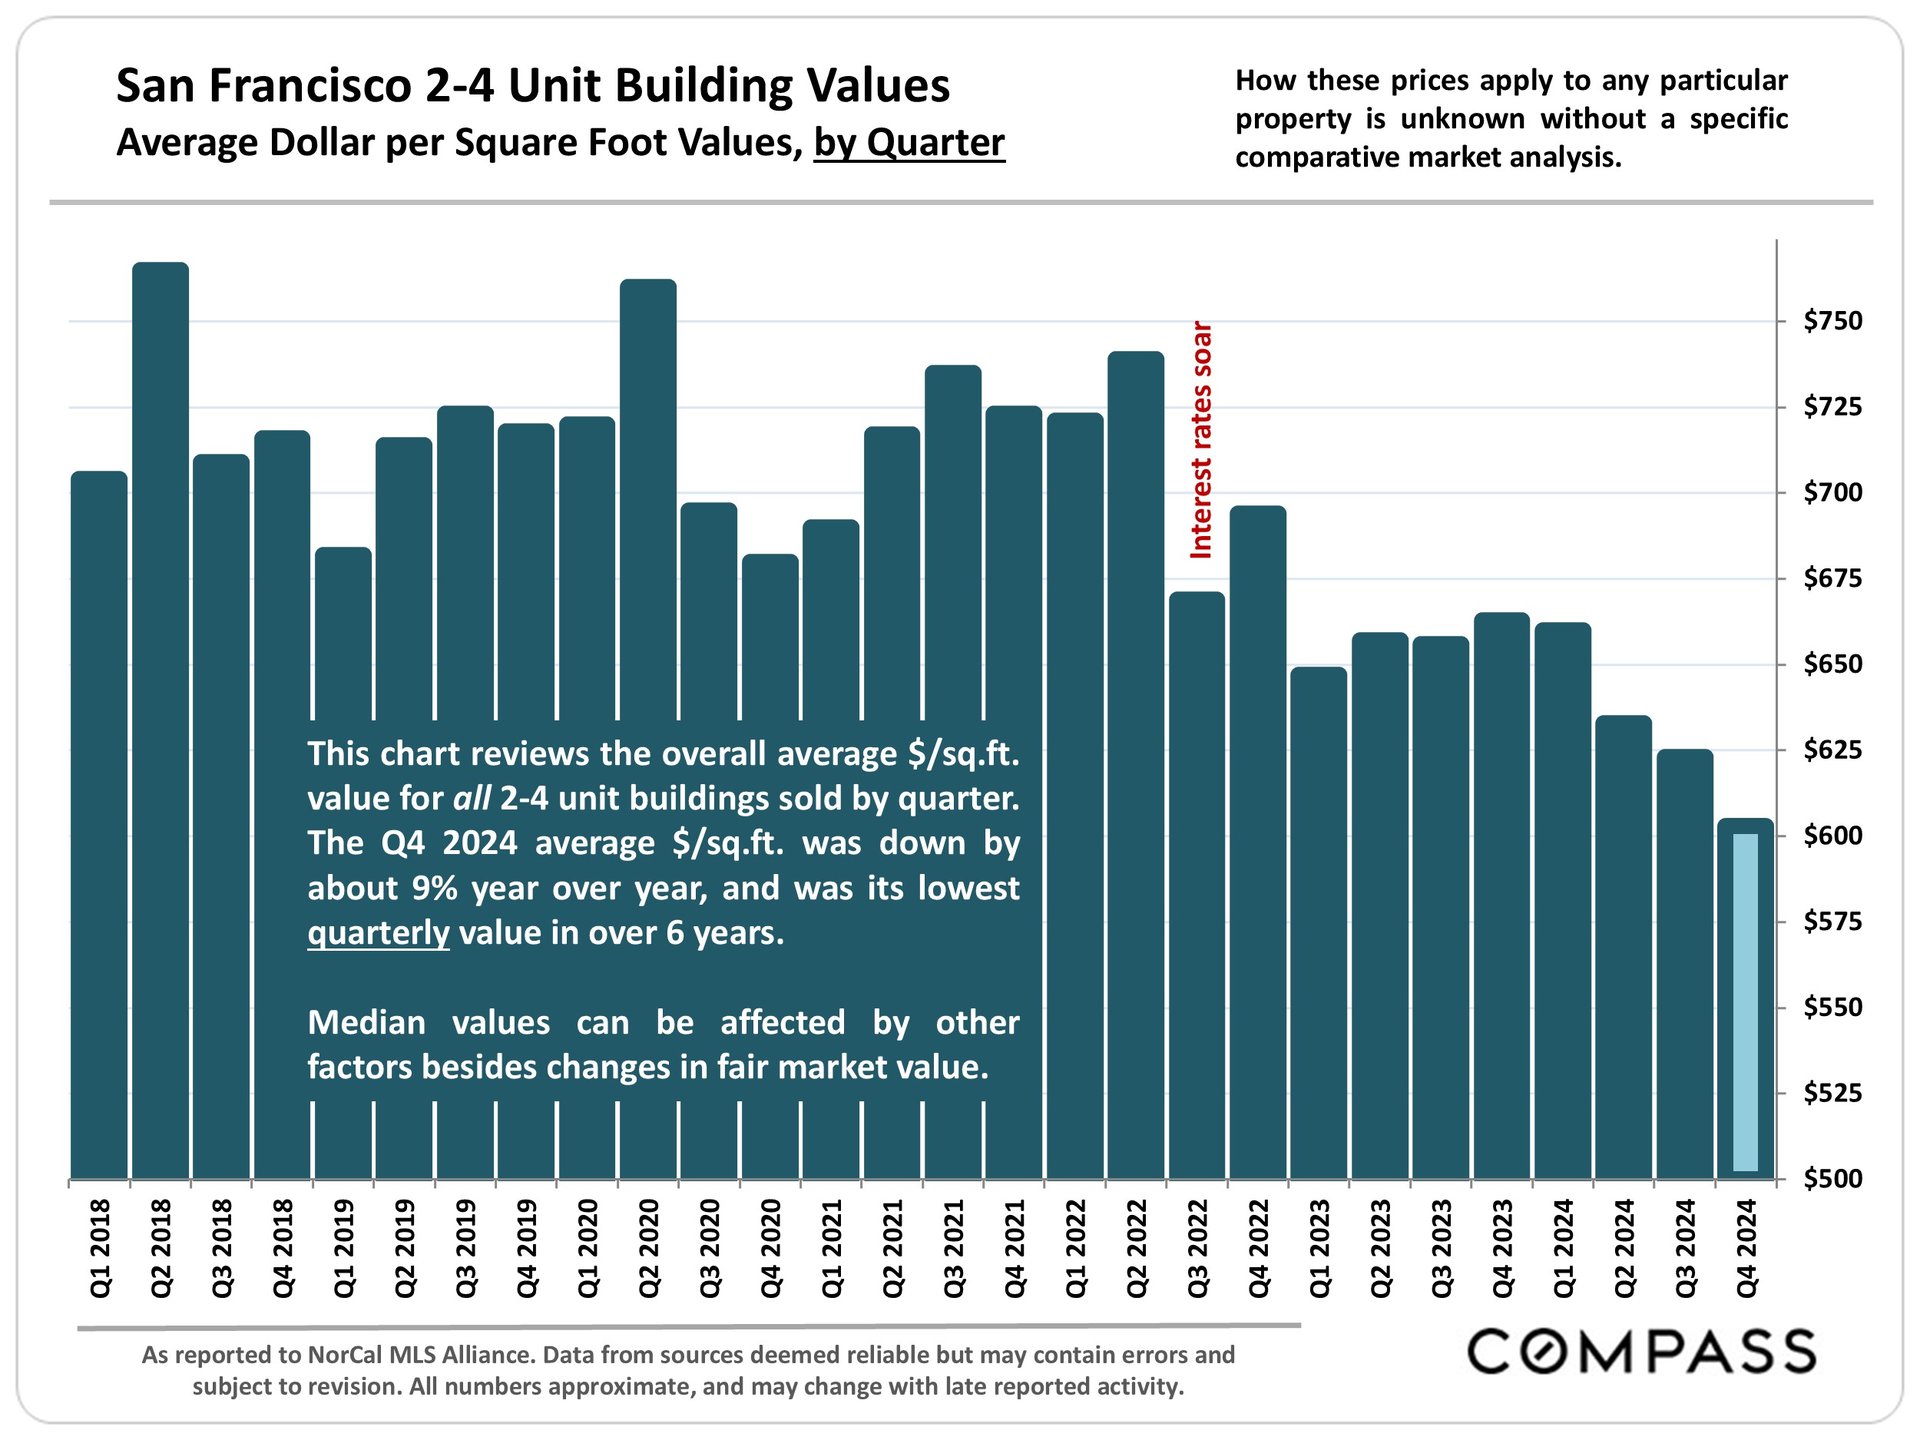
Chart of San Francisco 2–4 unit building values per square foot by quarter, 2018–2024, with Q4 2024 at a six-year low.

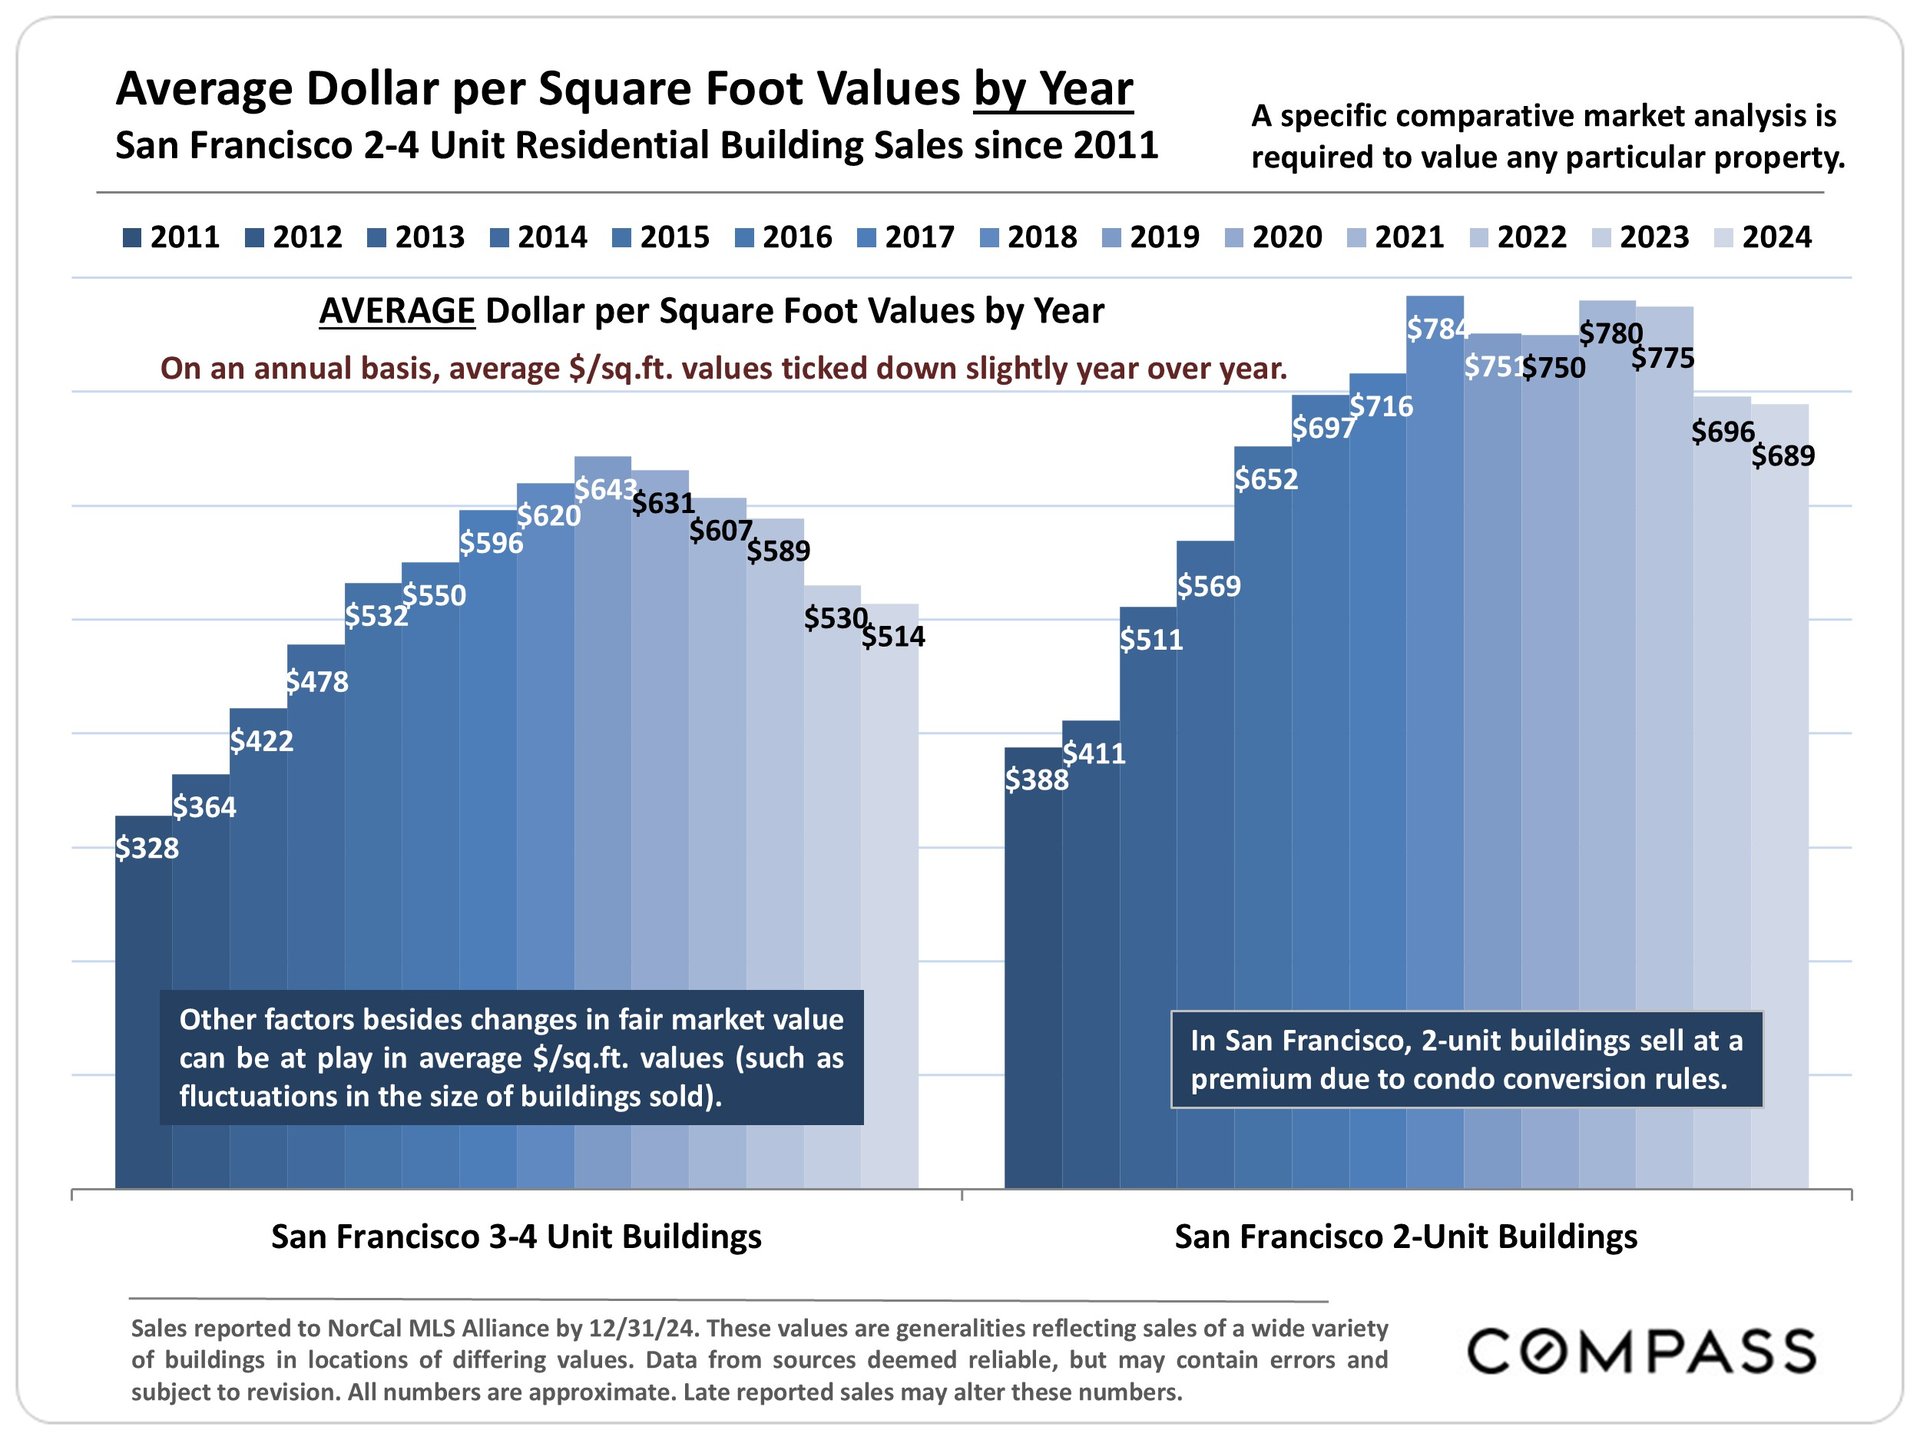
Chart comparing annual per-square-foot sale values for San Francisco 2-unit and 3–4-unit buildings, 2011–2024.

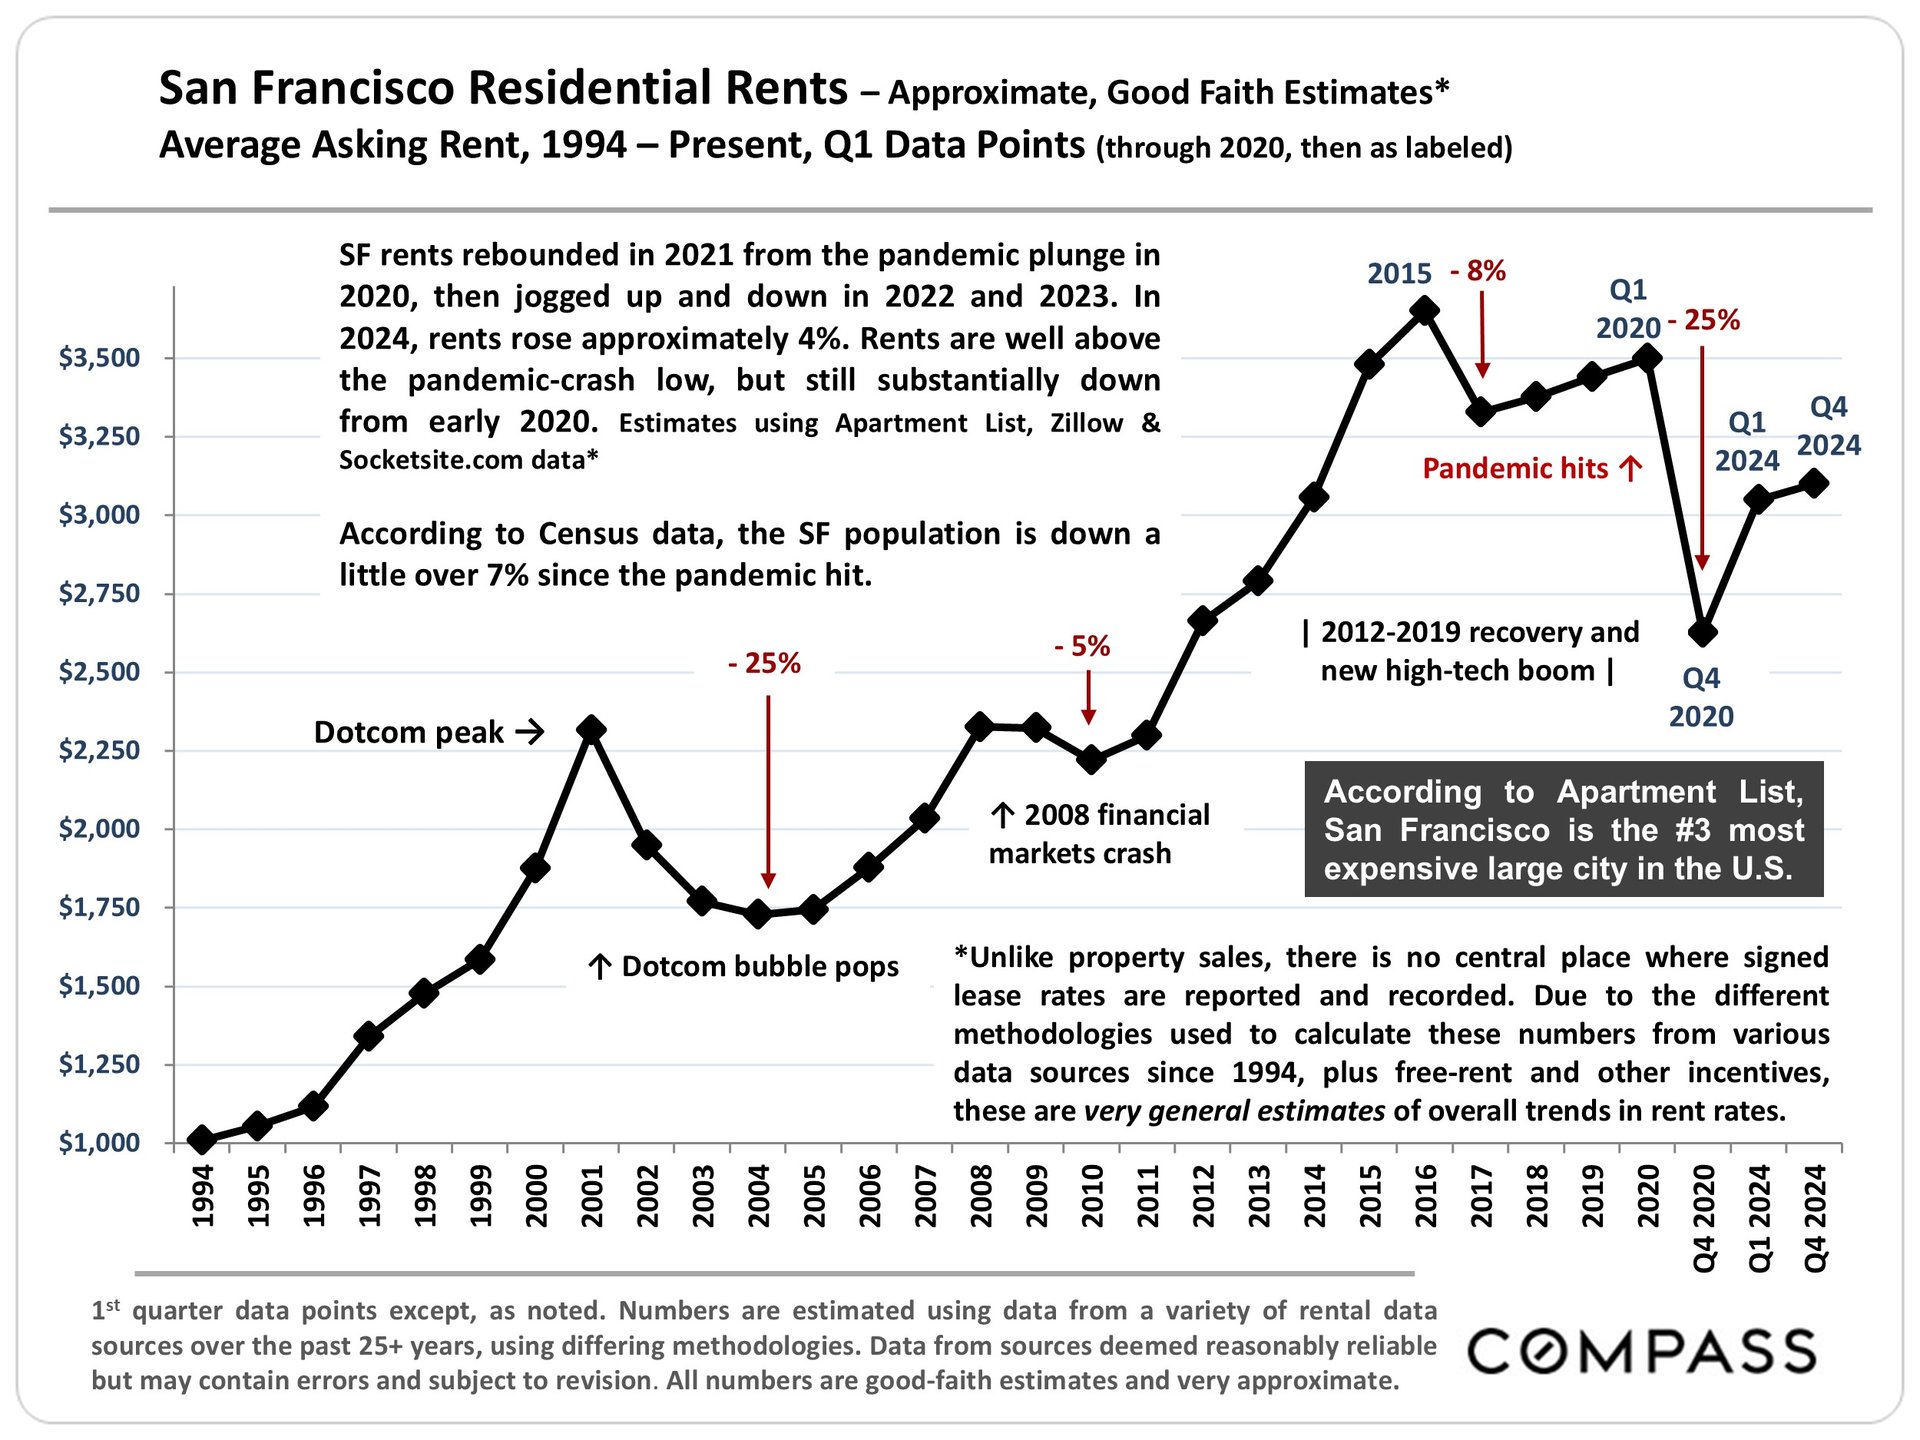
San Francisco average asking rent chart, 1994–2024, showing the pandemic decline and partial recovery.

San Francisco residential income market infographic comparing 2- to 8-unit building listings, sales, prices, sizes, and market times.

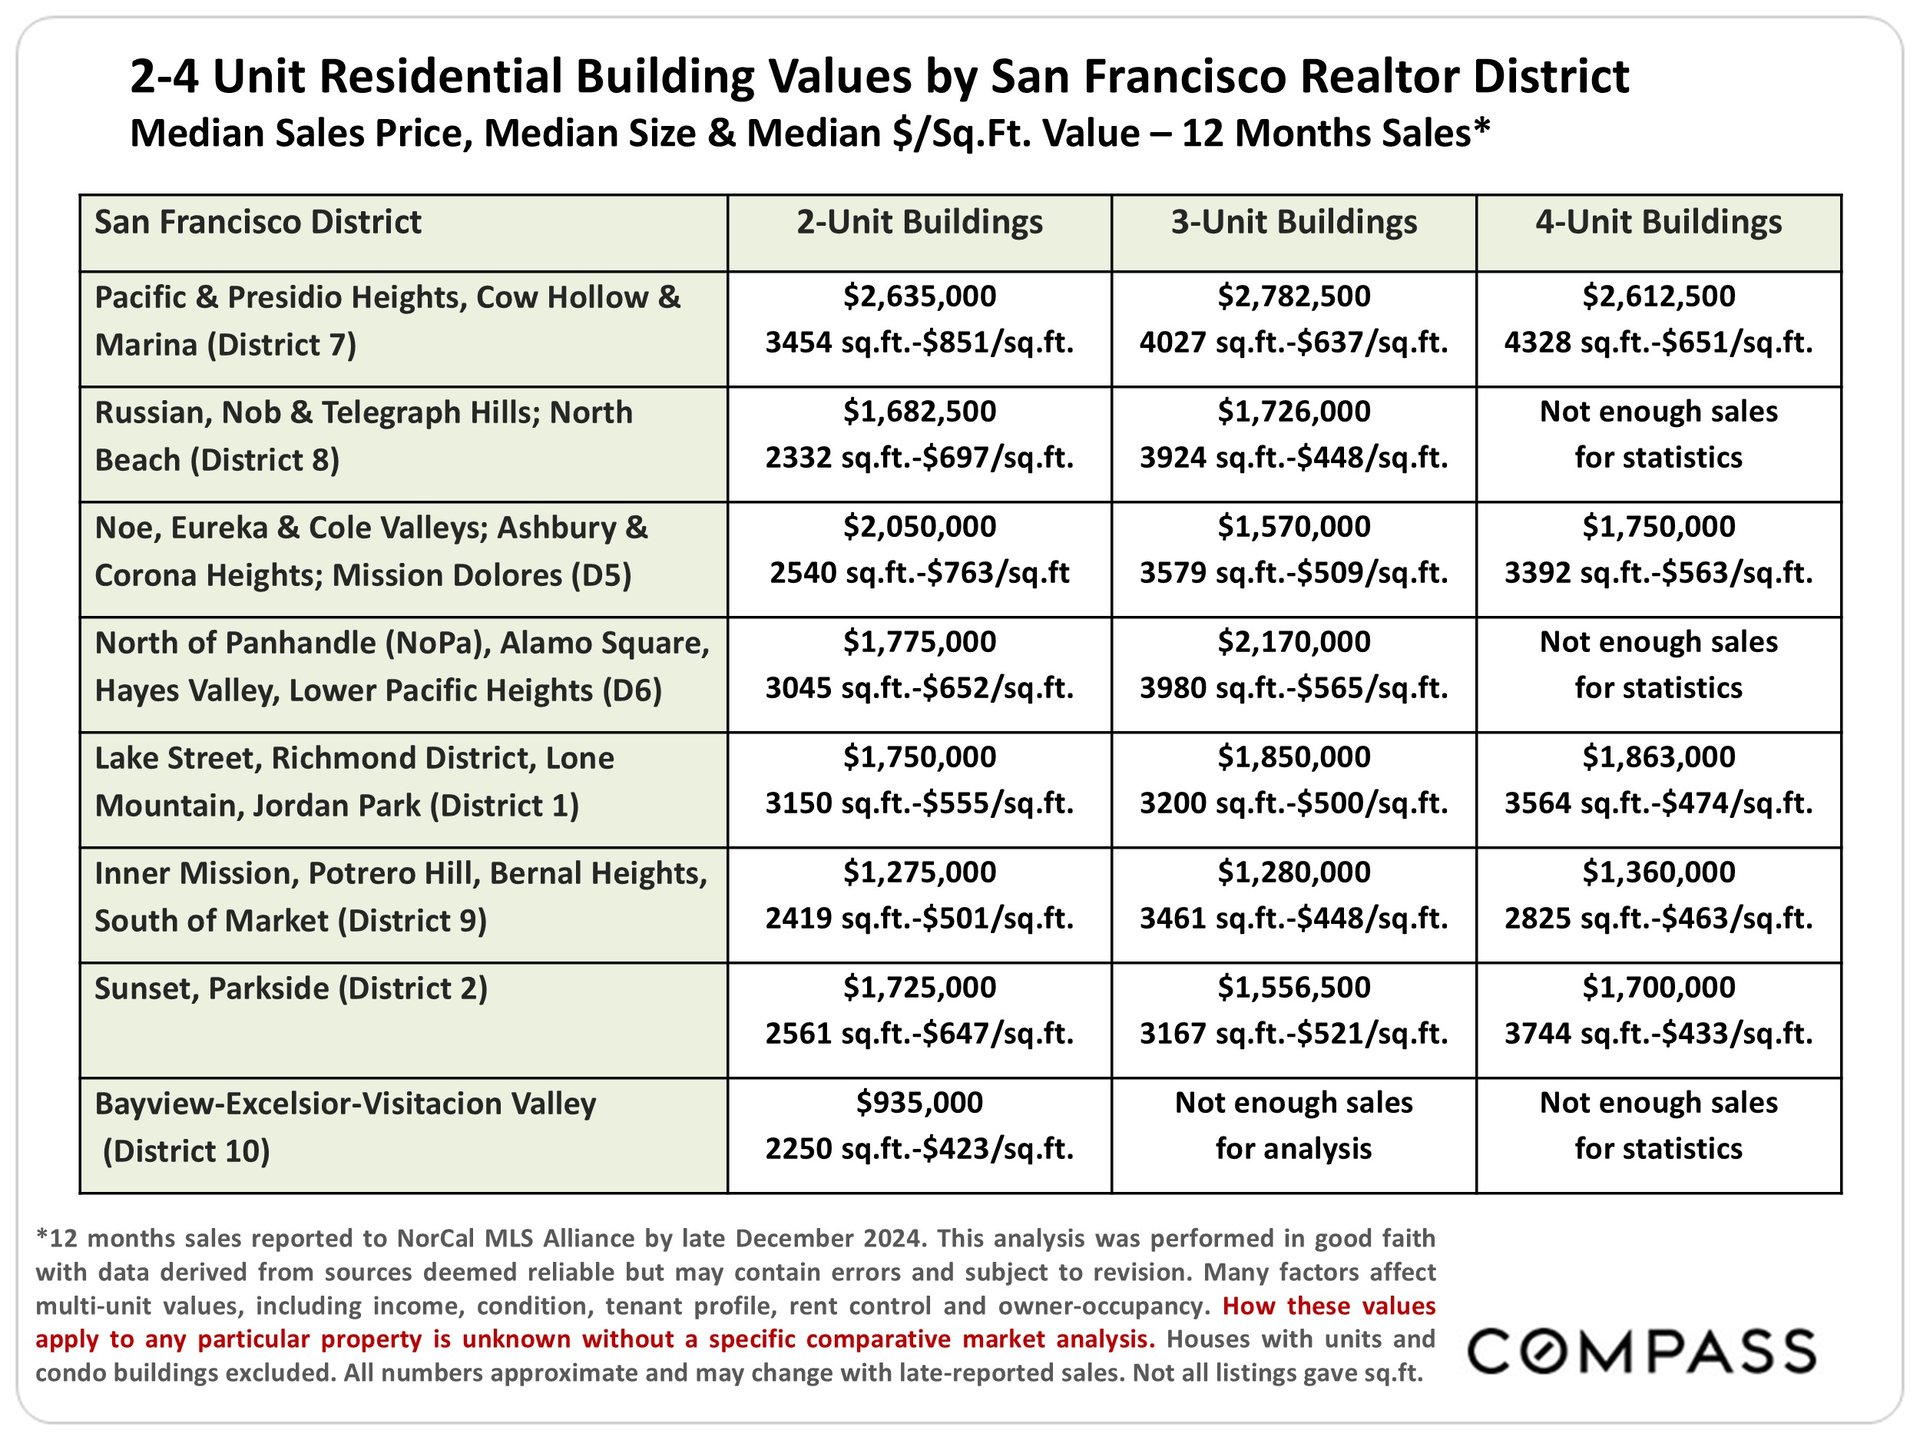
San Francisco 2–4 unit residential building values by district and unit count.

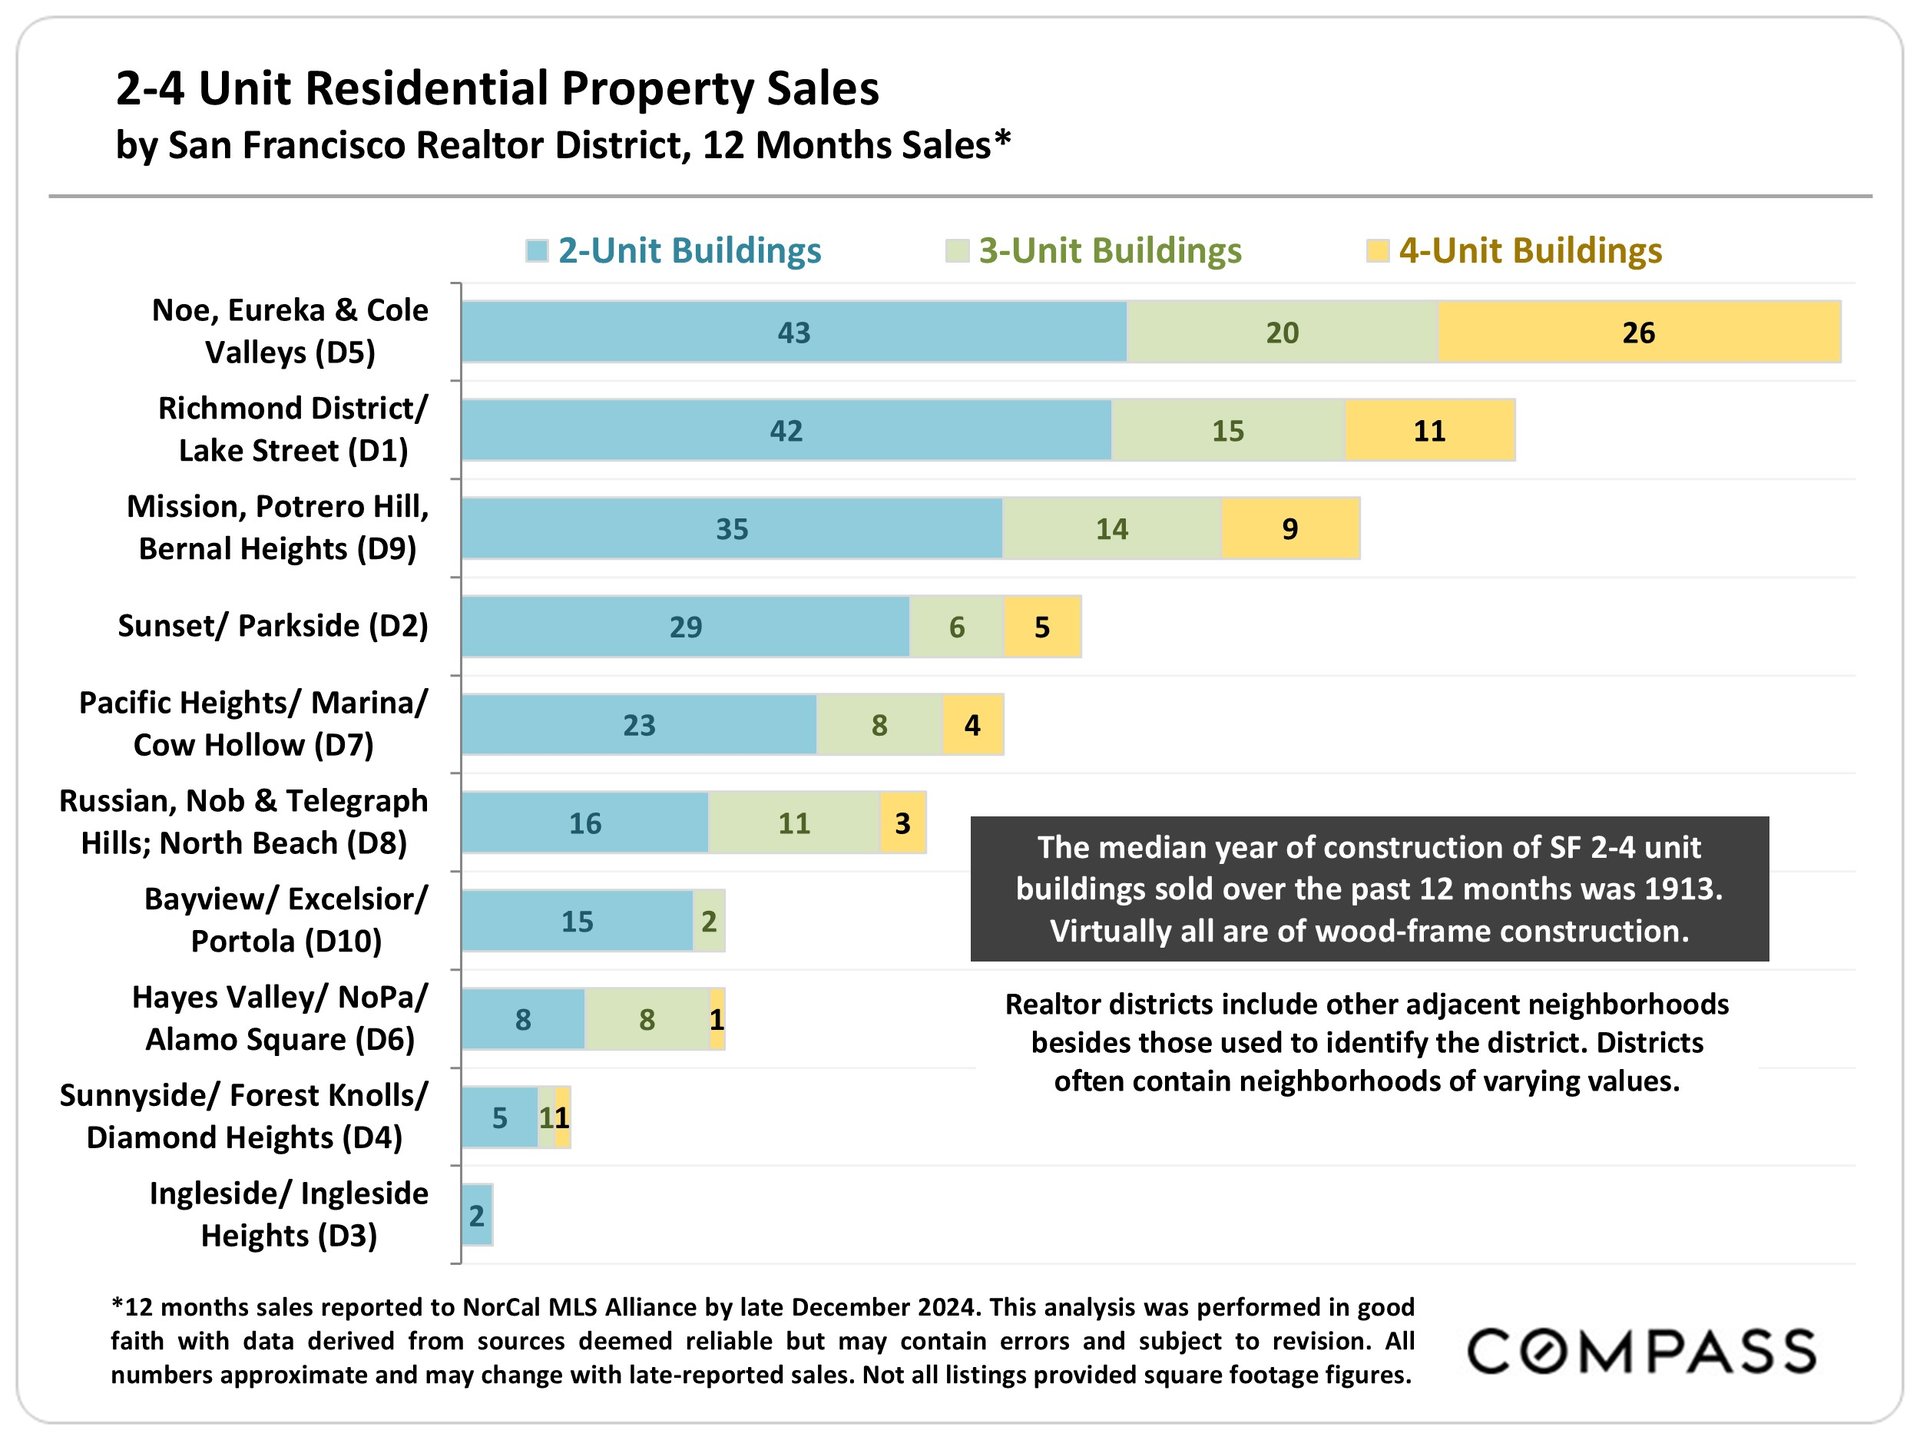
Chart comparing 2-, 3-, and 4-unit building sales across San Francisco Realtor districts; Noe, Eureka & Cole Valleys leads.

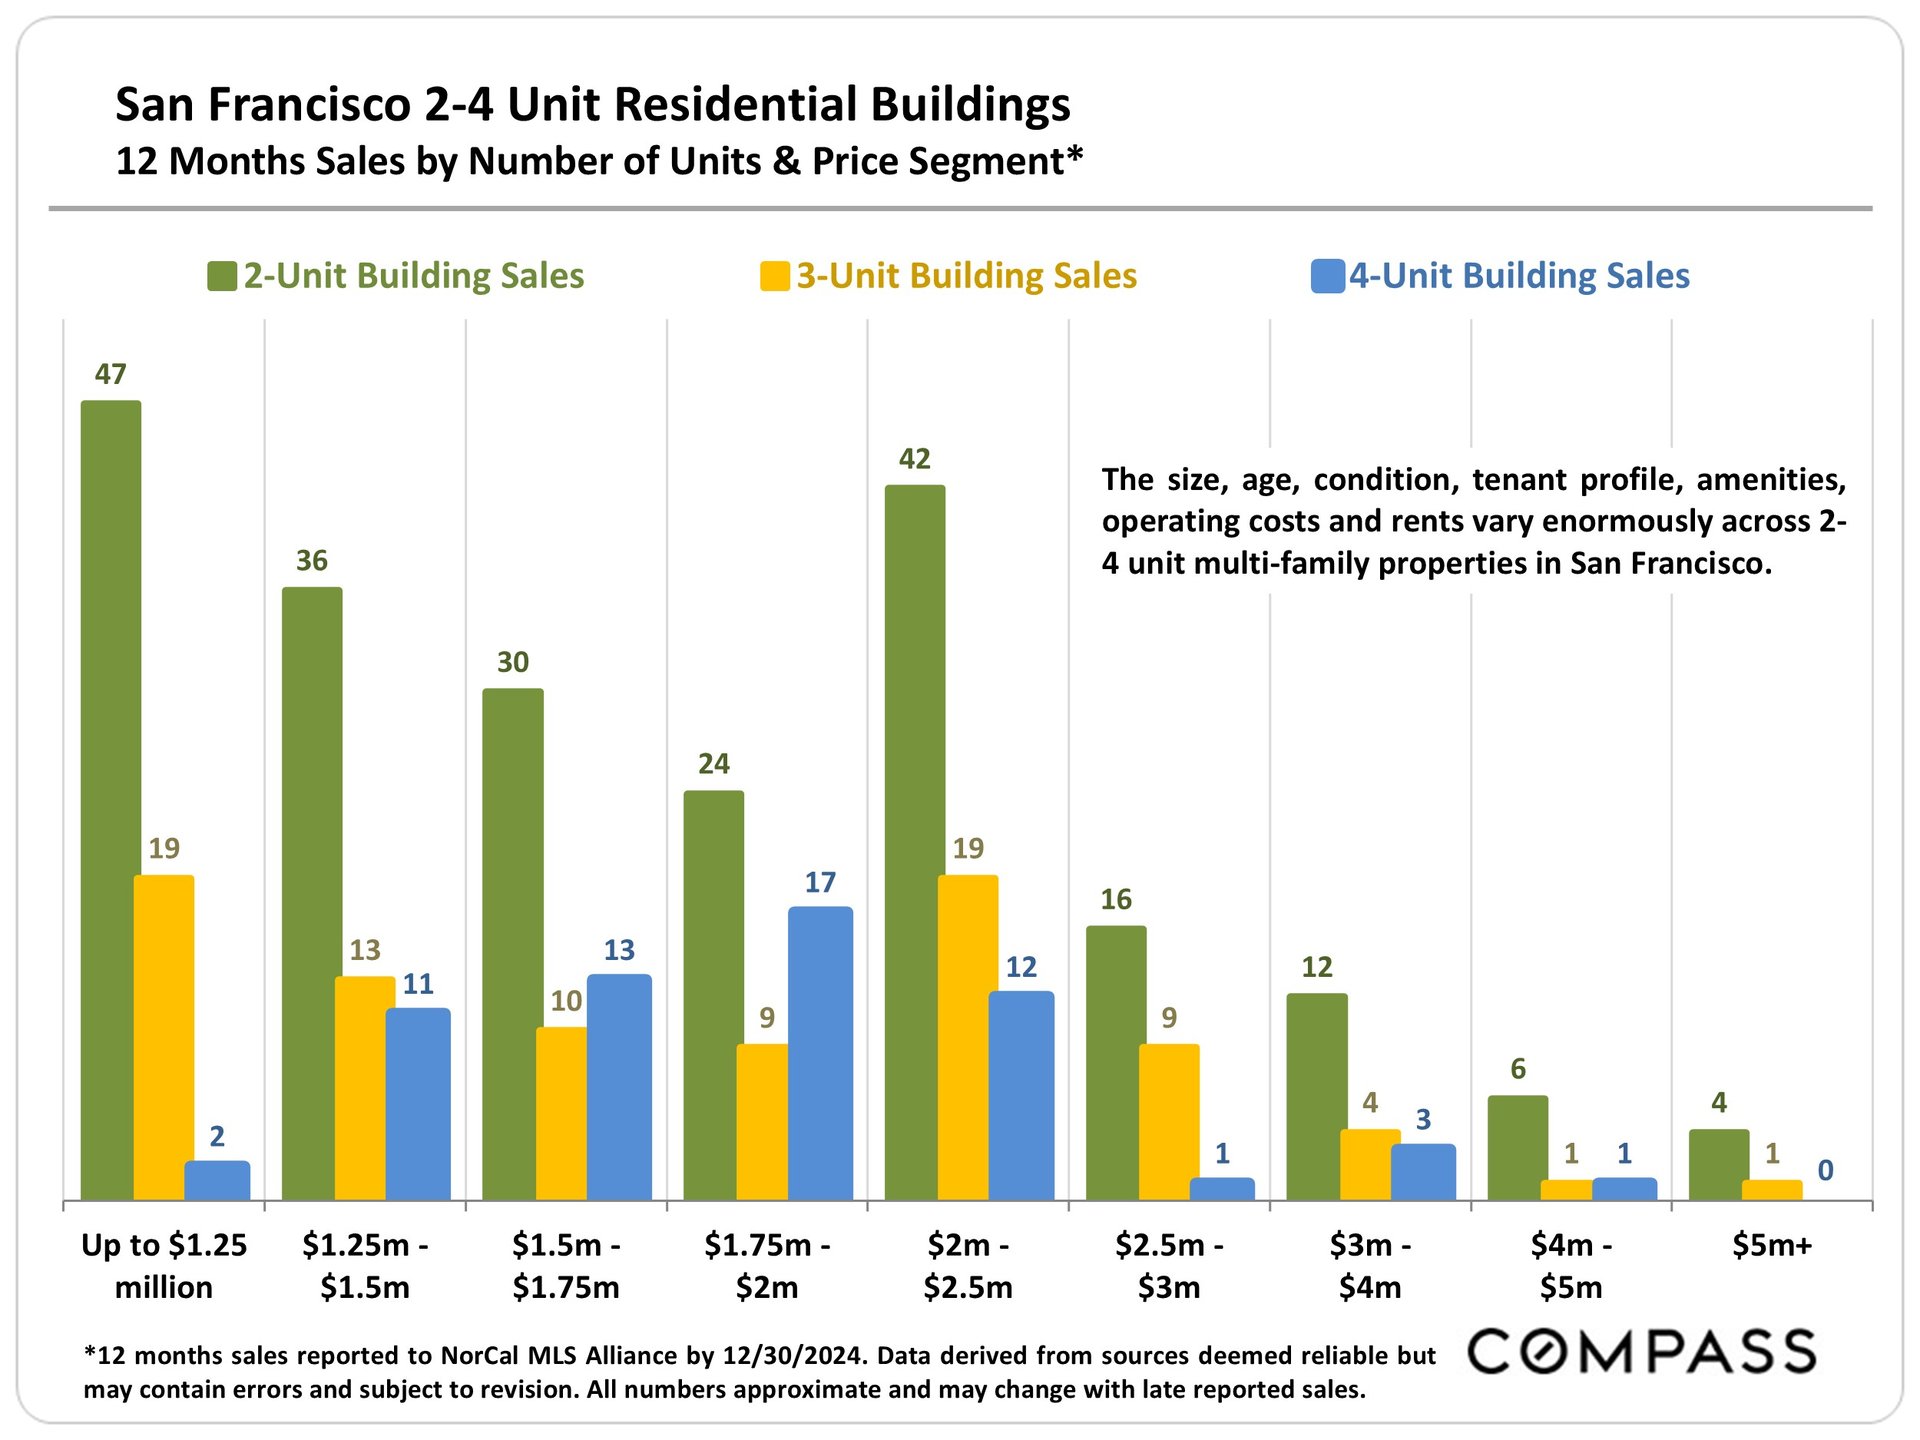
Chart comparing San Francisco two-, three-, and four-unit building sales across price ranges.

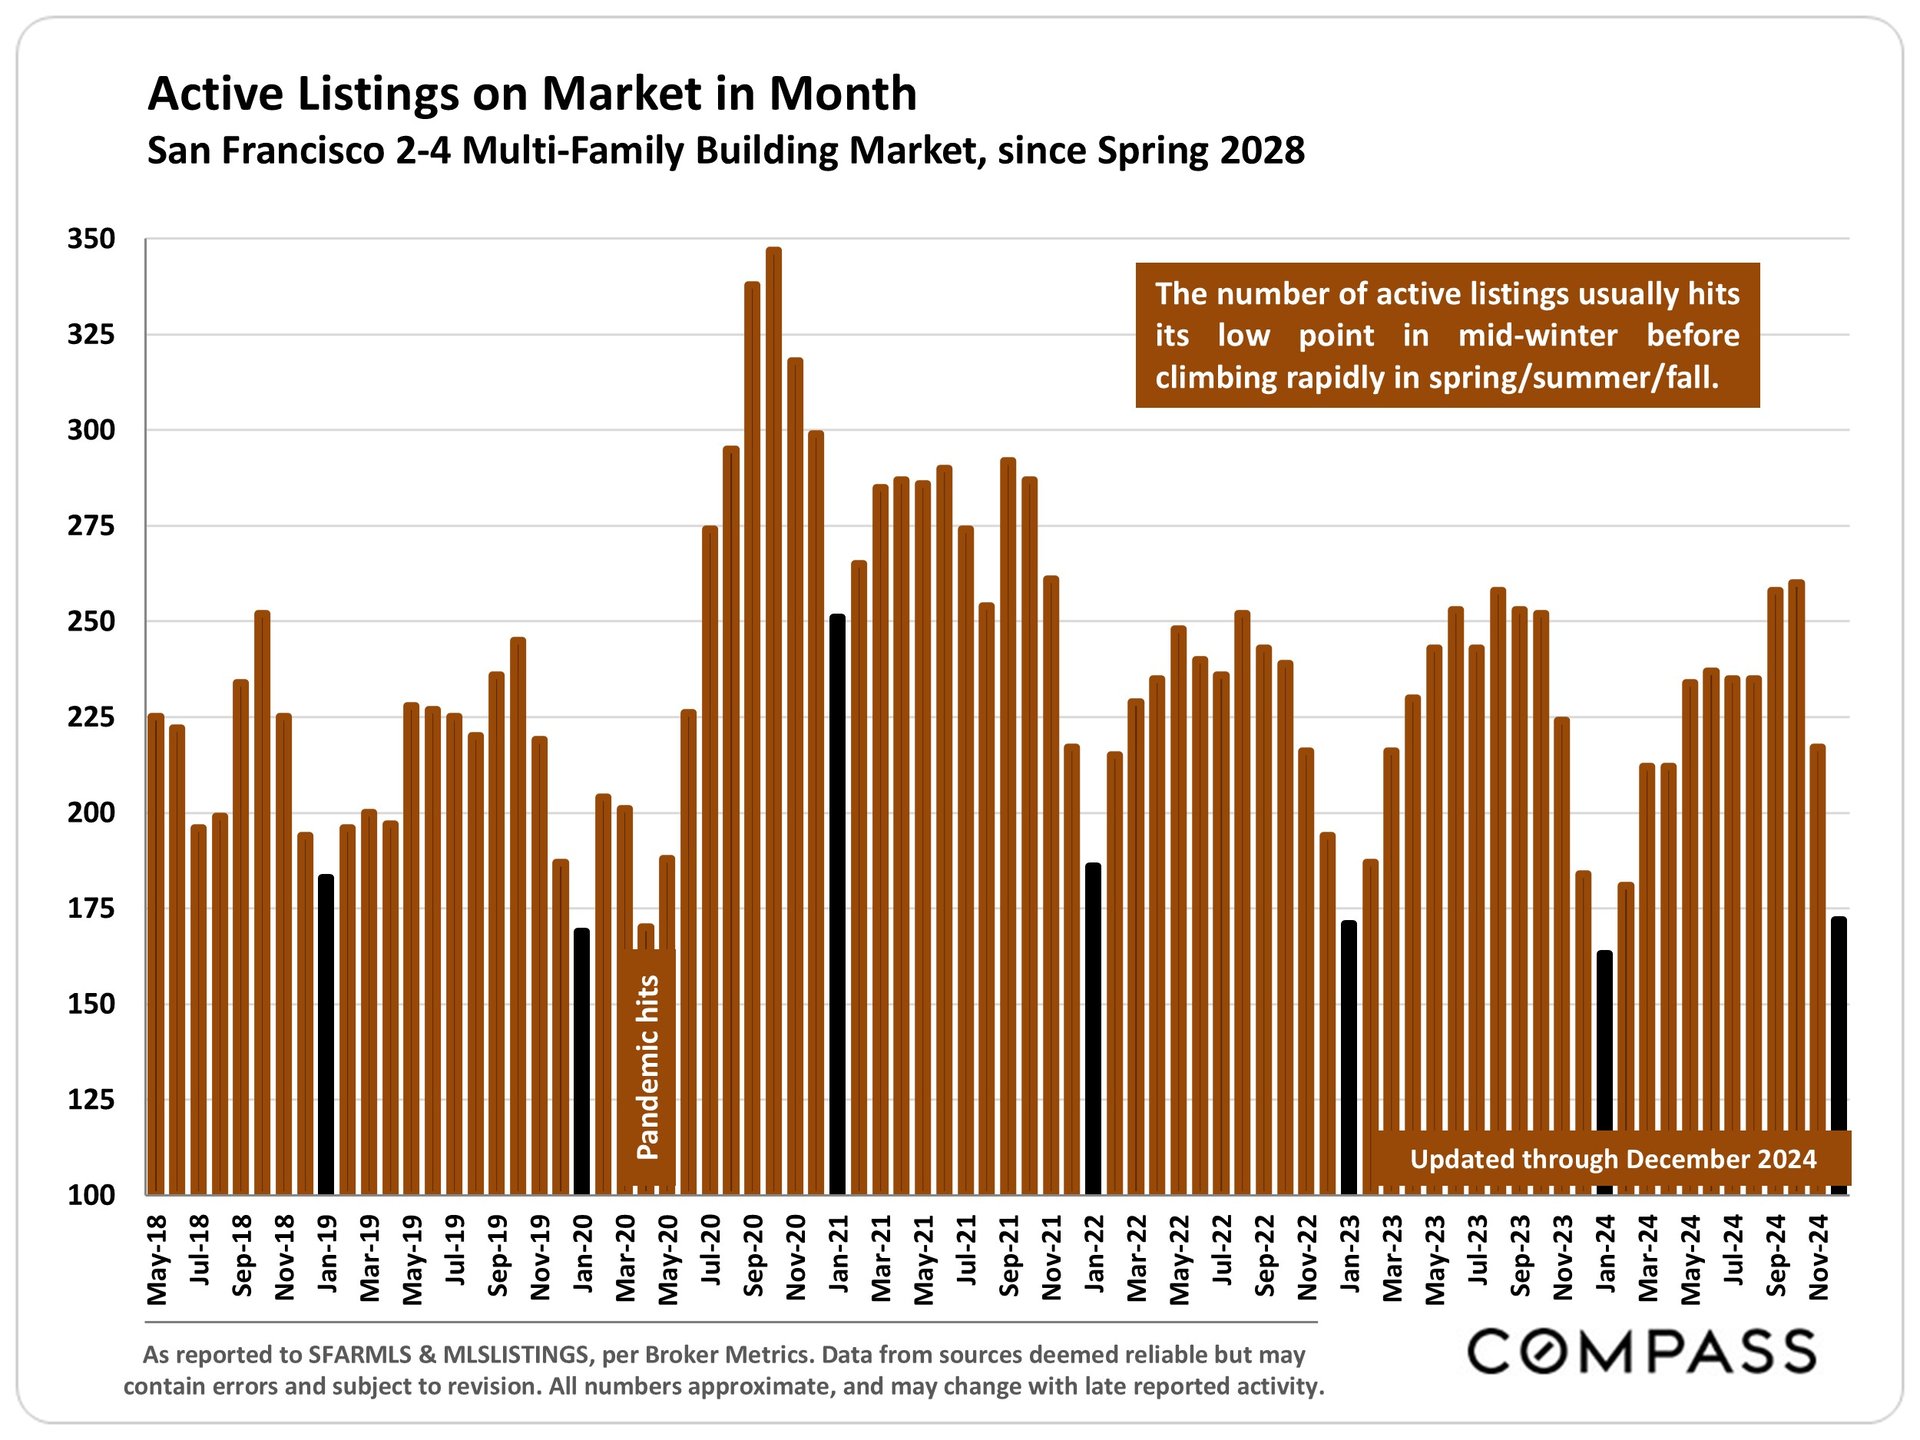
Chart of monthly active listings for San Francisco 2–4 unit buildings, May 2018–November 2024, with seasonal trends.

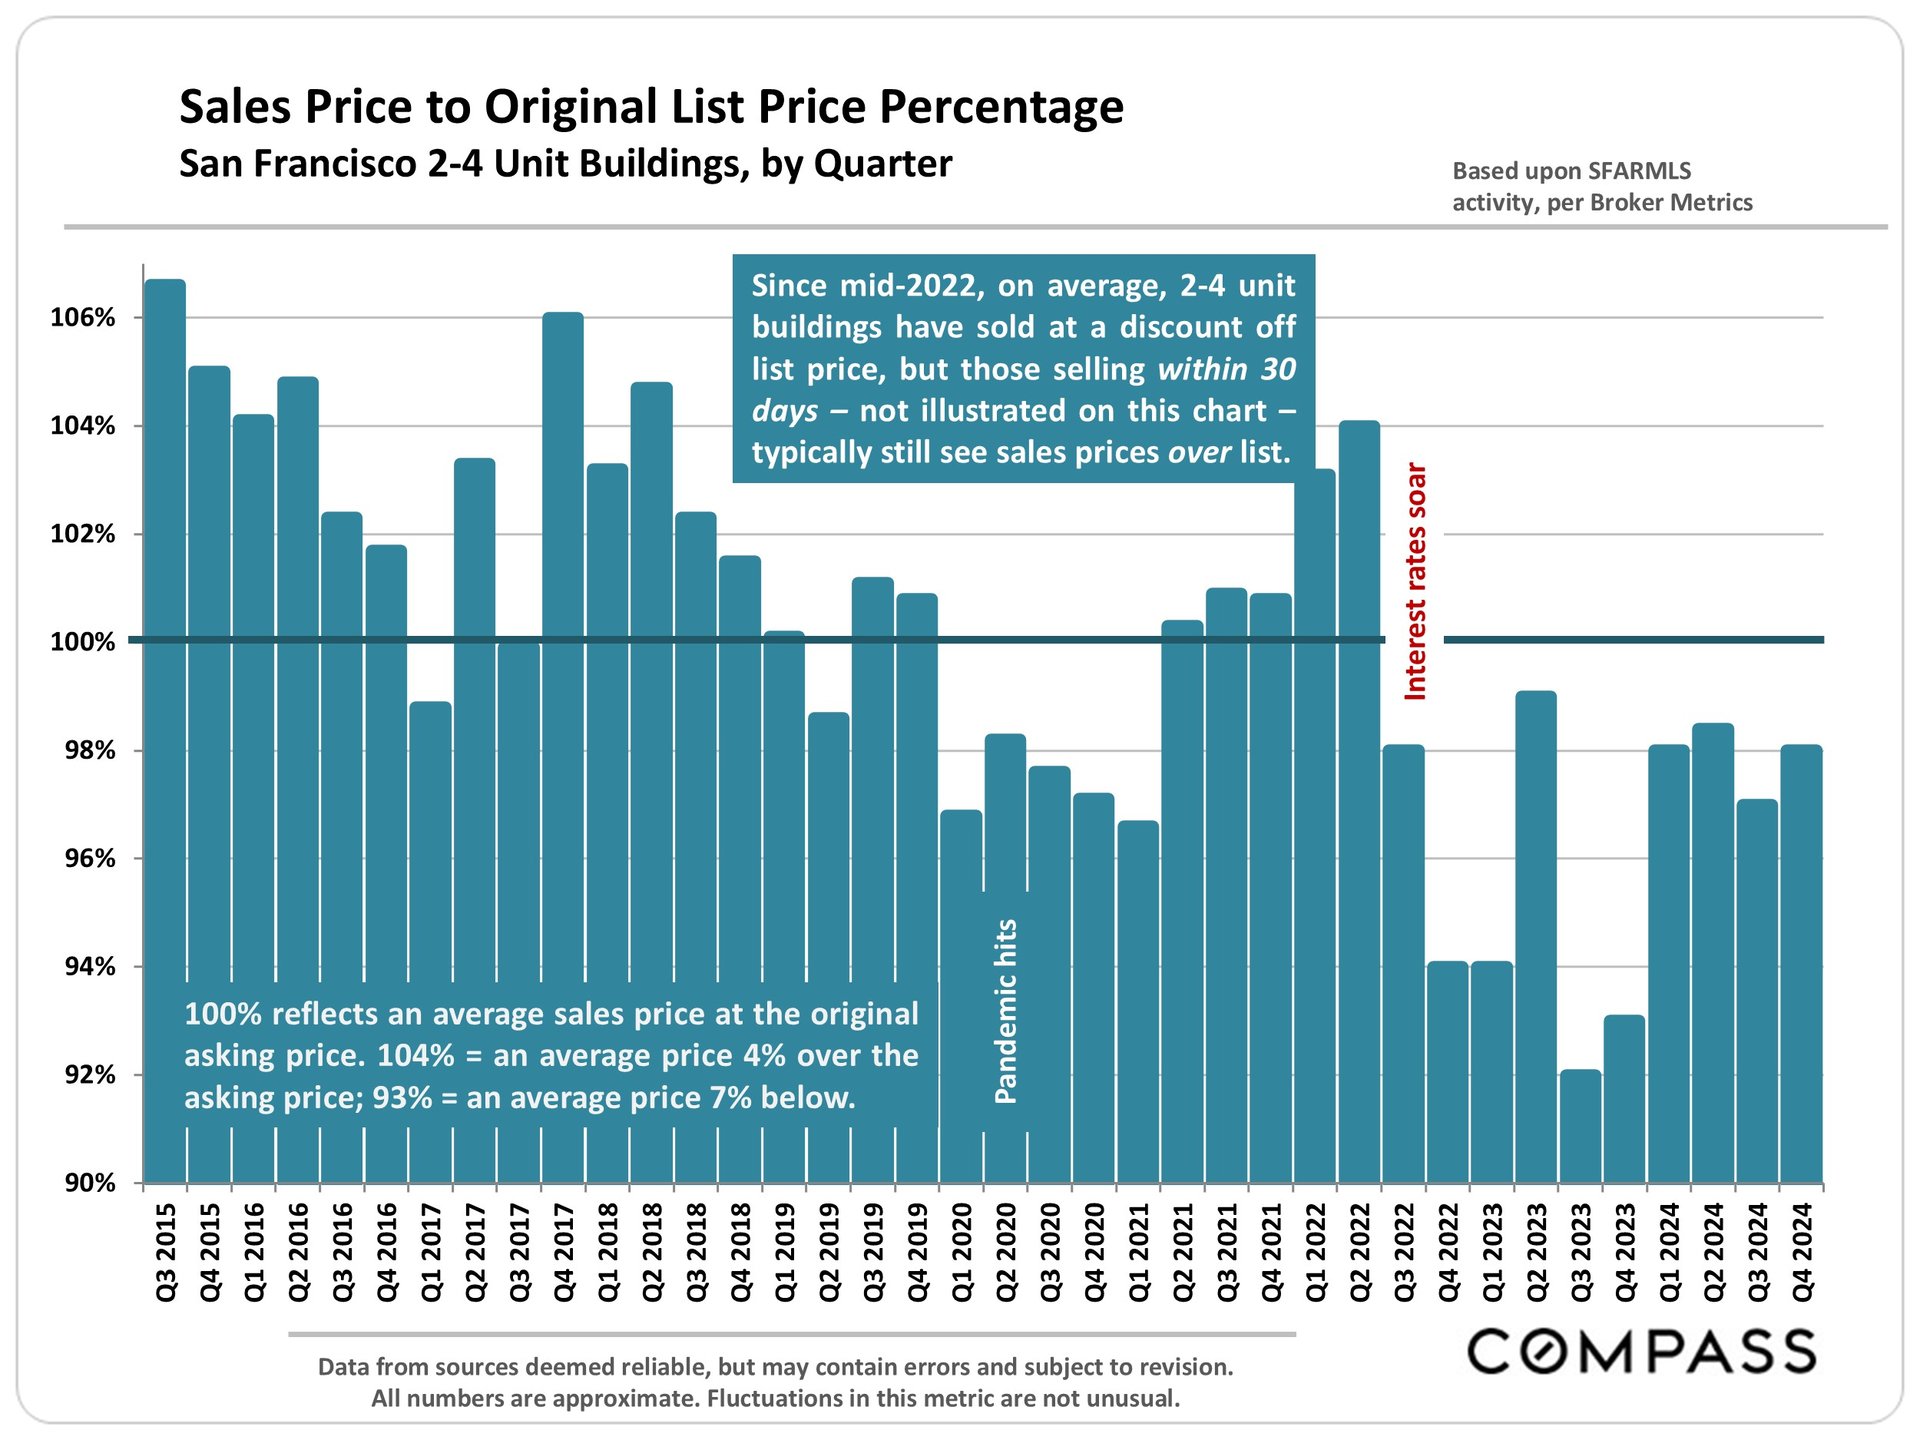
Chart of San Francisco 2–4 unit building sale prices versus original list prices, by quarter from 2015 to 2024.

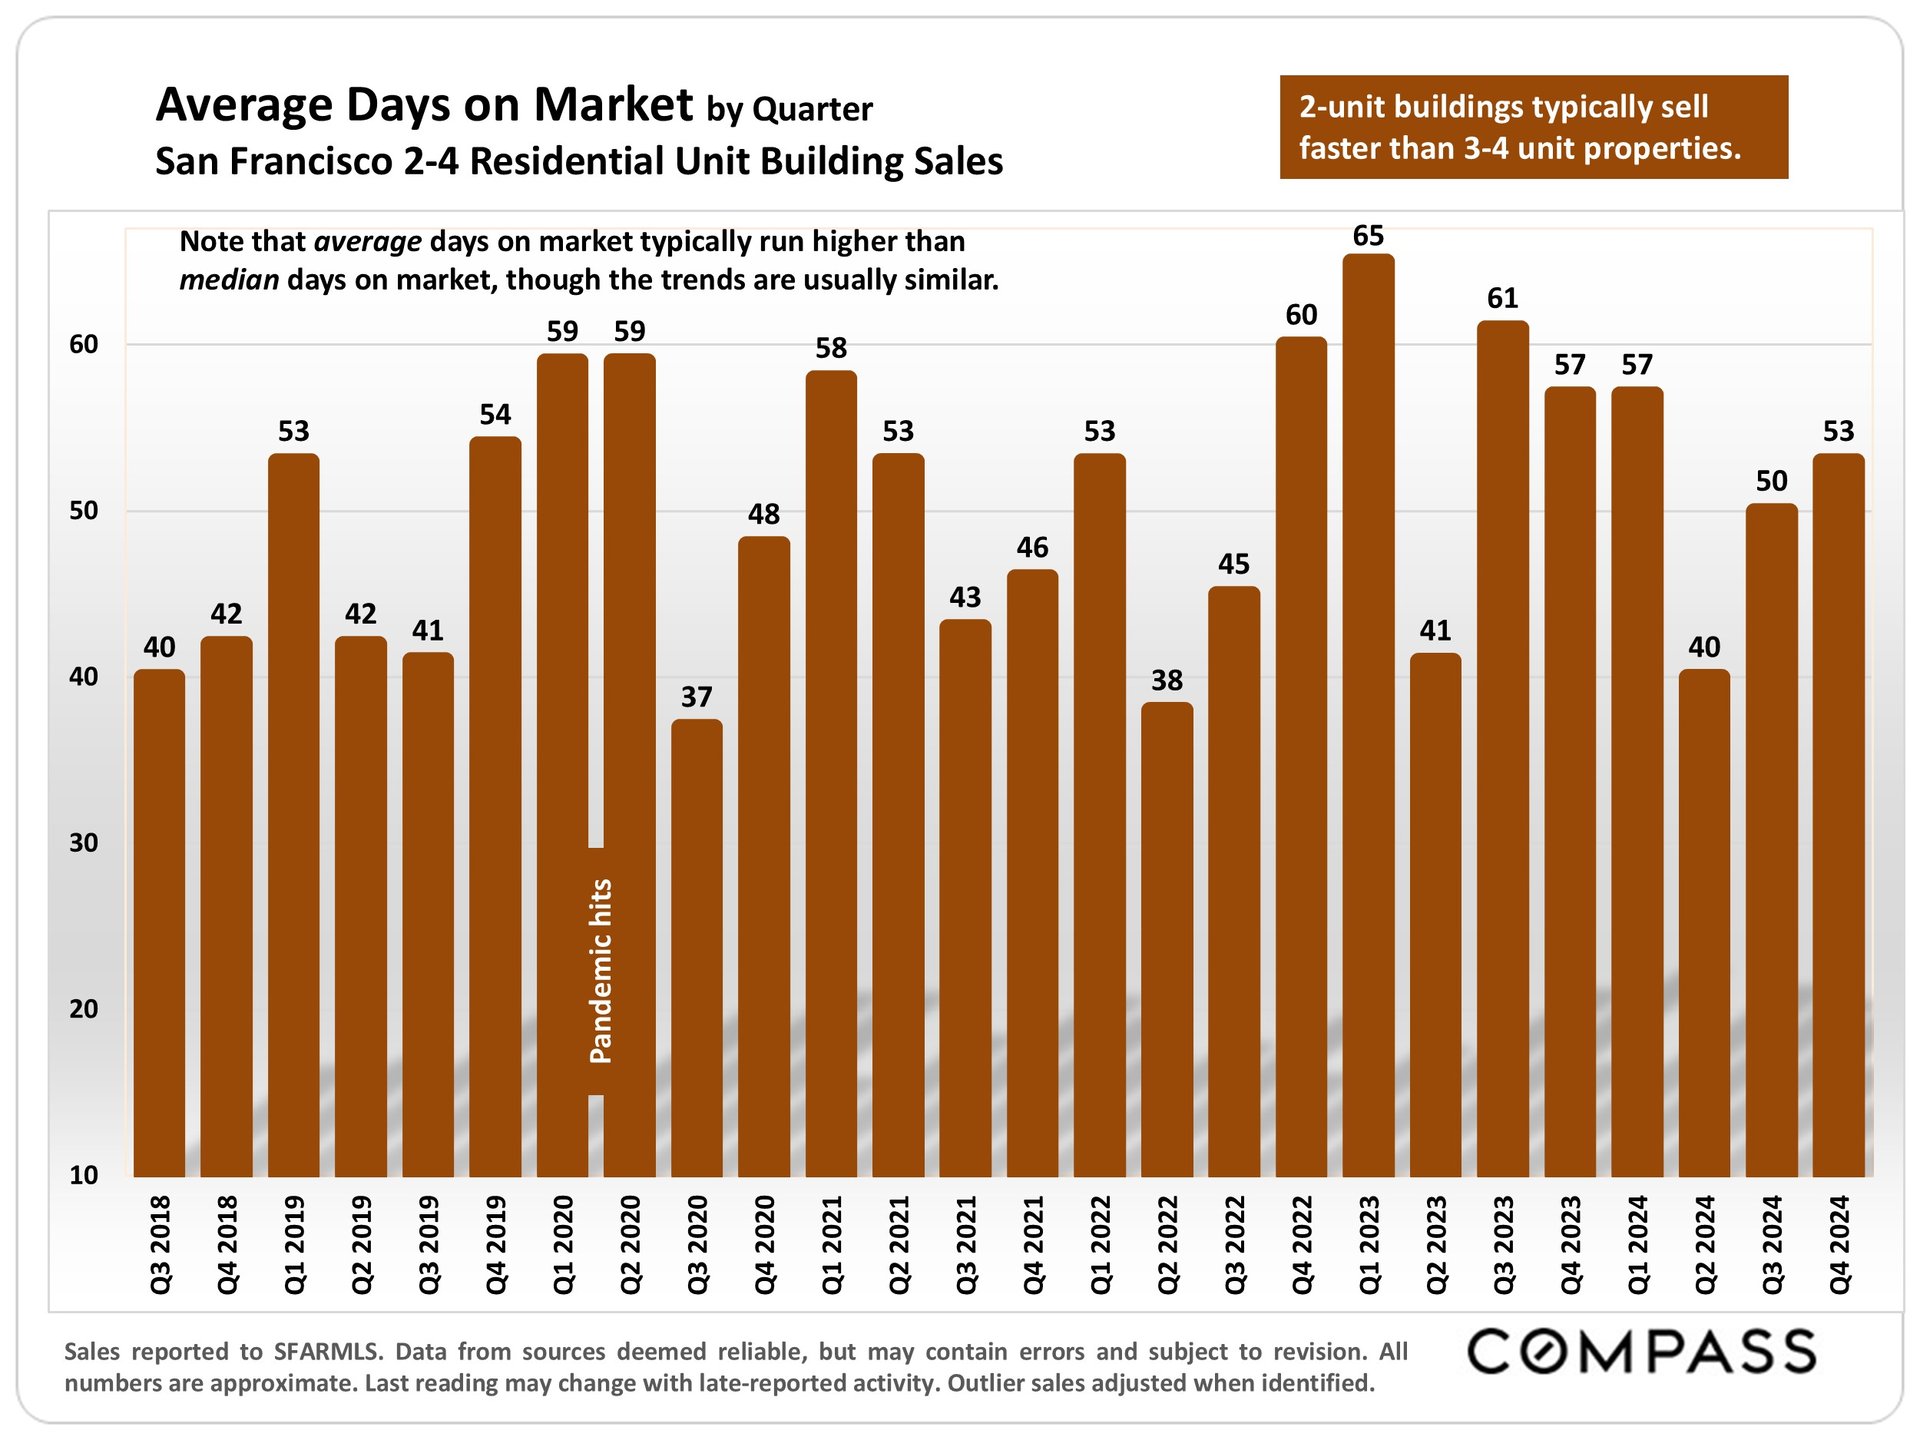
Chart of quarterly days on market for San Francisco 2–4 unit buildings, peaking at 65 days in Q1 2023.

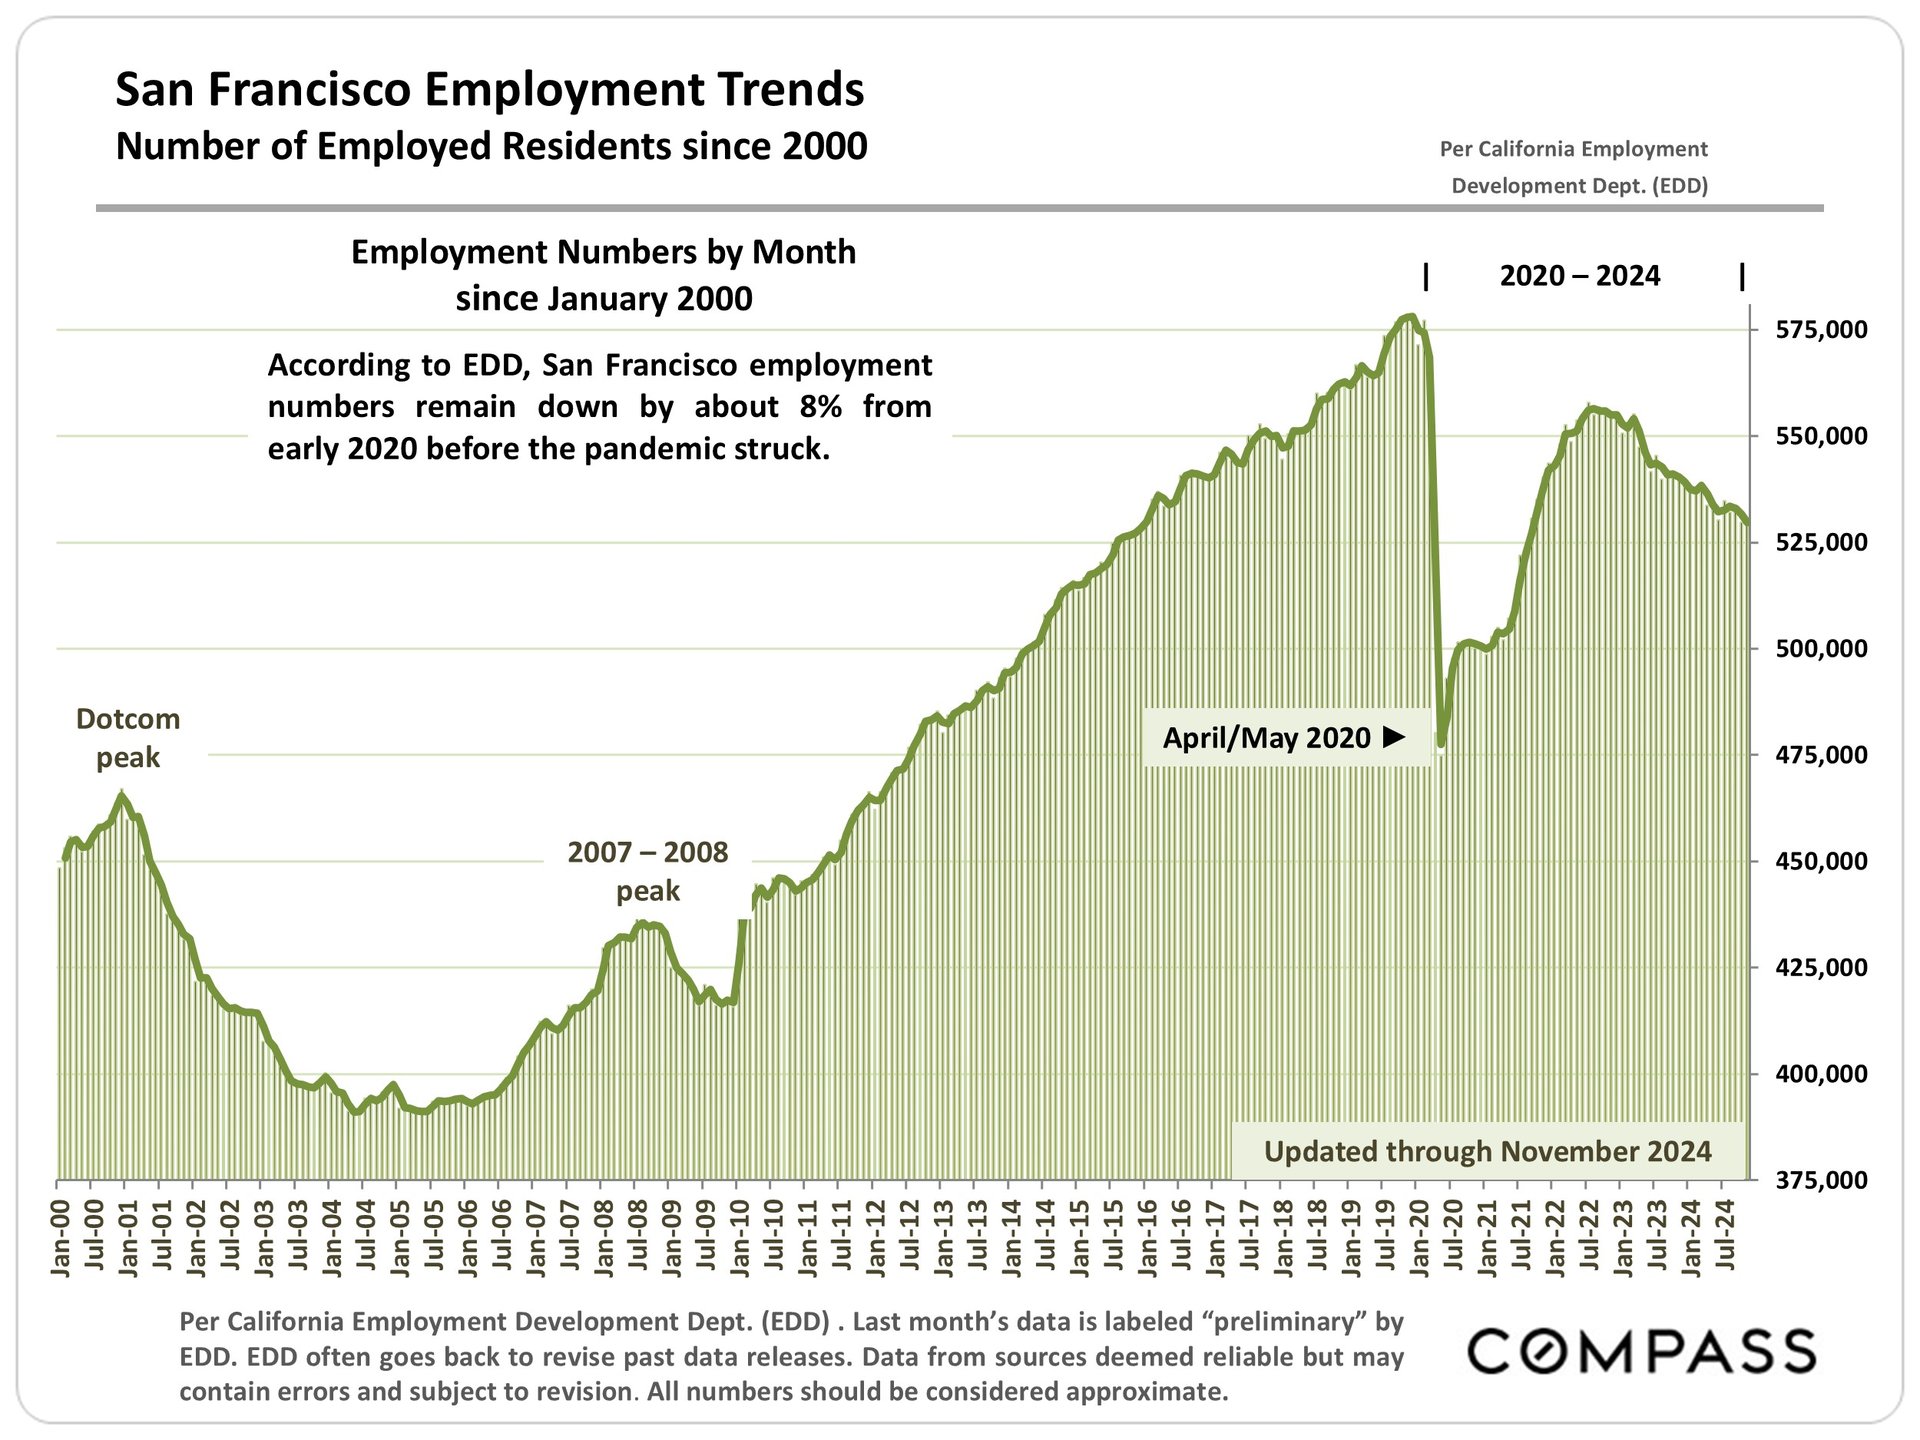
Chart of San Francisco employment from 2000 to November 2024, including the sharp 2020 drop and subsequent recovery.

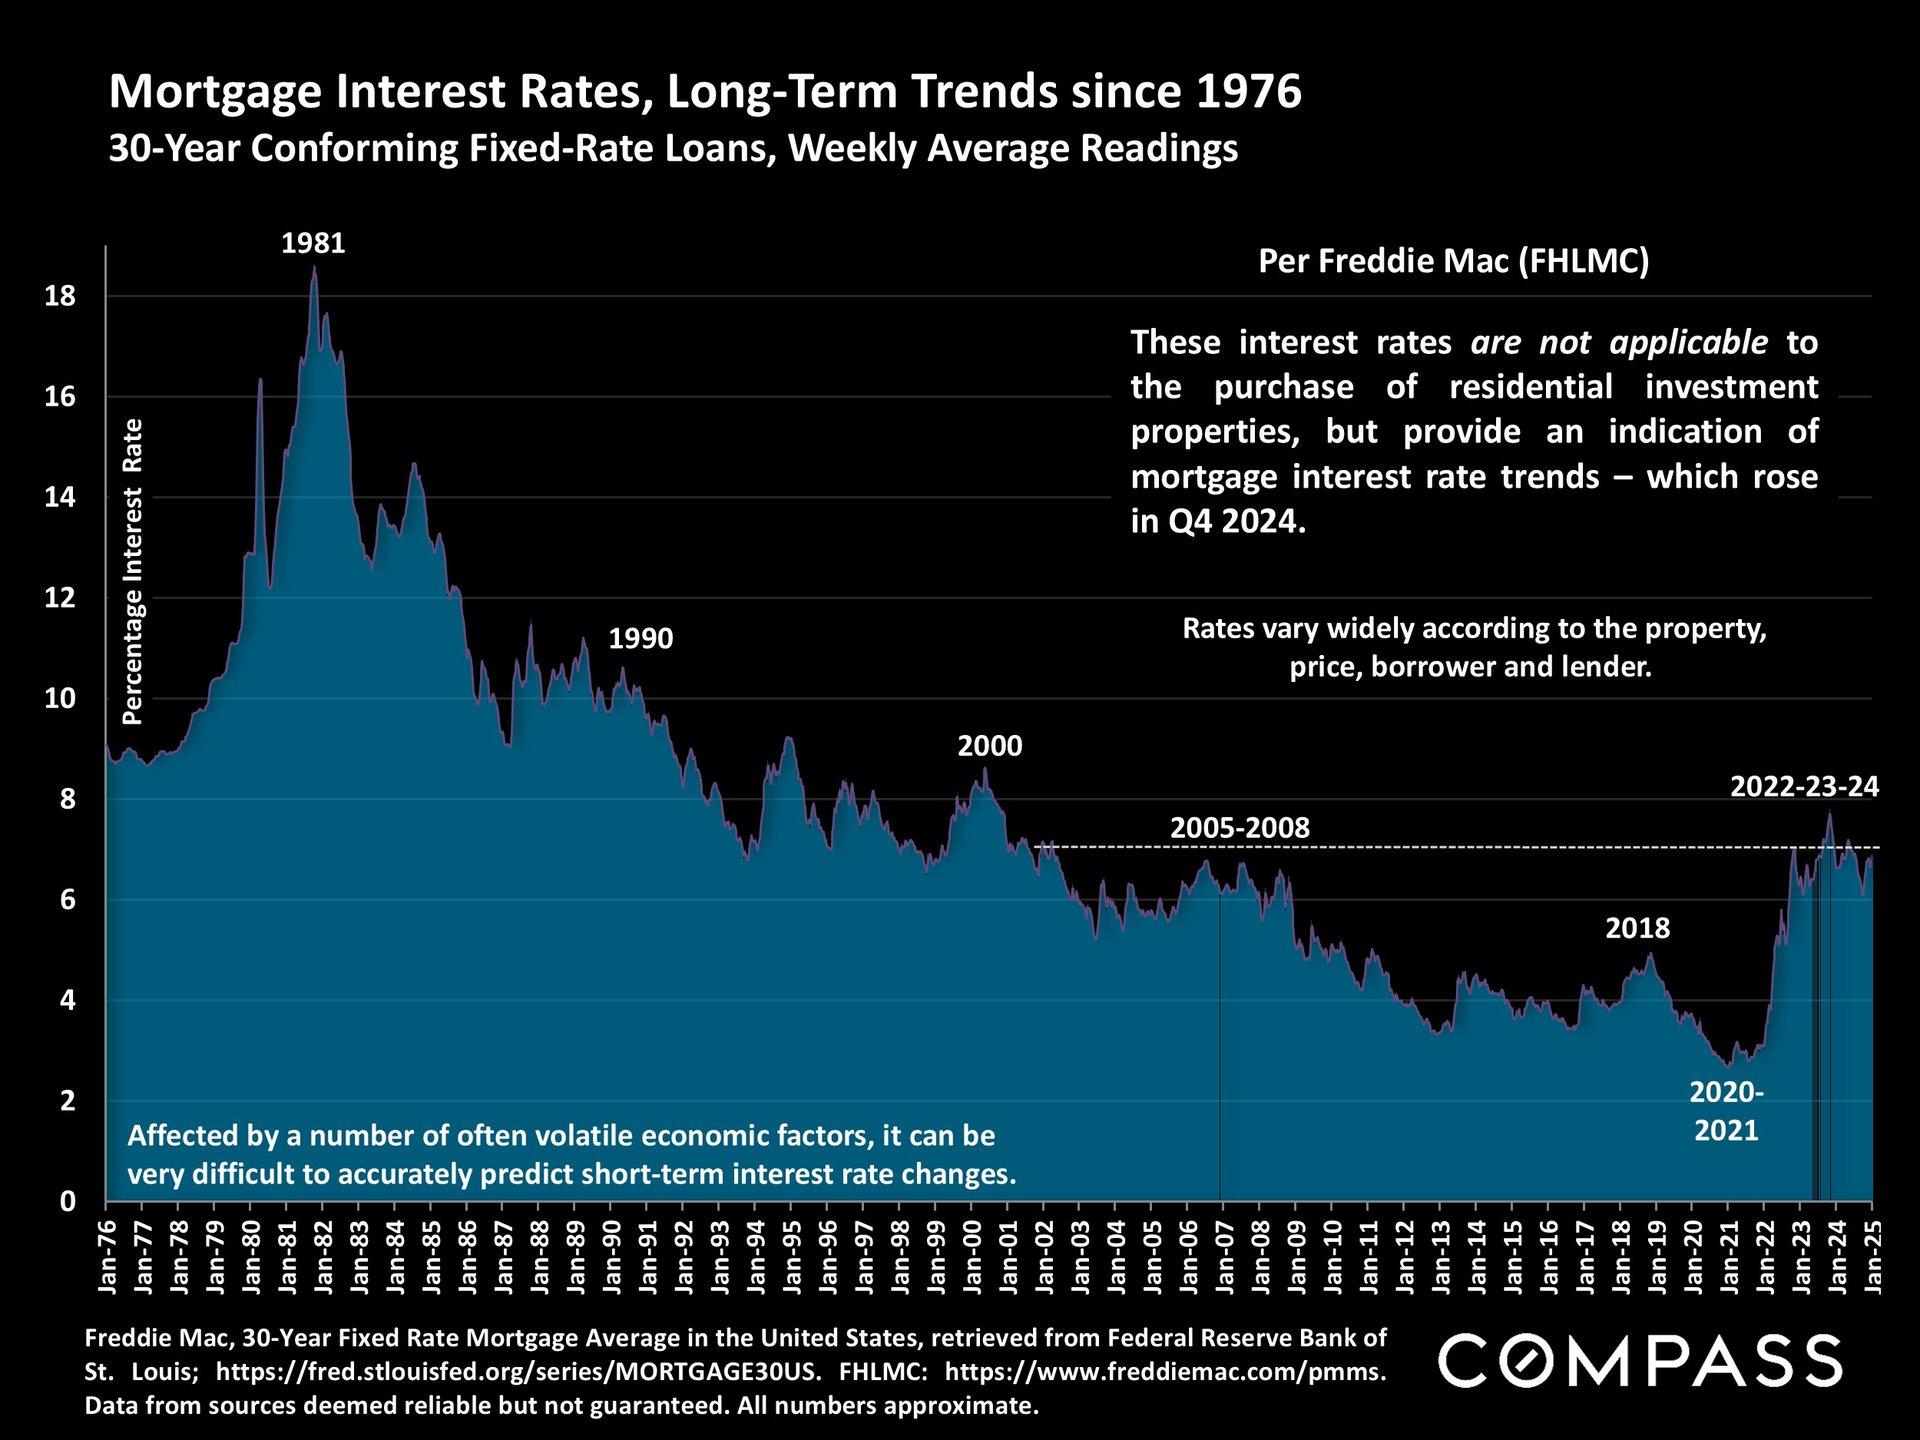
Chart of weekly 30-year fixed mortgage rates from 1976 to 2025, peaking above 18% in 1981.

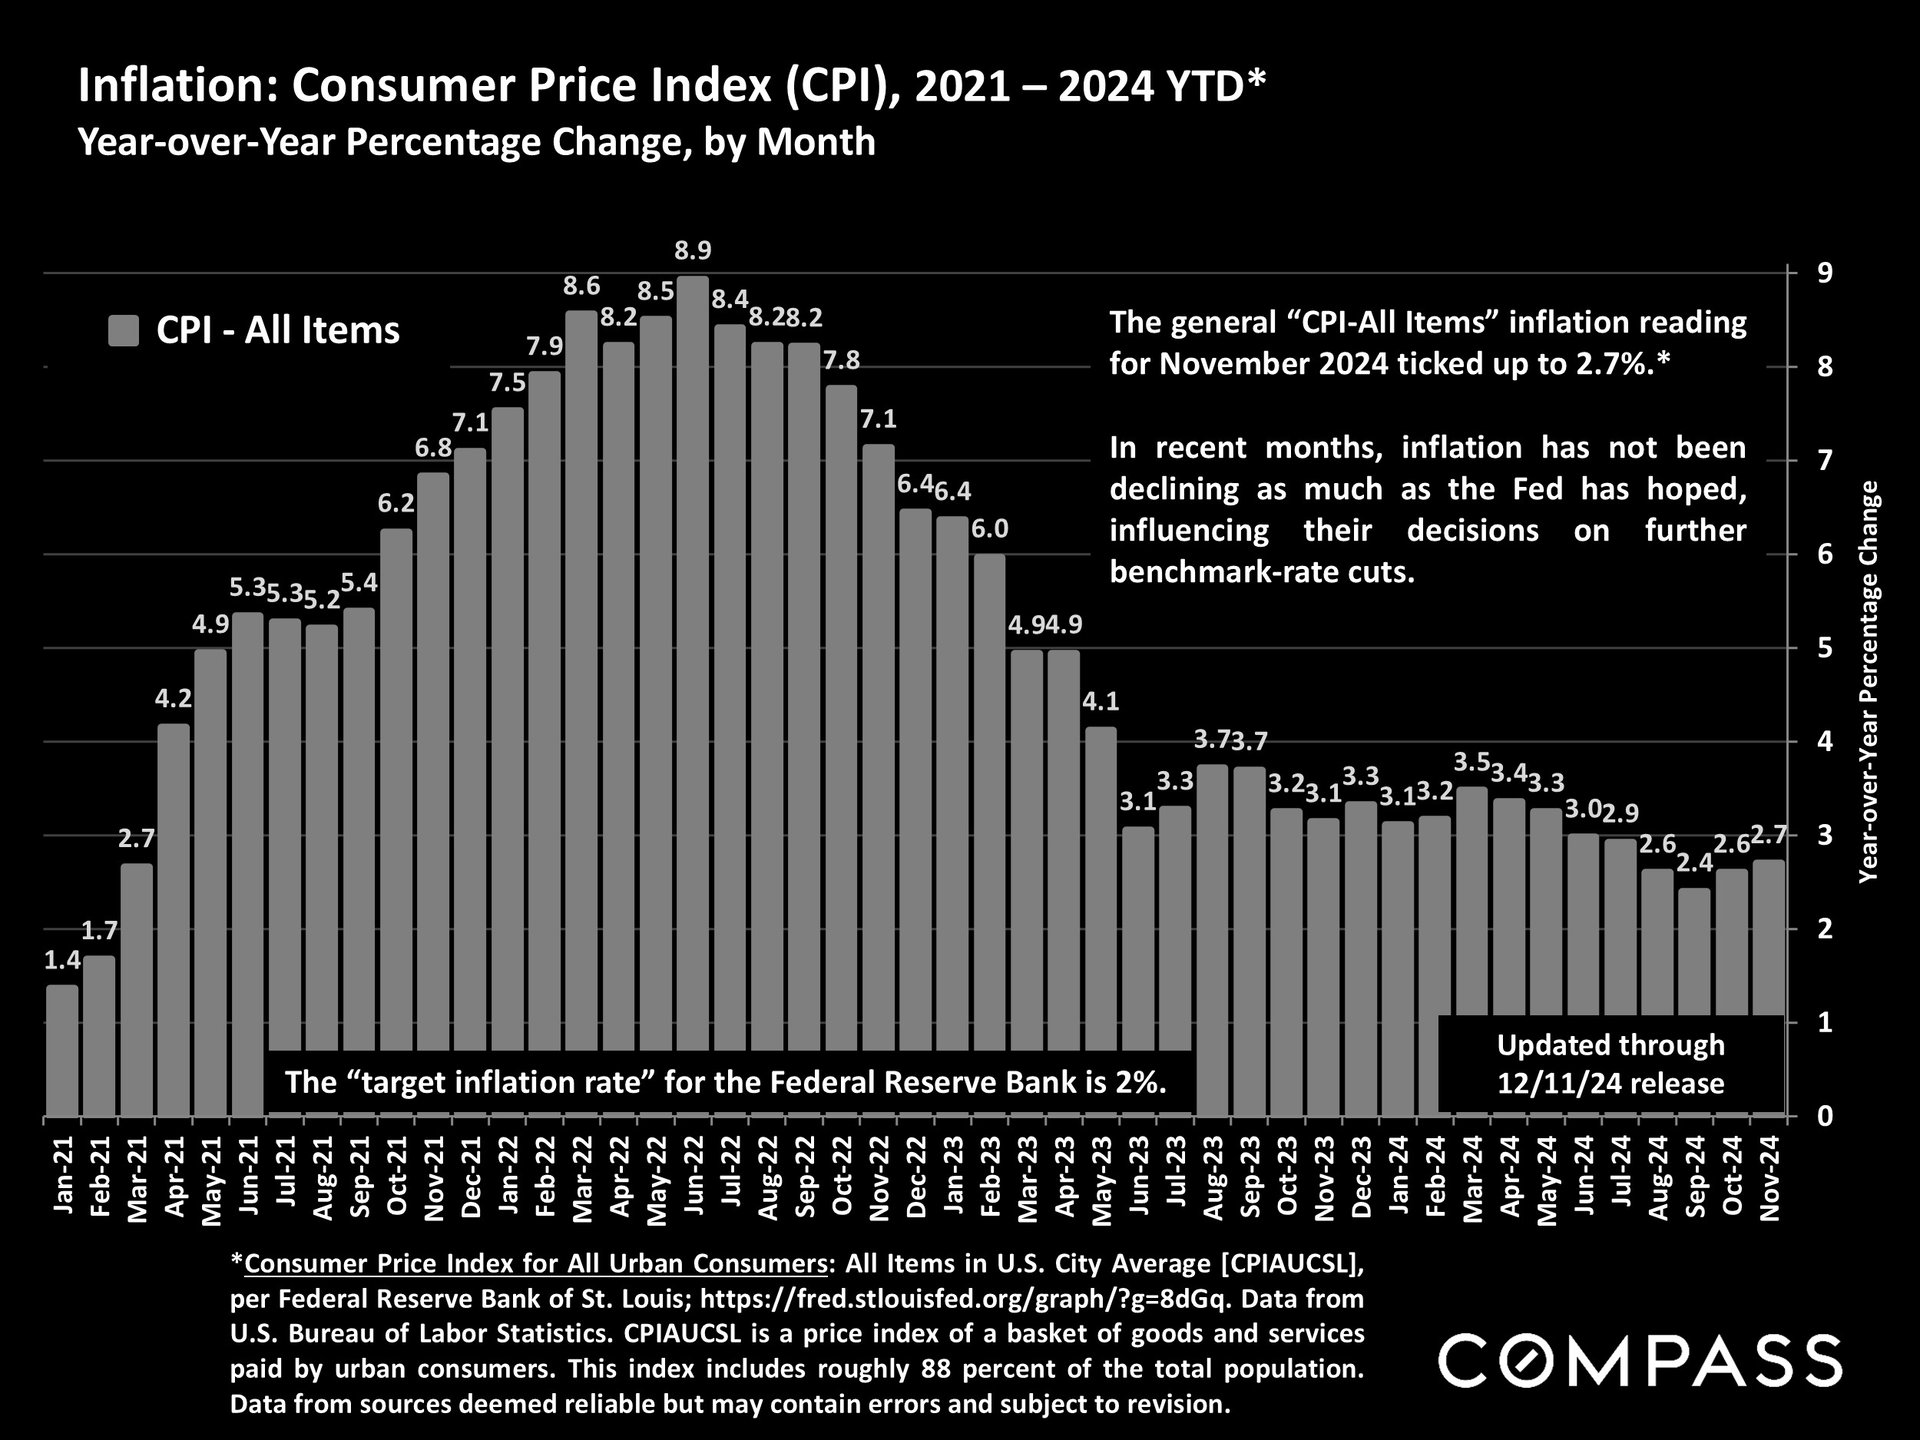
Monthly U.S. CPI inflation chart, peaking at 8.9% in June 2022 and reaching 2.7% in November 2024.

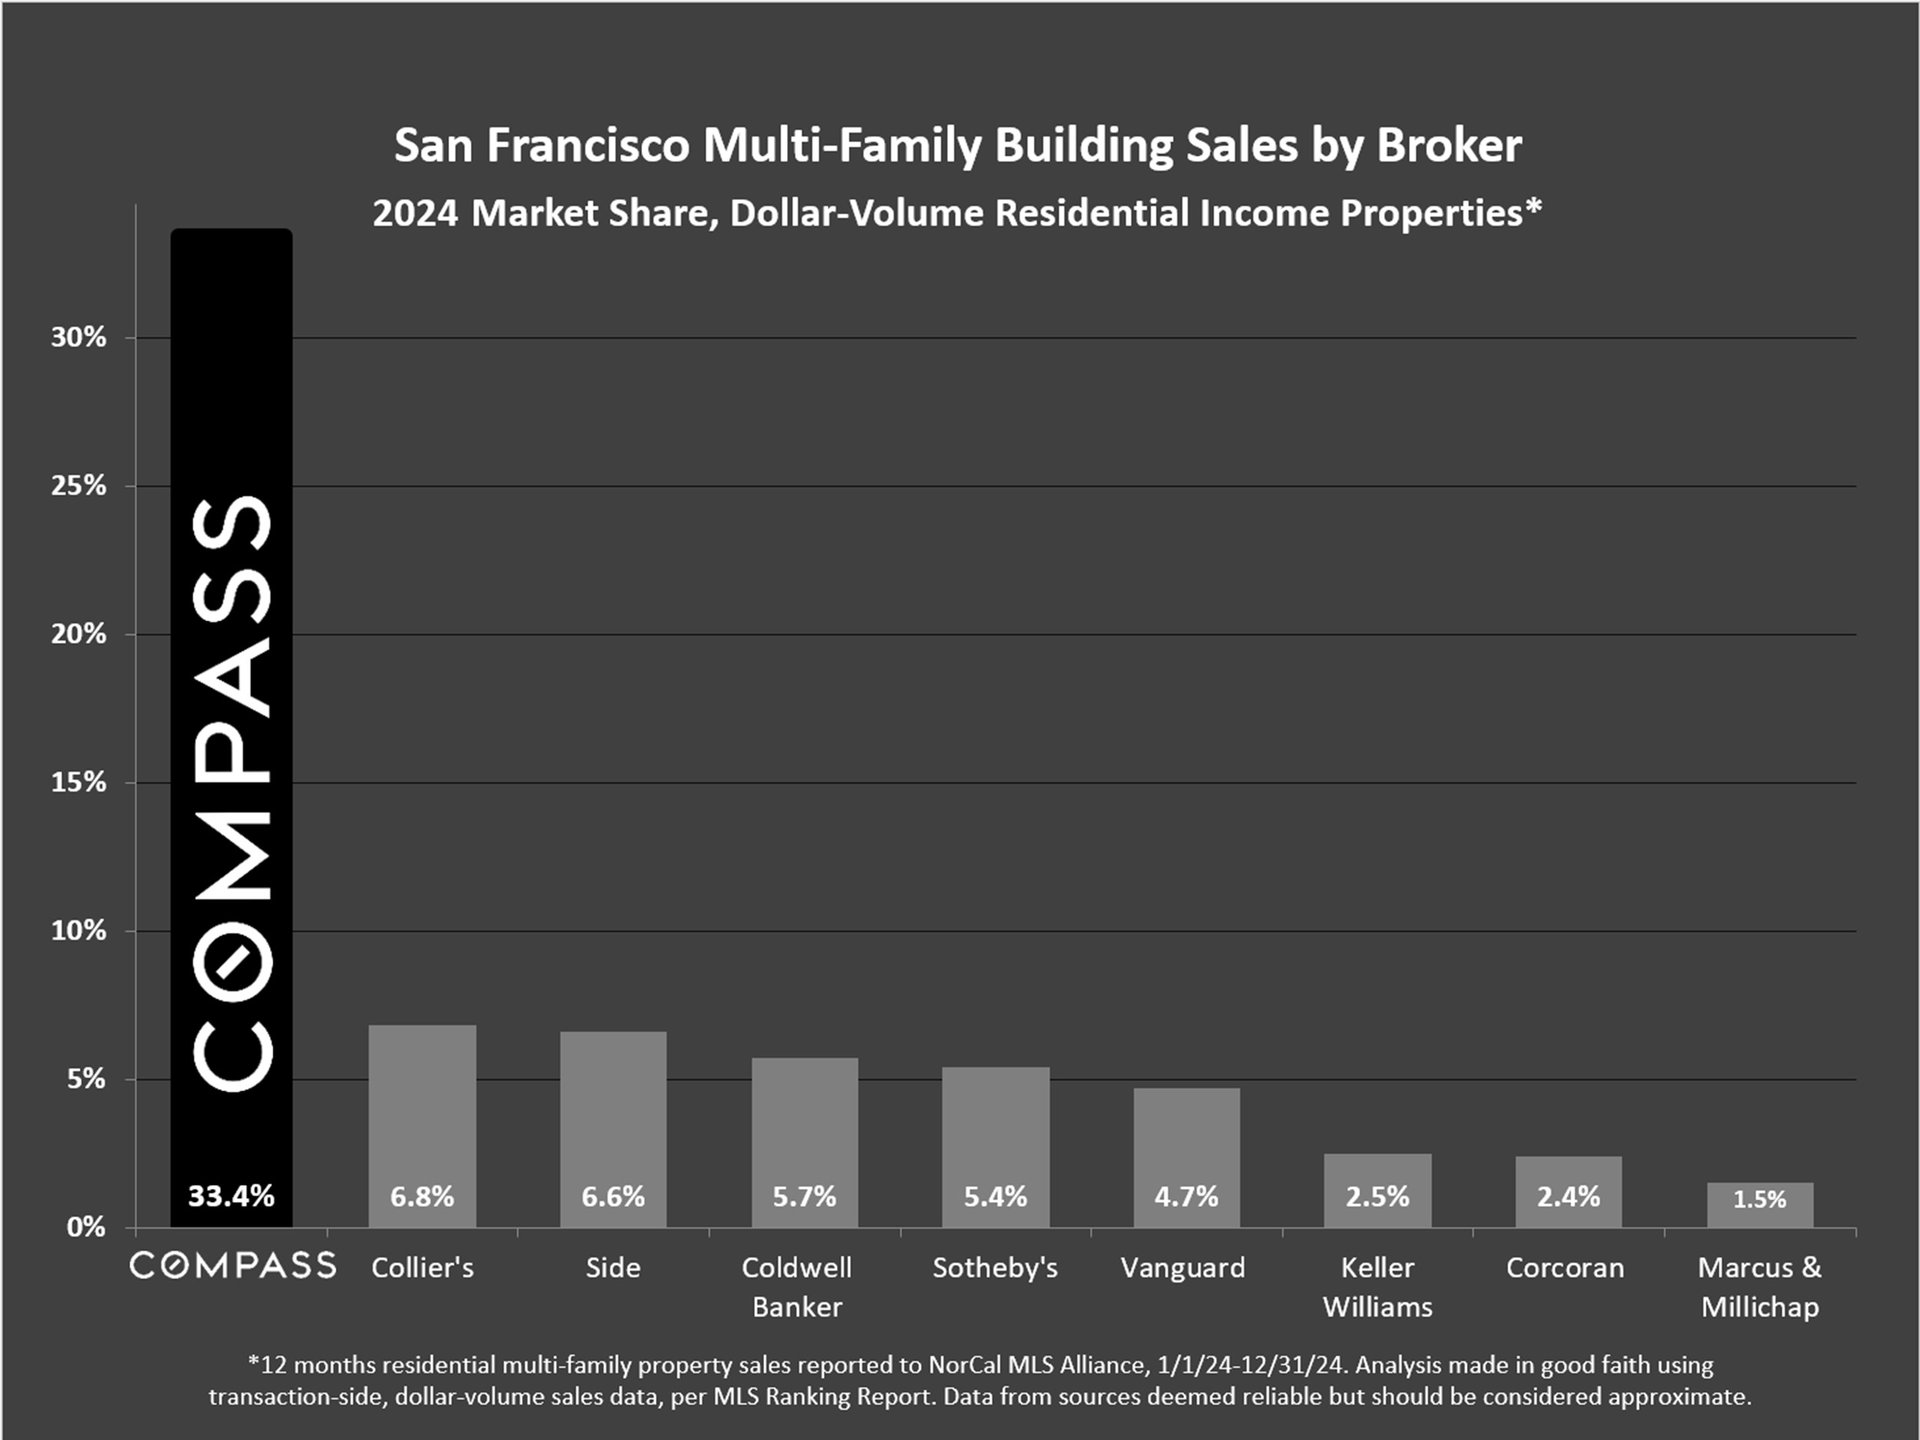
Chart of 2024 San Francisco multifamily sales market share by broker, with Compass leading at 33.4%.

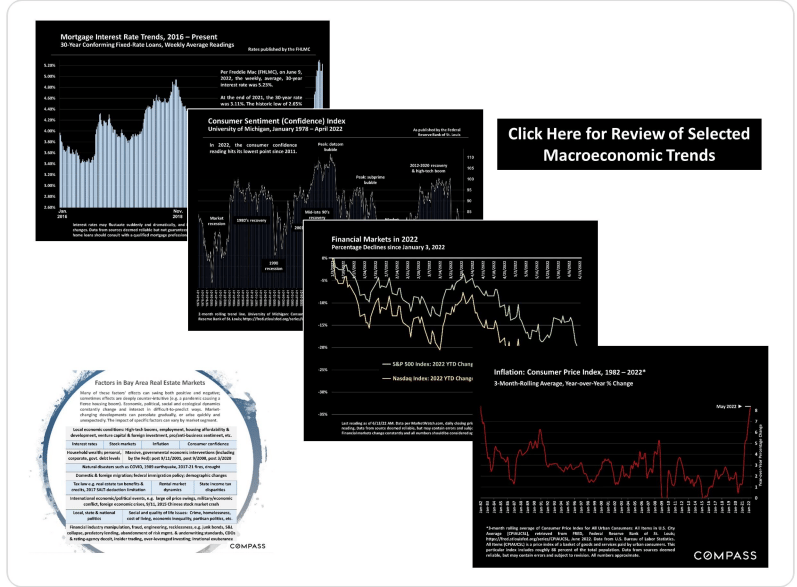
Charts of mortgage rates, consumer sentiment, financial markets, inflation, and Bay Area real estate factors.

Compass report disclaimer with statistical caveats and legal disclosures.


Work With Hanna John Azar

During his past experiences, Hanna John Azar has gained particularly strong knowledge and hands-on experience in maneuvering complex multi-faceted value-add investments.
Contact