July 2024 Report
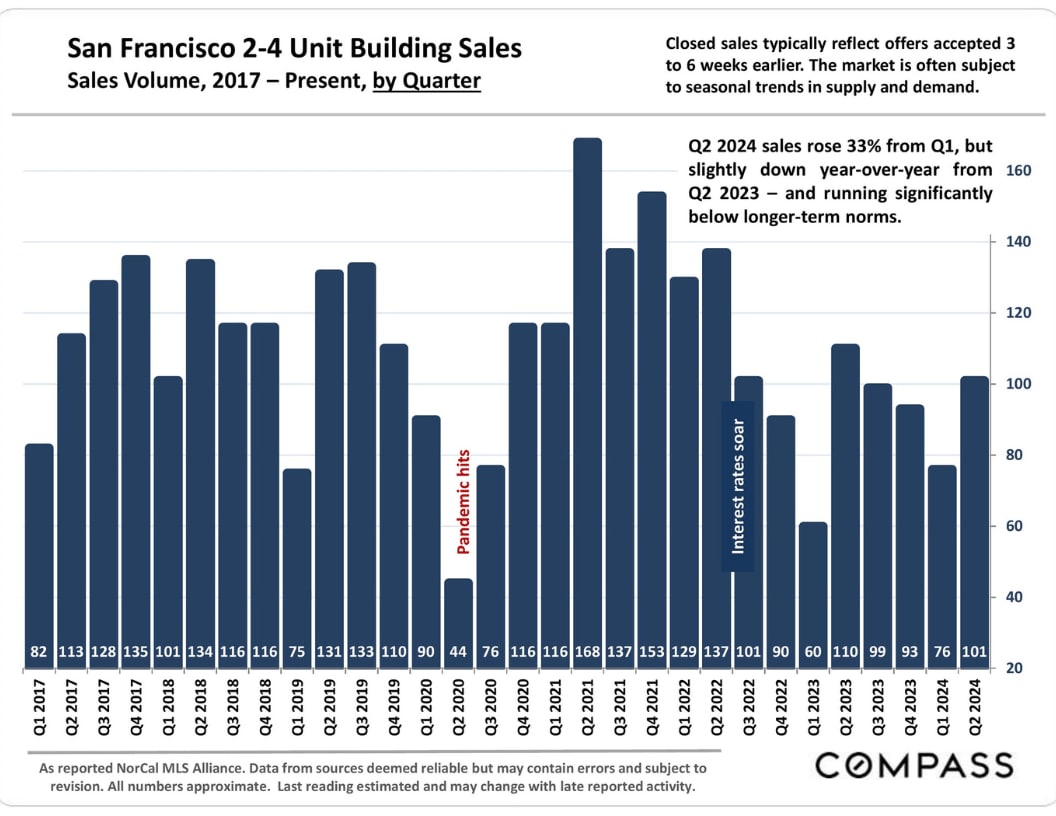
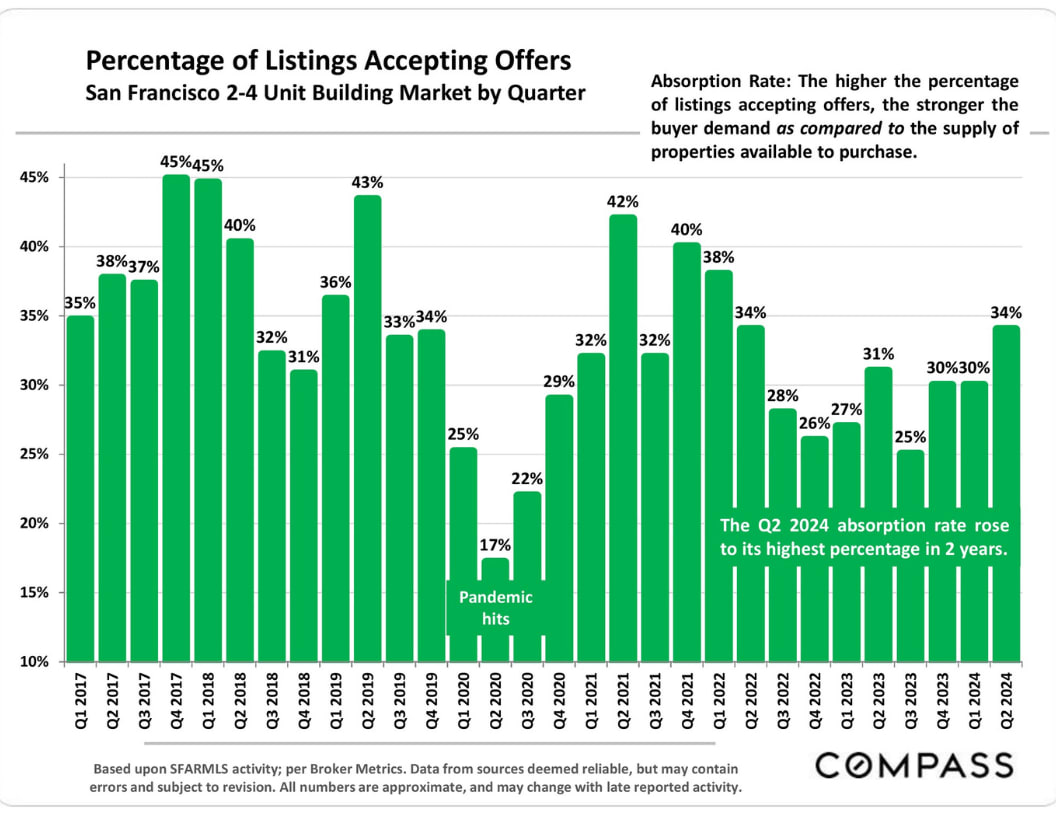
The number of 2-4 unit multi-family building sales in Q2 2024 rose 33% from Q1 but fell about 8% year-over-year and remains well below long-term norms. The absorption rate – the percentage of listings going into the contract - hit its highest quarterly percentage in 2 years. The median Q2 sales price was $1,750,000, with a median building size of 2805 square feet, a median building age of 113 years, and a median days-on-market before acceptance of the offer of 25 days. 58% of properties sold went into contract within 30 days and those quick-selling buildings averaged a sales price almost 6% over list price. Listings taking longer to sell typically sell significantly below the list price.
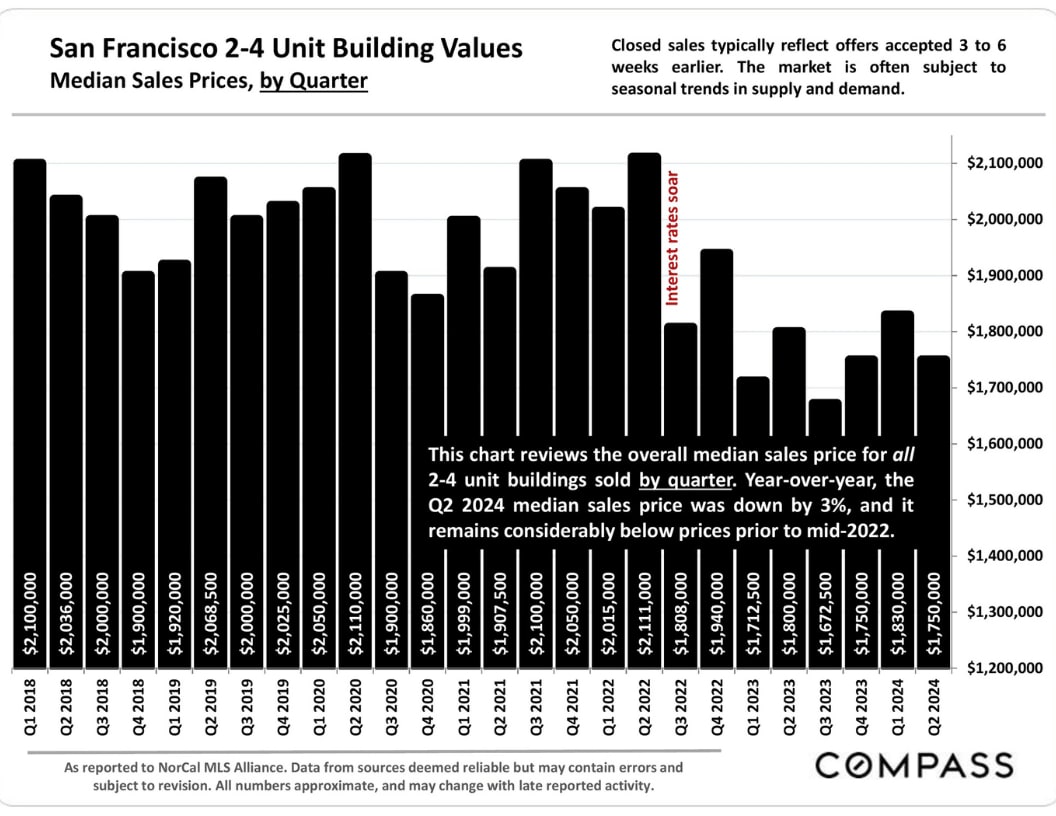
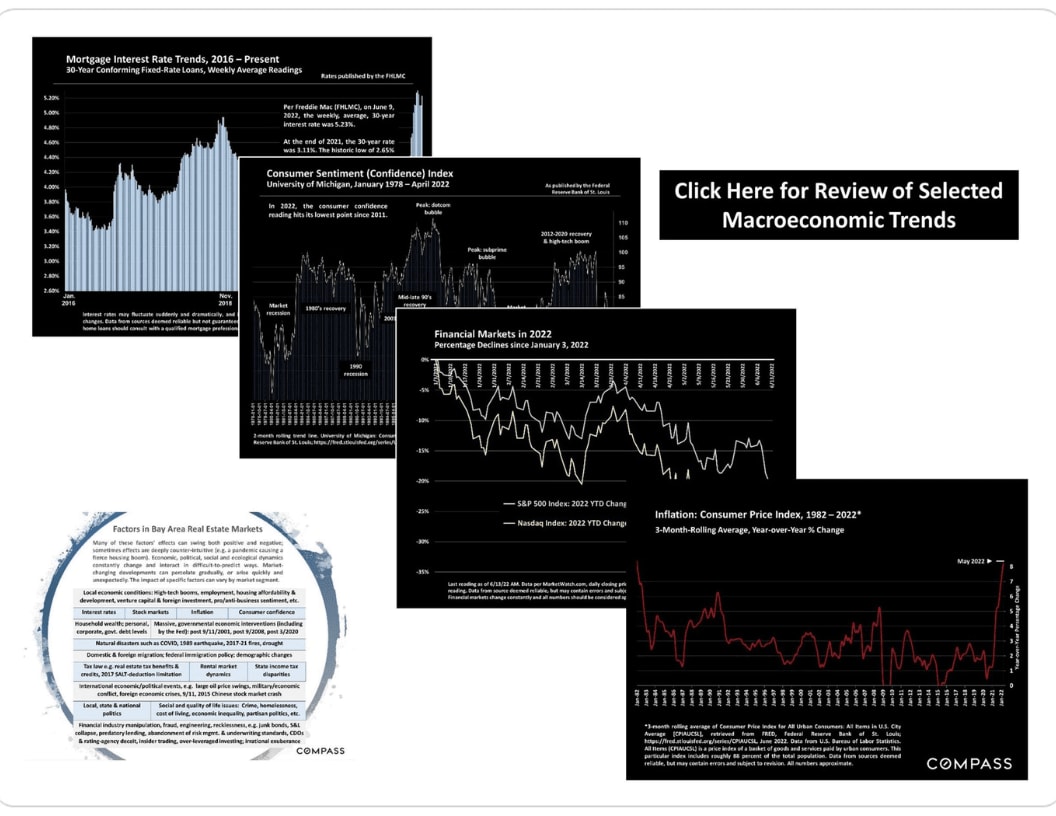
Median values continue to reflect significant declines from those seen before mid-2022 when interest rates soared. Apartment rents have been ticking up in 2024, but are slightly down year-over-year, and remain (very approximately) 12% to 16% below pre-pandemic rates.
The office-building vacancy rate is above 32%, and leasing rates continue to fall. Office attendance rates remain down over 50% from pre-pandemic levels, a major factor in SF apartment demand and rent rates. Hopefully, this segment has hit bottom and will now begin to recover.
Acco
As of early July, there were 153 2-4 unit buildings listed for sale - with no offer accepted - with a median building size of 3315 square feet, a median age of 113 years, a median list price of $1,995,000, and a median days on market of 56 days. 40 properties were listed as being in contract: These had a median building size of 3195 square feet, a median age of 100 years, a median list price of $1,865,000, and a median days-on-market of 46 days.
San Francisco 2-4 Unit Building Sales
Sales Volume, 2017 - Present, by Quarter
San Francisco 2-4 Unit Building Values
Median Sales Prices, by Quarter
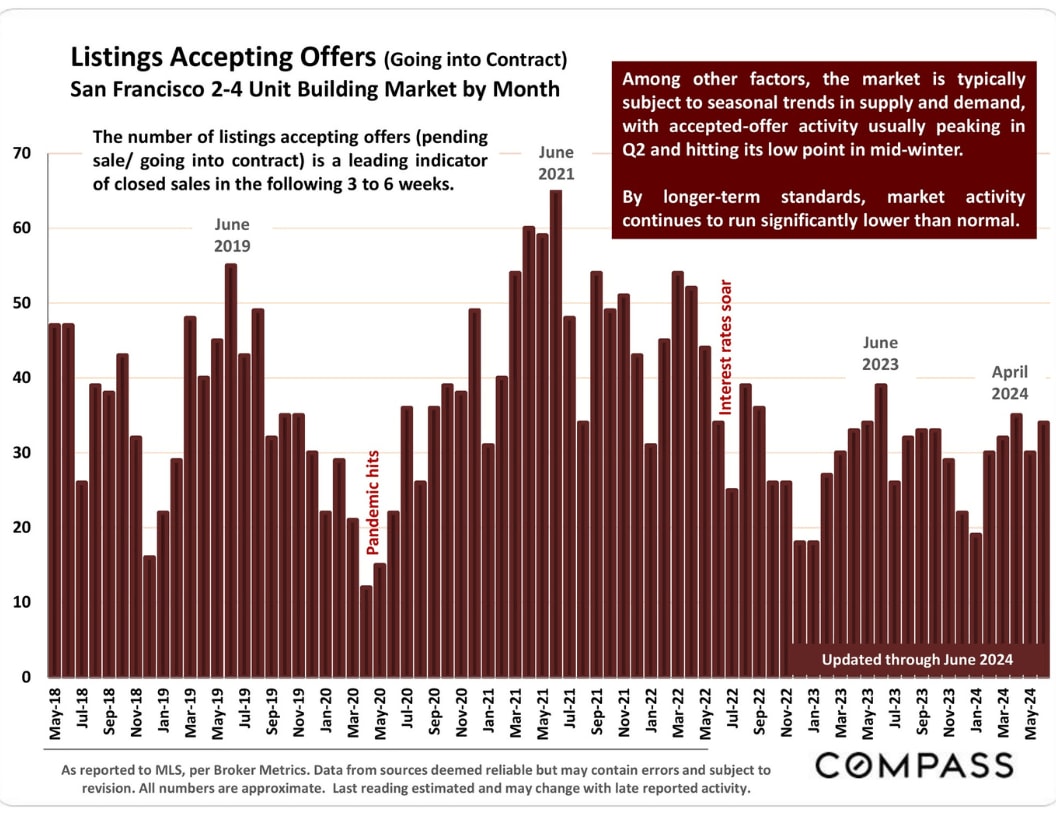
Closed sales typically reflect offers accepted 3 to 6 weeks earlier. The market is often subject to seasonal trends in supply and demand.
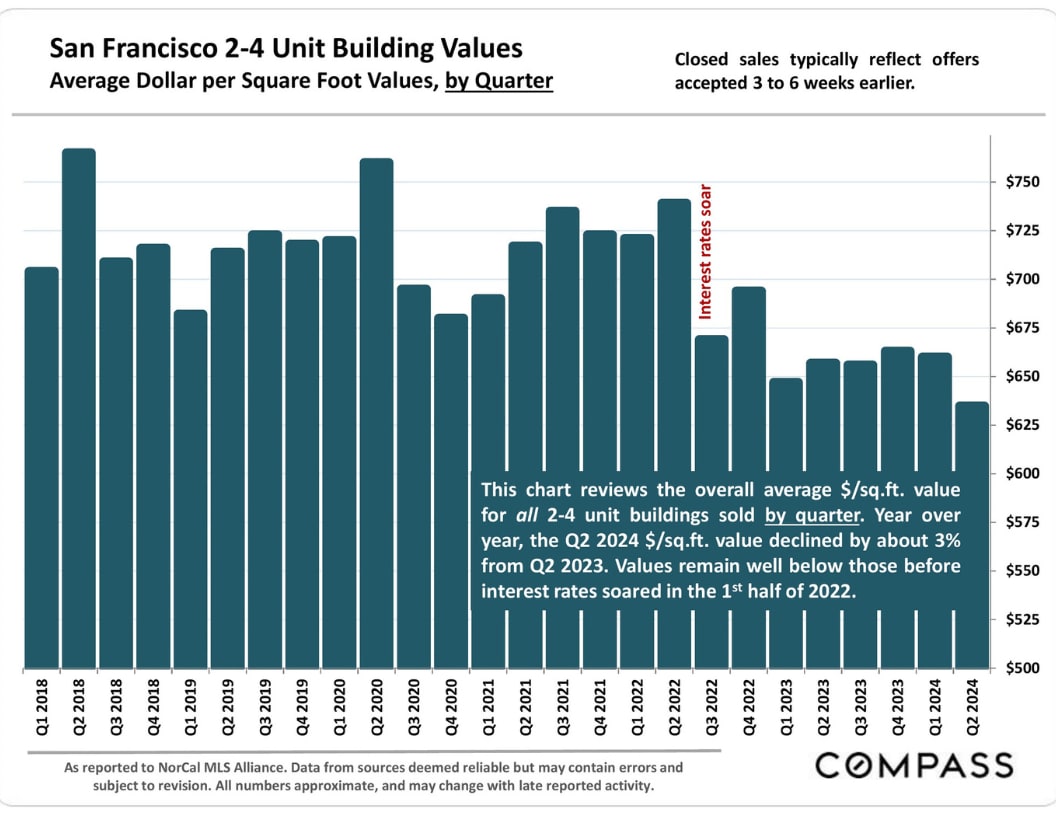
San Francisco 2-4 Unit Building Values
Average Dollar per Square Foot Values, by Quarter
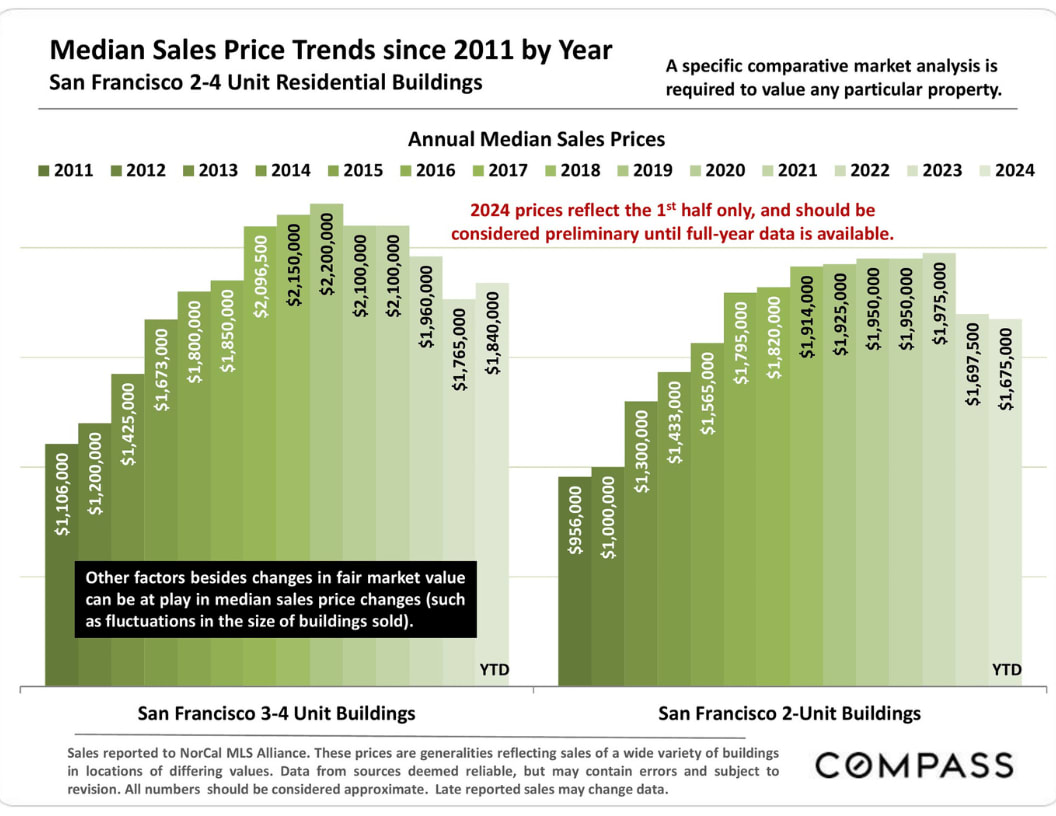
Median Sales Price Trends since 2011 by Year
San Francisco 2-4 Unit Residential Buildings
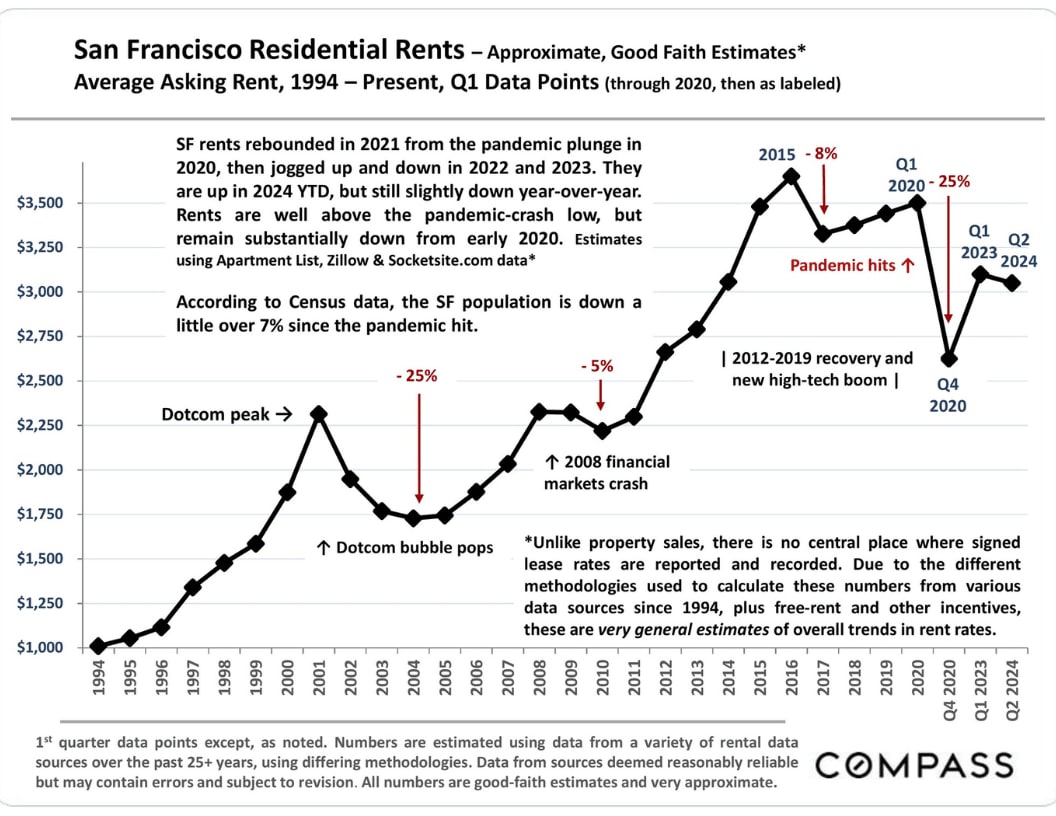
San Francisco Residential Rents - Approximate, Good Faith Estimates*
Average Asking Rent, 1994 - Present, Q1 Data Points (through 2020, then as labeled)
SF rents rebounded in 2021 from the pandemic plunge in 2020, then jogged up and down in 2022 and 2023. They are up in 2024 YTD, but still slightly down year-over-year. Rents are well above the pandemic-crash low but remain substantially down from early 2020. Estimates using Apartment List, Zillow & Socketsite.com data*
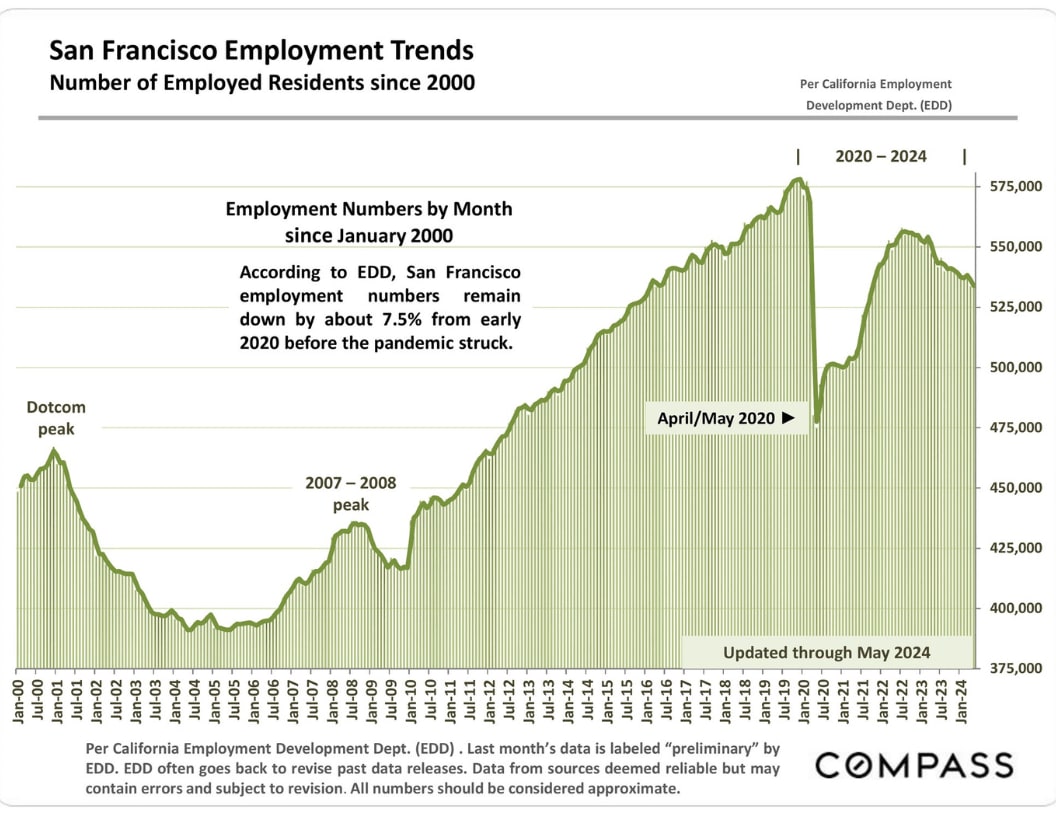
According to Census data, the SF population has been down a little over 7% since the pandemic hit.
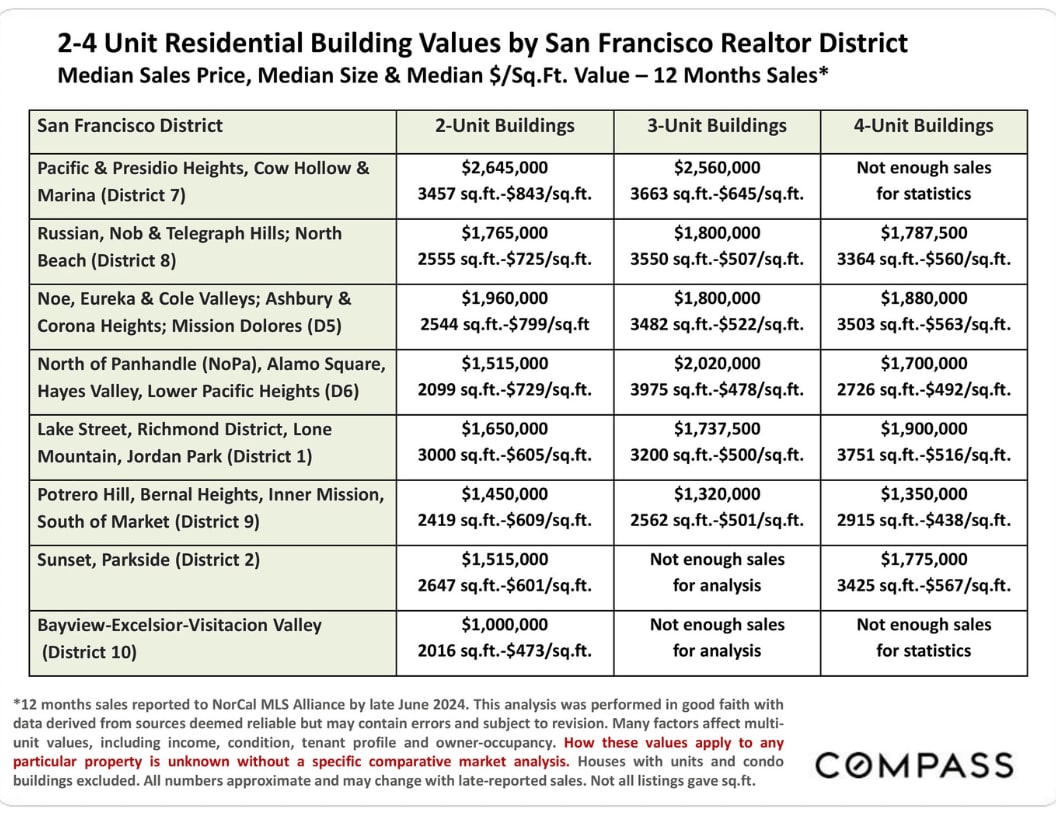
2-4 Unit Residential Building Values by San Francisco Realtor District
Median Sales Price, Median Size & Median $/Sq.Ft. Value - 12 Months Sales*
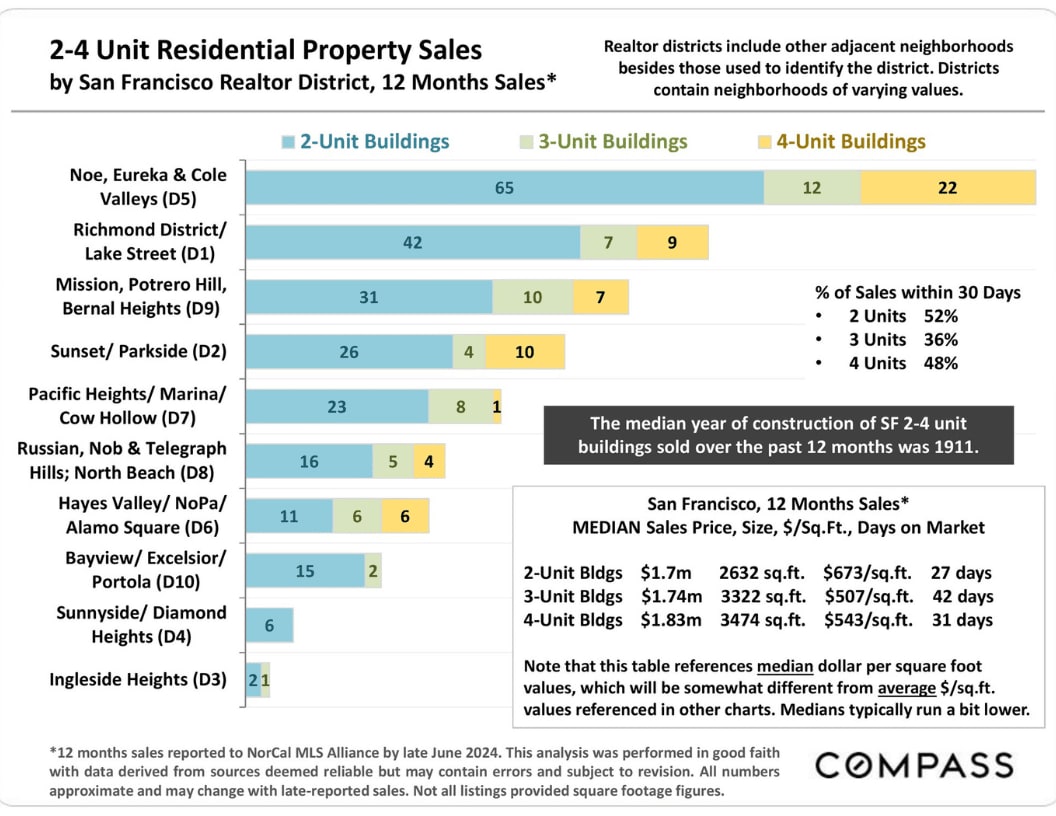
2-4 Unit Residential Property Sales
by San Francisco Realtor District, 12 Months Sales*
Realtor districts include other adjacent neighborhoods besides those used to identify the district. Districts contain neighborhoods of varying values.
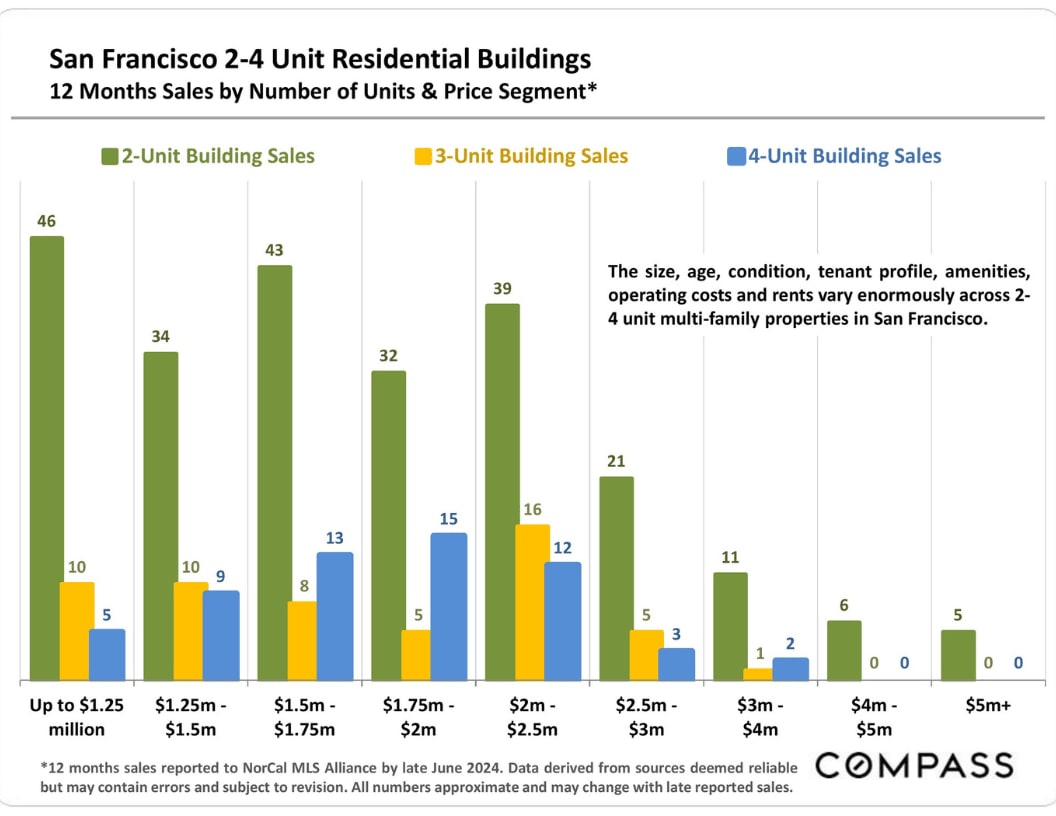
San Francisco 2-4 Unit Residential Buildings
12 Months Sales by Number of Units & Price Segment*
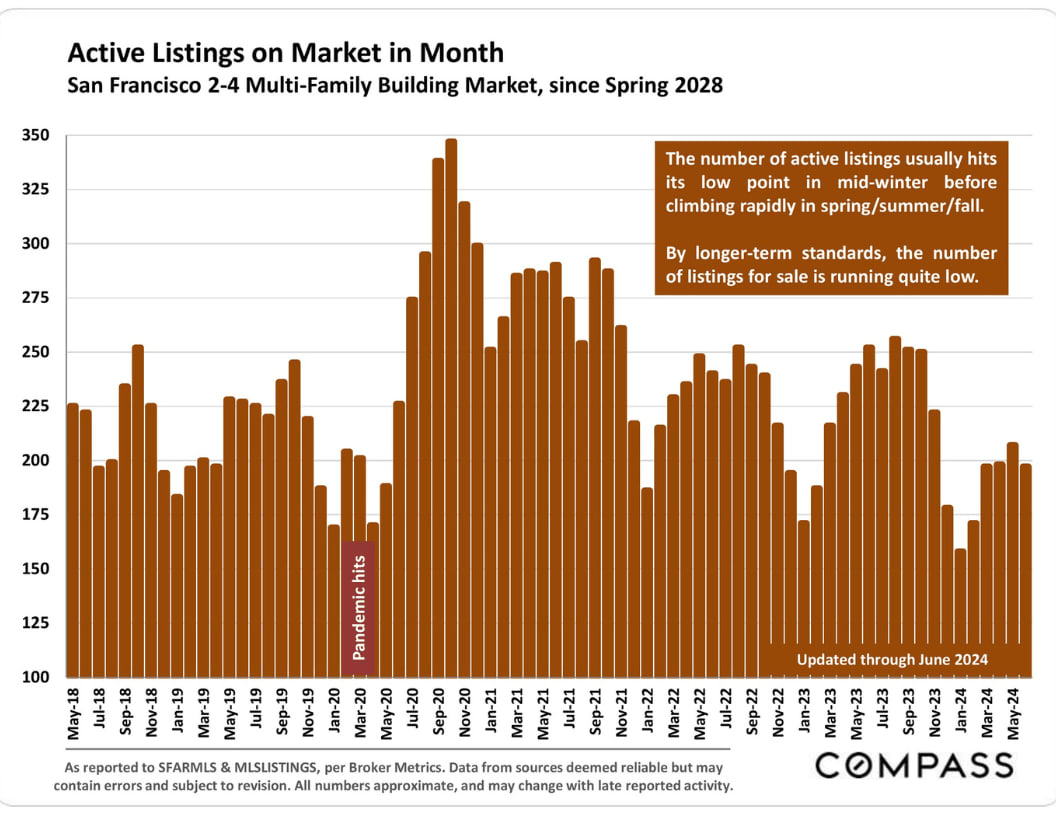
Active Listings on the Market in Month
San Francisco 2-4 Multi-Family Building Market, since Spring 2028
Listings Accepting Offers (Going into Contract)
San Francisco 2-4 Unit Building Market by Month
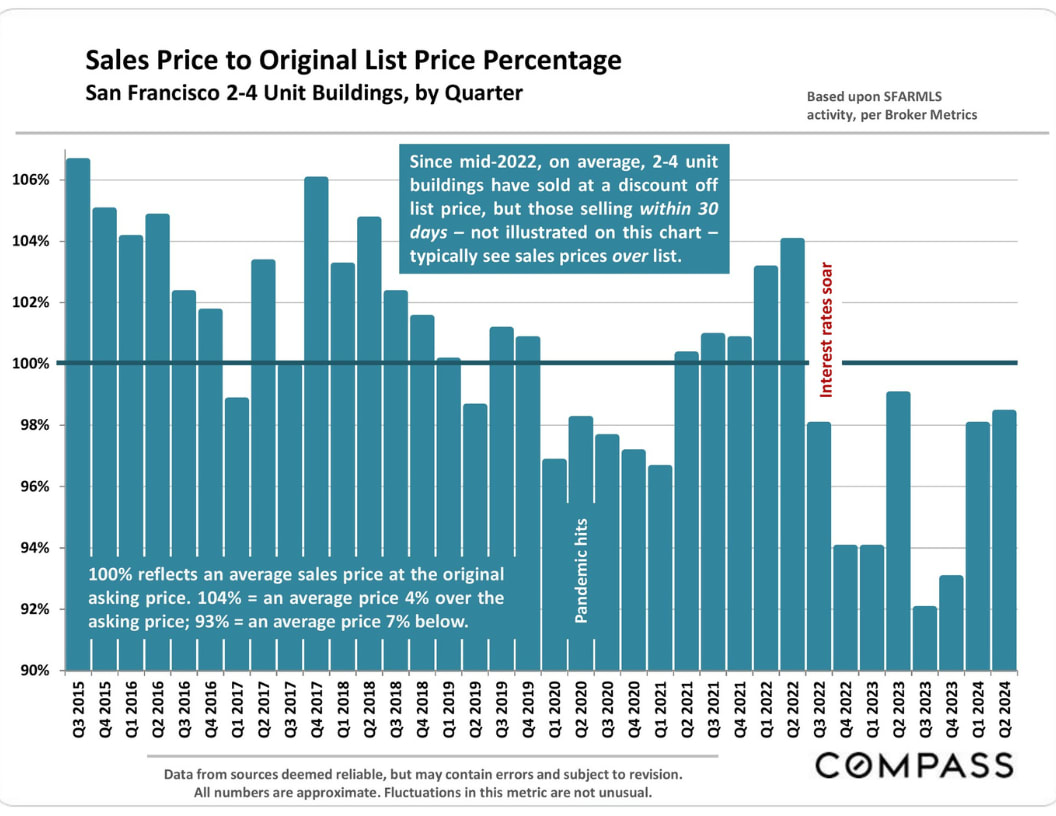
Sales Price to Original List Price Percentage
San Francisco 2-4 Unit Buildings, by Quarter
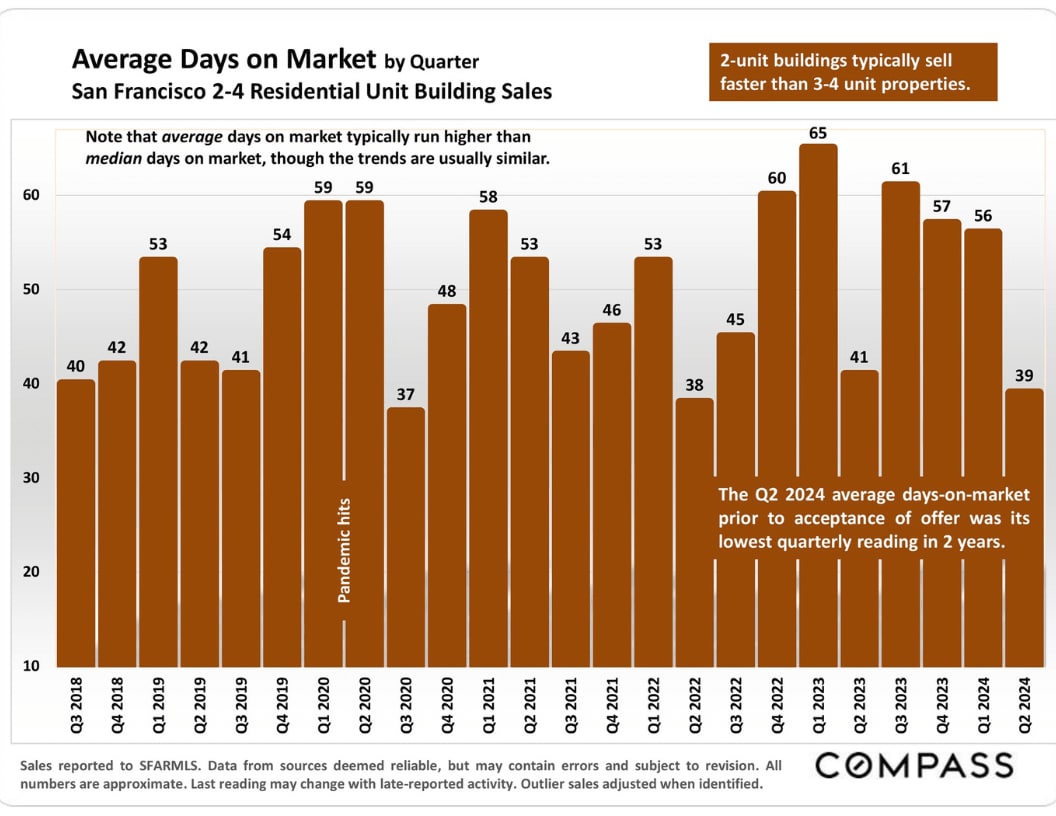
Average Days on Market by Quarter
San Francisco 2-4 Residential Unit Building Sales
Note that average days on the market typically run higher than median days on the market, though the trends are usually similar.
Percentage of Listings Accepting Offers
Francisco 2-4 Unit Building Market by Quarter
San Francisco Employment Trends
Number of Employed Residents since 2000
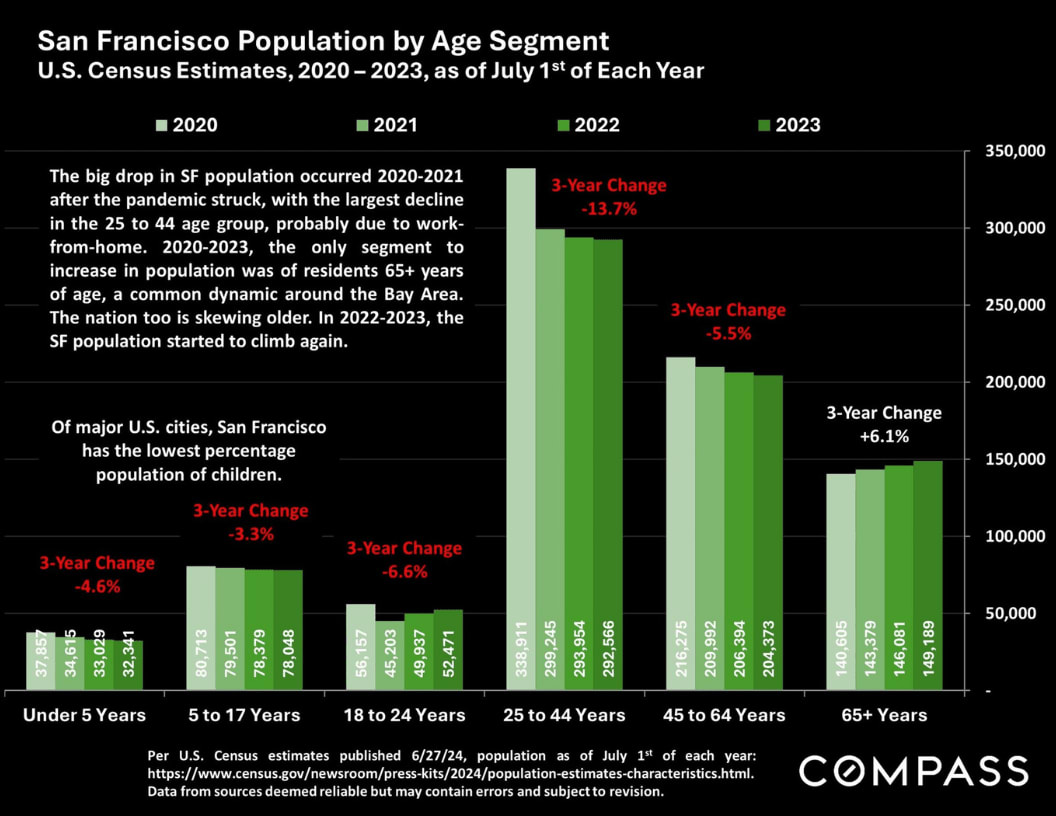
San Francisco Population by Age Segment
U.S. Census Estimates, 2020-2023, as of July 1st of Each Year
The big drop in the SF population occurred in 2020-2021 after the pandemic struck, with the largest decline in the 25 to 44 age group, probably due to work-from-home. 2020-2023, the only segment to increase in population was residents 65+ years of age, a common dynamic around the Bay Area. The nation too is skewing older. In 2022-2023, the SF population started to climb again.
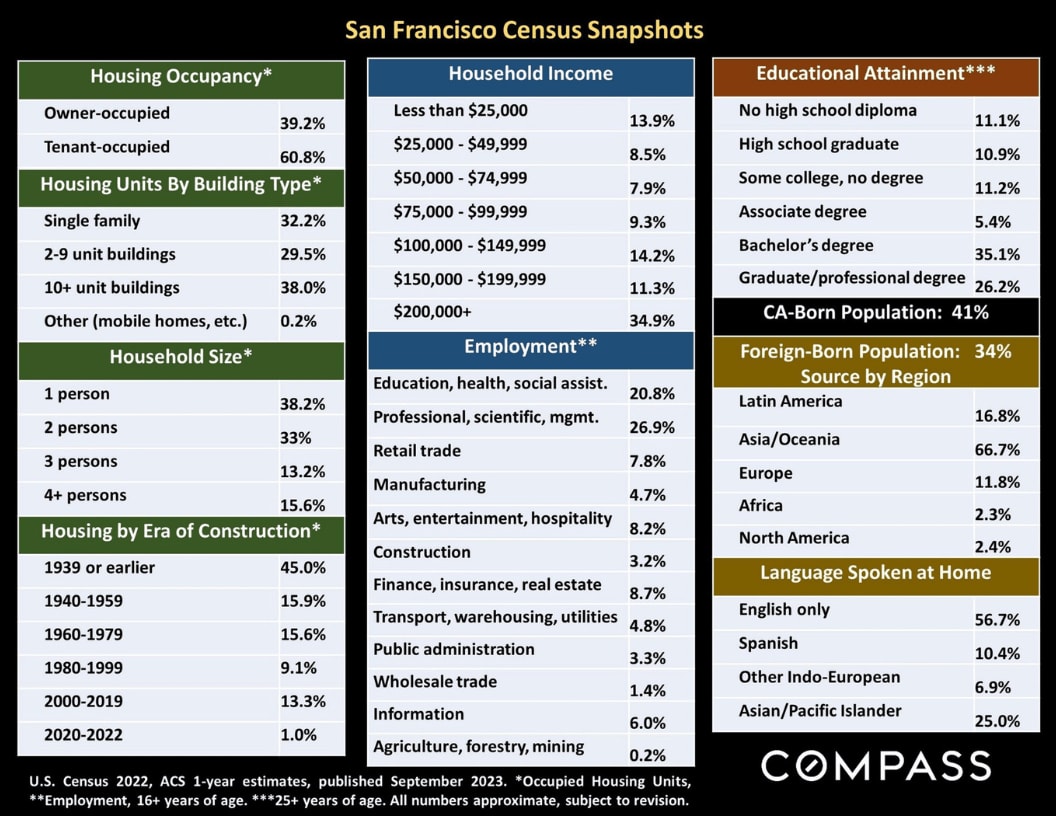
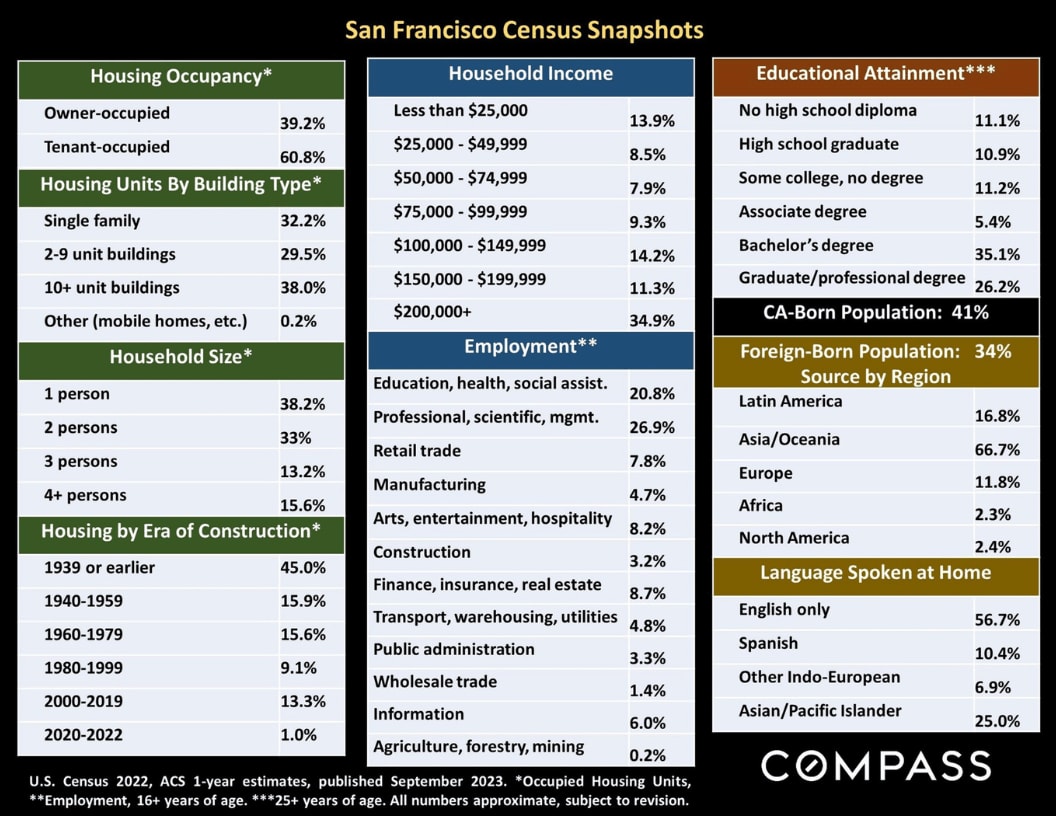
San Francisco Census Snapshots
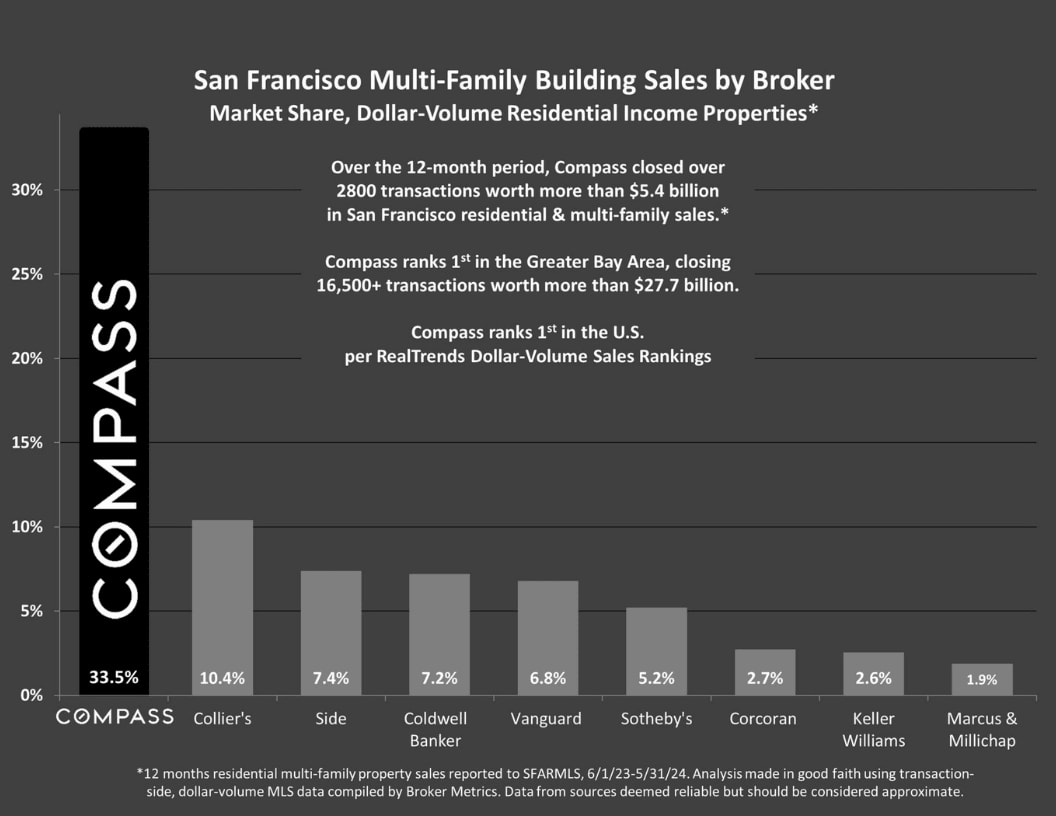
San Francisco Multi-Family Building Sales by Broker
Market Share, Dollar-Volume Residential Income Properties*
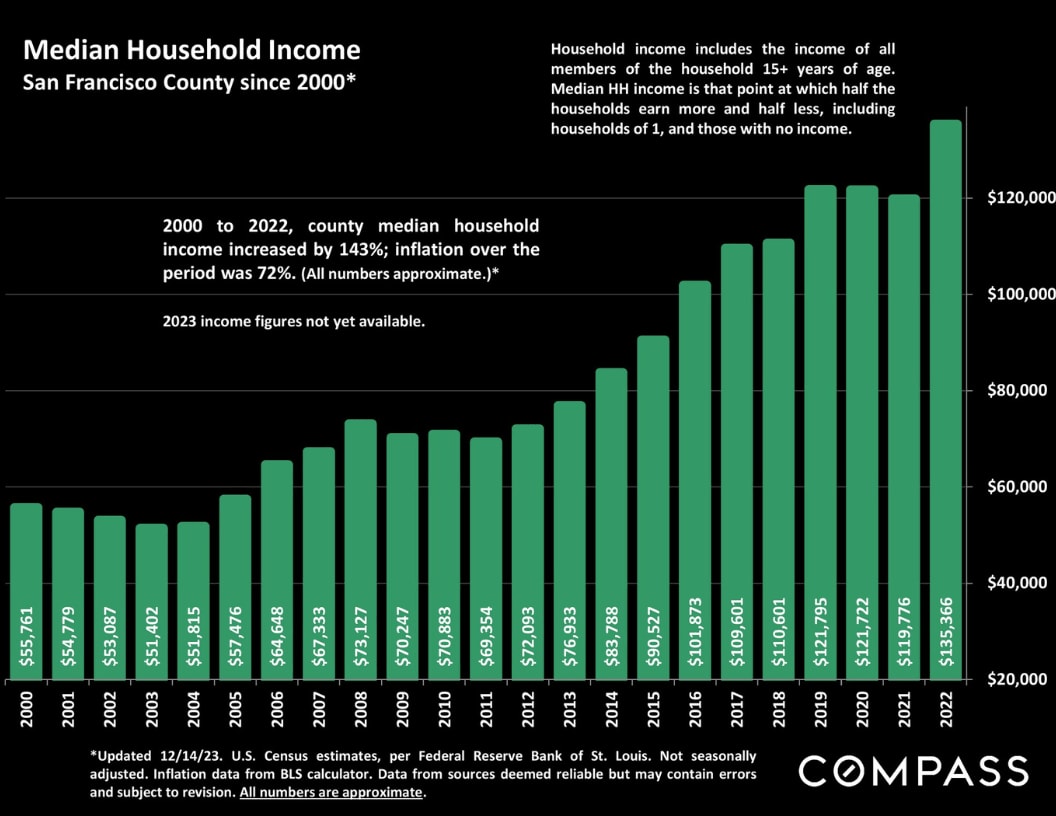
Median Household Income
San Francisco County since 2000
Note that the quantity of sales in any given local submarket is usually relatively small and/or the number of sales that report the necessary financial information can be limited. Buildings of different ages, qualities, and sizes selling in different periods can cause these average and median figures to fluctuate significantly. Furthermore, the reliability of some of these calculations depends upon the quality of the income and expense figures provided by the listing agents, and sometimes instead of actual numbers, much less meaningful projected or scheduled figures are used. Therefore, the above statistics should be considered very general indicators, and how they apply to any particular property without a specific comparative market analysis is unknown.
These analyses were made in good faith with data from sources deemed reliable, but they may contain errors and are subject to revision. Statistics are generalities and all numbers should be considered approximate.
Compass is a real estate broker licensed by the State of California, DRE 01527235. Equal Housing Opportunity. This report has been prepared solely for information purposes. The information herein is based on or derived from information generally available to the public and/or from sources believed to be reliable. No representation or warranty can be given concerning the accuracy or completeness of the information. Compass disclaims any liability relating to this report, including without limitation any express or implied representations or warranties for statements contained in, and omissions from, the report. Nothing contained herein is intended to be or should be read as any regulatory, legal, tax, accounting, or other advice and Compass does not provide such advice. All opinions are subject to change without notice. Compass makes no representation regarding the accuracy of any statements regarding any references to the laws, statutes, or regulations of any state are those of the author(s). Past performance is no guarantee of future results.
© 2022 Compass
