Report Highlights
- The 3-month-rolling median house sales price in May, at $1,735,000, hit its highest value since mid-2022. The median condo sales price, $1,135,500, declined about 1% yearly.
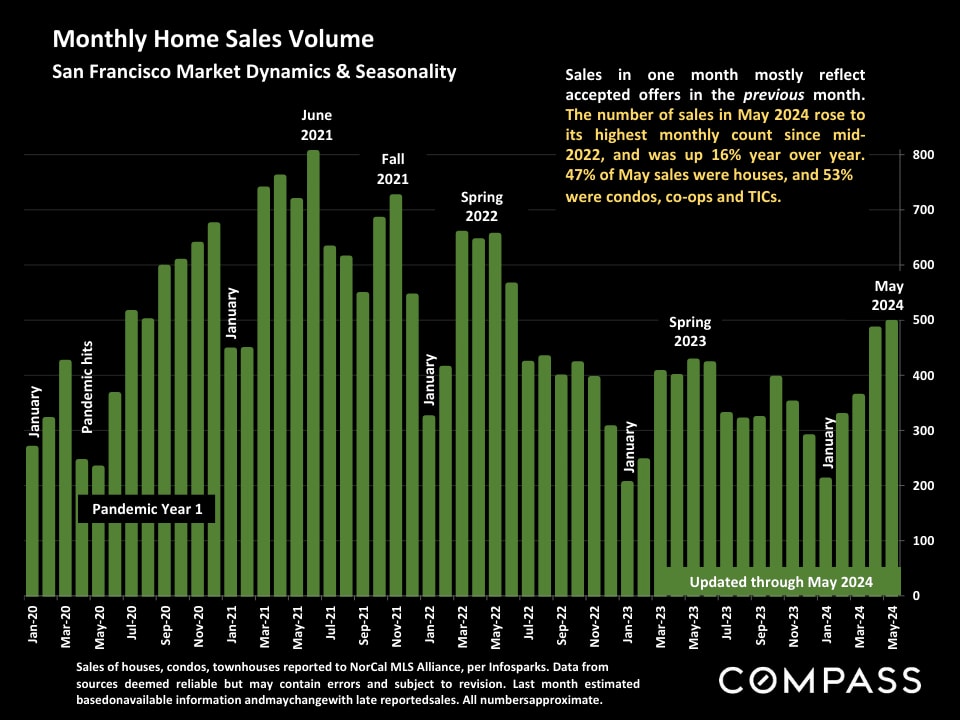
- Year over year, 2024 YTD home sales volume was up about 12% from 2023, while luxury home sales of $5 million+ soared 62%. 82% of house sales and 44% of condo sales sold for over asking price in May.
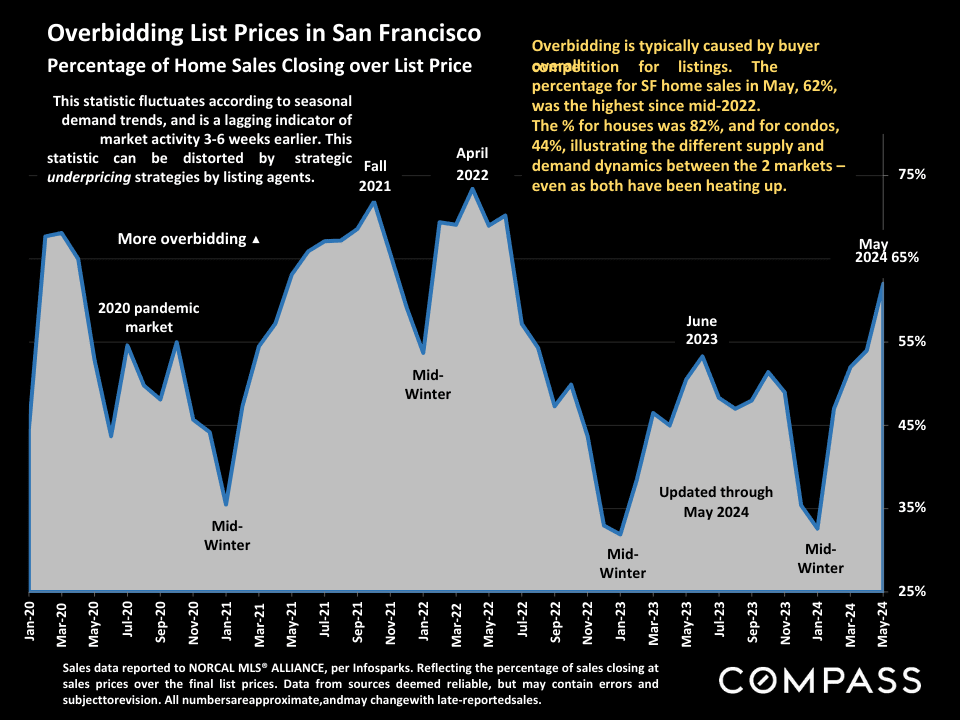
- House sales averaged a sales price almost 13% over asking price, while condos averaged a sale price about a half percent higher than the asking price. Both were the highest percentages since mid-2022. Average days on the market were the lowest in 12 months.
30-year-loan interest rates hovered around 7% in May and early June, which many buyers and sellers have clearly come to accept as the new normal. (And an estimated 30% to 40% of national homebuyers have been paying all cash.) Stock markets once again hit new all-time highs, with a substantial effect on household wealth. It is not unusual for home listing and sales activity to slow in summer.
Report created in good faith with data from sources deemed reliable, but may contain errors and subject to revision. Last period figures may change with late-reported activity. All numbers approximate. Mortgage interest rates vary according to the property, price, borrower and lender. Economic conditions can be subject to significant volatility, even over the short term.
San Francisco HOUSE Price Trends since 1990
Monthly Median House Sales Prices, 3-Month Rolling

San Francisco CONDO Price Trends since 2005
Median Condo Sales Price, 3-Month Rolling

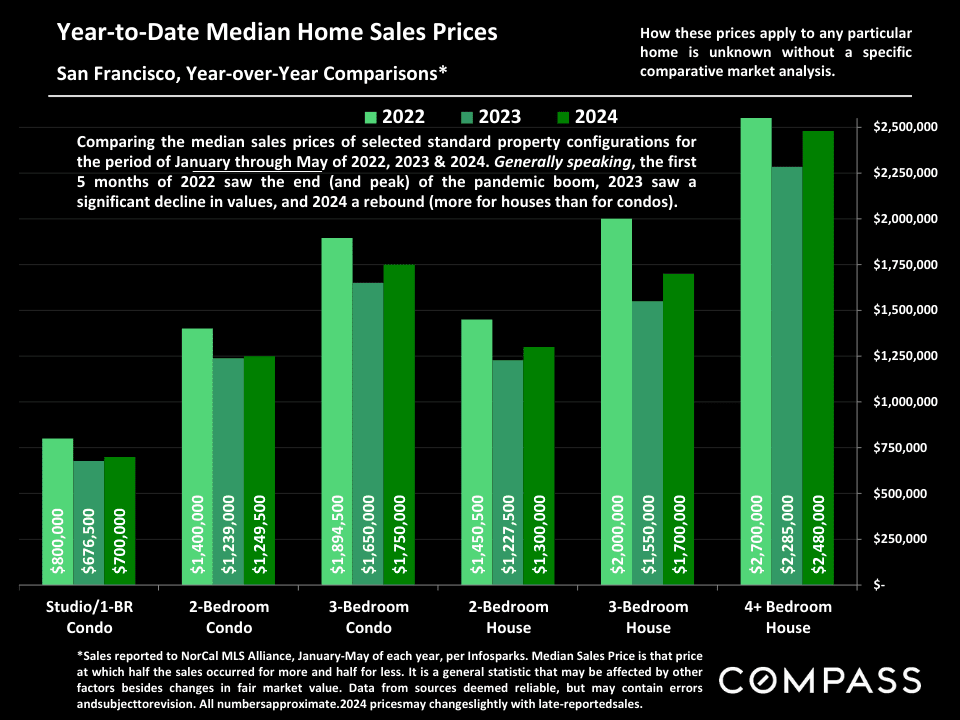
Year-to-Date Median Home Sales Prices
San Francisco, Year-over-Year Comparisons*
San Francisco Neighborhood Home Price Map
San Francisco CONDO Prices: Downtown vs. Non-Downtown
6-Month-Rolling, Median Condo Sales Prices since 2005*
Comparing median condo sales prices in the greater Downtown/South of Market/Civic Center area (the center of a large project, new condo construction, office buildings, and high-tech employment) – delineated by the white line – with the rest of San Francisco (mostly smaller, older buildings, in less urban environments) – delineated by the green line.

San Francisco Value Trends since 2005
3-Month Rolling, Median Dollar per Square Foot Values*
Median $/sq.ft. value is a general statistic, disguising an enormous range of values in the underlying sales. It is often affected by other factors besides changes in fair market value. Monthly and seasonal fluctuations are common, which explain many of the regular ups and downs in this chart.

New Listings Coming on the Market
San Francisco Market Dynamics & Seasonality

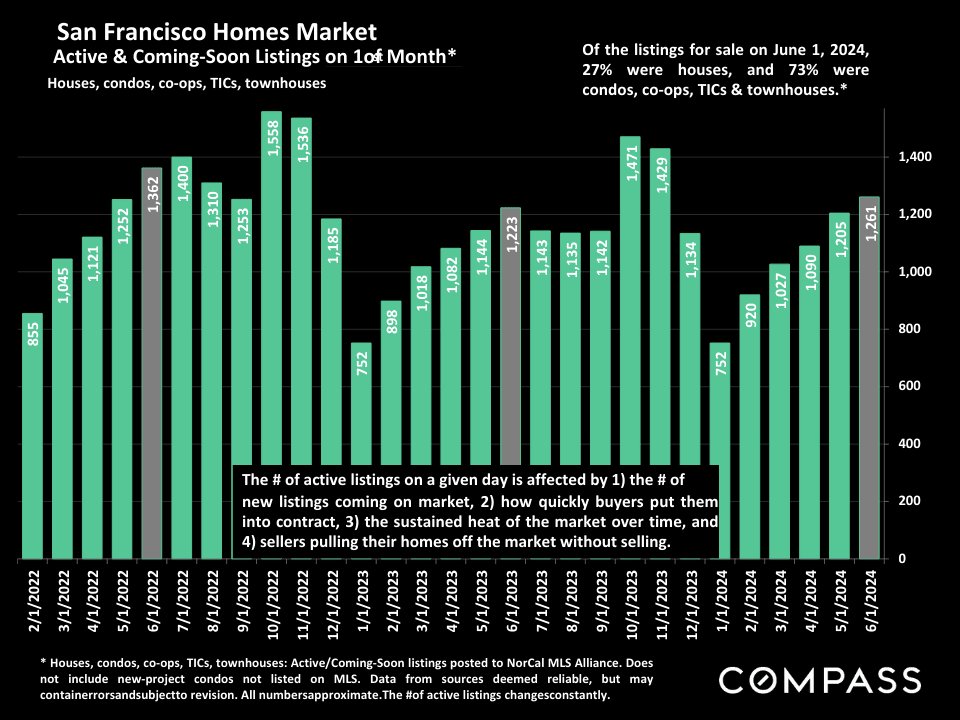
San Francisco Homes Market
Active & Coming-Soon Listings on 1st of Month*
Houses, condos, co-ops, TICs, townhouses
San Francisco: Homes for Sale
Active & Coming-Soon Listings by Price Segment*

San Francisco Home Sales Trends, 2021-2024
Year-over-Year, Year-to-Date Sales by Price Segment*
2024 YTD, condos, TICs & co-ops made up over 80% of sales under $1 million and about half of $1,000,000 to $1,999,999 sales.

Listings Accepting Offers (Going into Contract)
San Francisco Market Dynamics & Seasonality

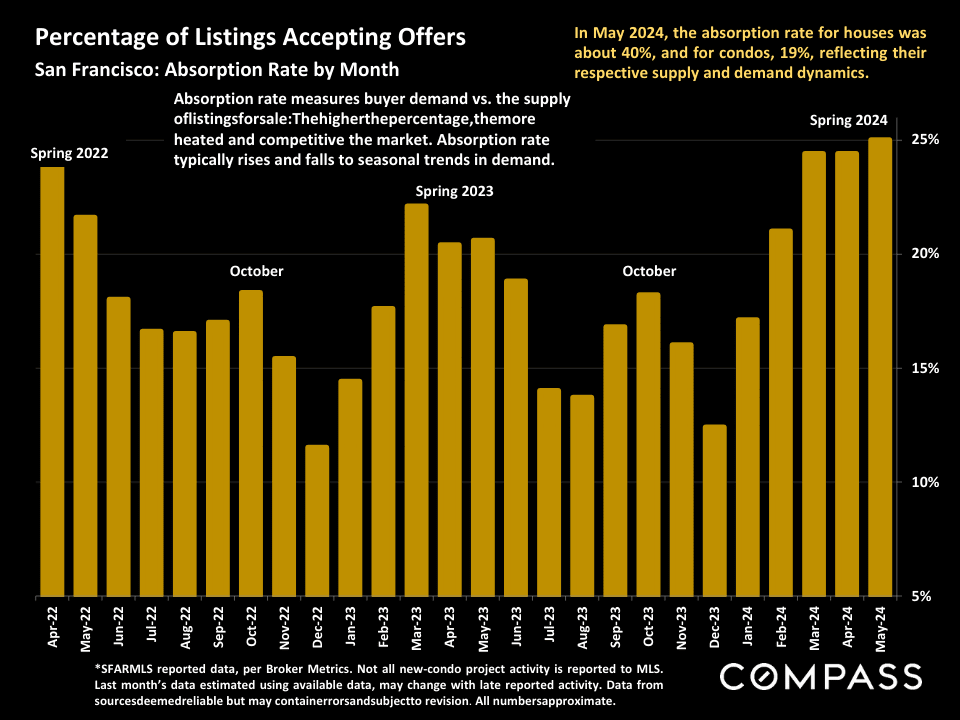
Percentage of Listings Accepting Offers
San Francisco: Absorption Rate by Month
Absorption rate measures buyer demand vs. the supply of listings for sale: The higher the percentage, the more heated and competitive the market. The absorption rate typically rises and falls to seasonal trends in demand.
Monthly Home Sales Volume
San Francisco Market Dynamics & Seasonality
San Francisco Market Dynamics & Seasonality
Homes Selling for $5 Million+
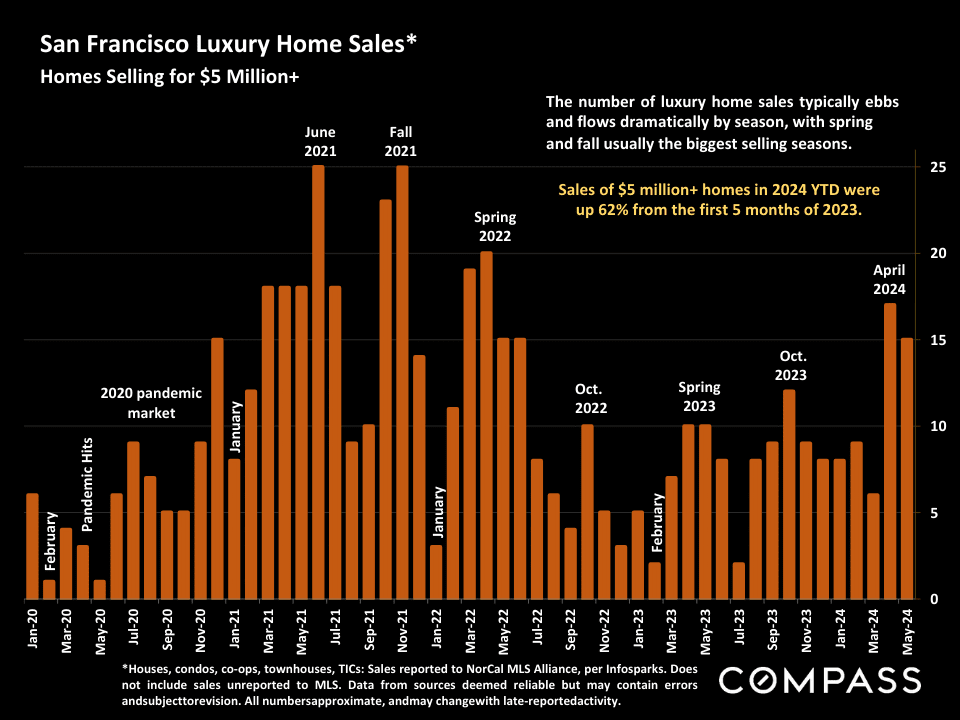
San Francisco Higher Price & Luxury HOUSE Market
House Sales of $4,000,000+, by District, 12 Months Sales*

San Francisco Luxury CONDO, CO-OP, TIC & TOWNHOUSE Market
Sales Prices of $2.5 Million+, by District, 12 Months Sales*

San Francisco Bay Area Luxury Home Market

Average Days on Market – Speed of Sale
San Francisco Market Dynamics & Seasonality

Overbidding List Prices in San Francisco
Percentage of Home Sales Closing over List Price
This statistic fluctuates according to seasonal demand trends and is a lagging indicator of market activity 3-6 weeks earlier. This statistic can be distorted by strategic underpricing strategies by listing agents.
Average Sales Price to Original List Price Percentage
San Francisco Over/Under Bidding: Market Dynamics & Seasonality

San Francisco Over/Under Bidding: Market Dynamics & Seasonality
San Francisco Over/Under Bidding: Market Dynamics & Seasonality
Statistics are generalities, essentially summaries of widely disparate data generated by dozens, hundreds or thousands of unique, individual sales occurring within different time periods. They are best seen not as precise measurements, but as broad, comparative indicators, with reasonable margins of error. Anomalous fluctuations in statistics are not uncommon, especially in smaller, expensive market segments. Last-period data should be considered estimates that may change with late-reported data. Different analytics programs sometimes define statistics – such as “active listings,” “days on market,” and “months supply of inventory” – differently: what is most meaningful are not specific calculations but the trends they illustrate. Most listing and sales data are derived from the local or regional multi-listing service (MLS) of the area specified in the analysis, but not all listings or sales are reported to MLS and these won’t be reflected in the data. “Homes” signifies real-property, single-household housing units: houses, condos, co-ops, townhouses, duets and TICs (but not mobile homes), as applicable to each market. City/town names refer specifically to the named cities and towns unless otherwise delineated. Multi-county metro areas will be specified as such. Data from sources deemed reliable, but may contain errors and subject to revision. All numbers to be considered approximate.
Many aspects of value cannot be adequately reflected in median and average statistics: curb appeal, age, condition, amenities, views, lot size, quality of outdoor space, “bonus” rooms, additional parking, quality of location within the neighborhood, and so on. How any of these statistics apply to any particular home is unknown without a specific comparative market analysis.
Median Sales Price is that price at which half the properties sold for more and half for less. It may be affected by seasonality, “unusual” events, or changes in inventory and buying trends, as well as by changes in fair market value. The median sales price for an area will often conceal an enormous variety of sales prices in the underlying individual sales.
Dollar per Square Foot is based upon the home’s interior living space and does not include garages, unfinished attics and basements, rooms built without permit, patios, decks or yards (though all those can add value to a home). These figures are usually derived from appraisals or tax records, but are sometimes unreliable (especially for older homes) or unreported altogether. The calculation can only be made on those home sales that reported square footage.
Photo use under the Creative Commons License: https://creativecommons.org/licenses/by-sa/2.0/
Compass is a real estate broker licensed by the State of California, DRE 01527235. Equal Housing Opportunity. This report has been prepared solely for information purposes. The information herein is based on or derived from information generally available to the public and/or from sources believed to be reliable. No representation or warranty can be given with respect to the accuracy or completeness of the information. Compass disclaims any and all liability relating to this report, including without limitation any express or implied representations or warranties for statements contained in, and omissions from, the report. Nothing contained herein is intended to be or should be read as any regulatory, legal, tax, accounting or other advice and Compass does not provide such advice. All opinions are subject to change without notice. Compass makes no representation regarding the accuracy of any statements regarding any references to the laws, statutes or regulations of any state are those of the author(s). Past performance is no guarantee of future results.
