April 2022 Multi-Family Market Report for Residential 5+ Unit Buildings
The first quarter of 2022 saw gradual increases in employment, office occupancy and rental rates in San Francisco, and Covid restrictions have loosened substantially, all positives for the residential income property market. But mortgage interest rates soared, especially towards the end of the quarter, which substantially increases the cost of ownership for buyers. Q1 2022 sales volume ran close to first quarter volumes in recent years, but market activity typically picks up significantly in Q2. We have calculated a variety of value statistics on the Q1 market, but they should be considered very preliminary until a larger number of sales close in 2022. There are also some analyses based on the last 12 months of sales.
5+ unit residential income buildings. Sales reported to SF and NorCal MLS. This market consists of a relatively small number of sales, of buildings of widely varying sizes, qualities and financial characteristics, across a broad range of locations: This makes meaningful statistical analysis more difficult. Data from sources deemed reliable, but may contain errors and subject to revision. Q1 2022 numbers are estimates using data available in early April 2022: Late reported sales may alter these numbers. All numbers approximate.
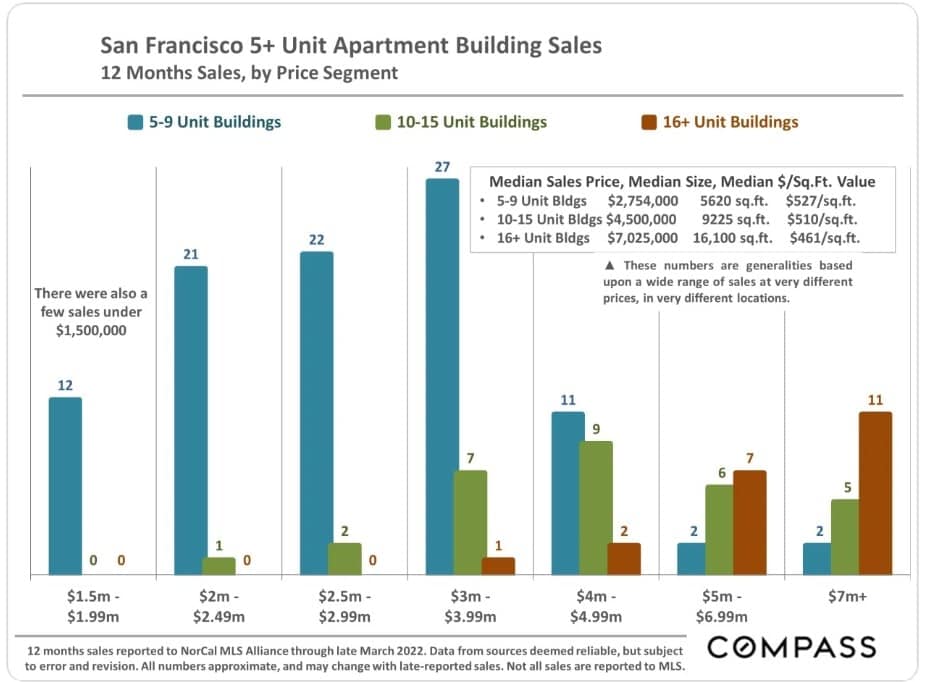
San Francisco 5+ Unit Apartment Building Sales
12 Months Sales, by Price Segment
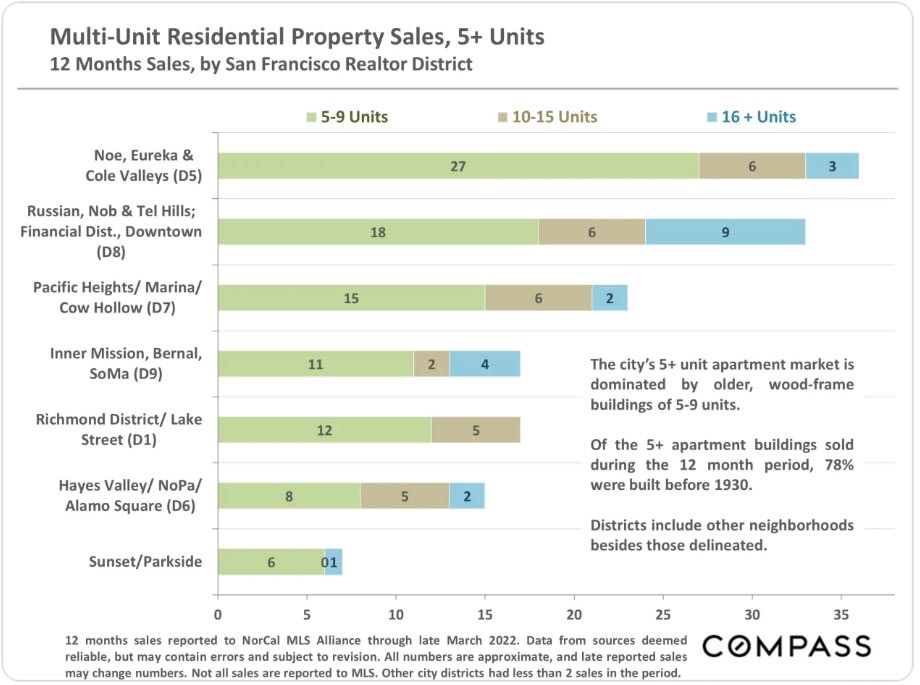
Multi-Unit Residential Property Sales, 5+ Units
12 Months Sales, by San Francisco Realtor District
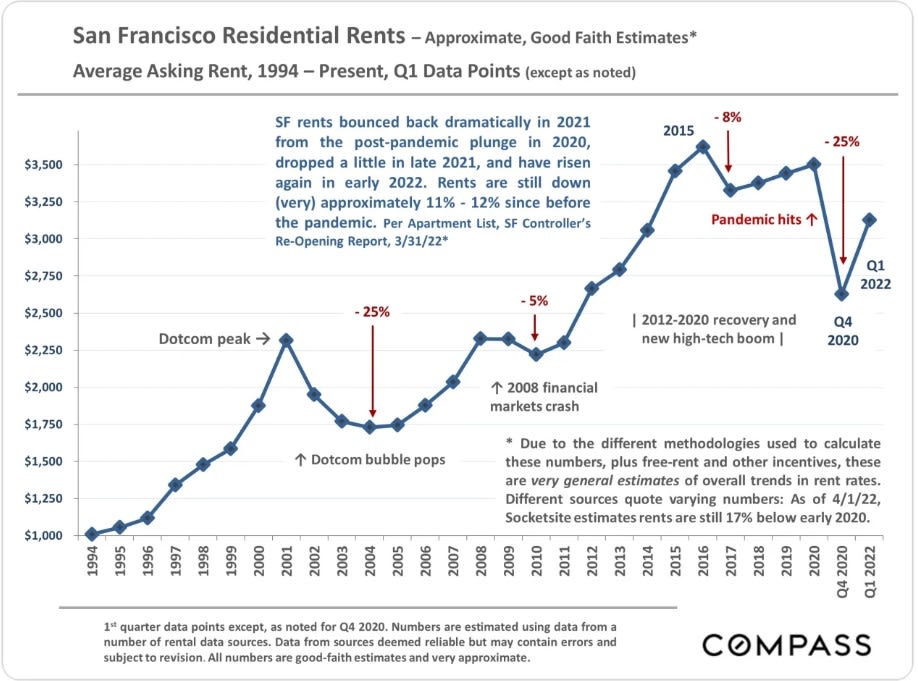
San Francisco Residential Rents - Approximate, Good Faith Estimates*
Average Asking Rent, 1994 - Present, Q1 Data Points (except as noted)
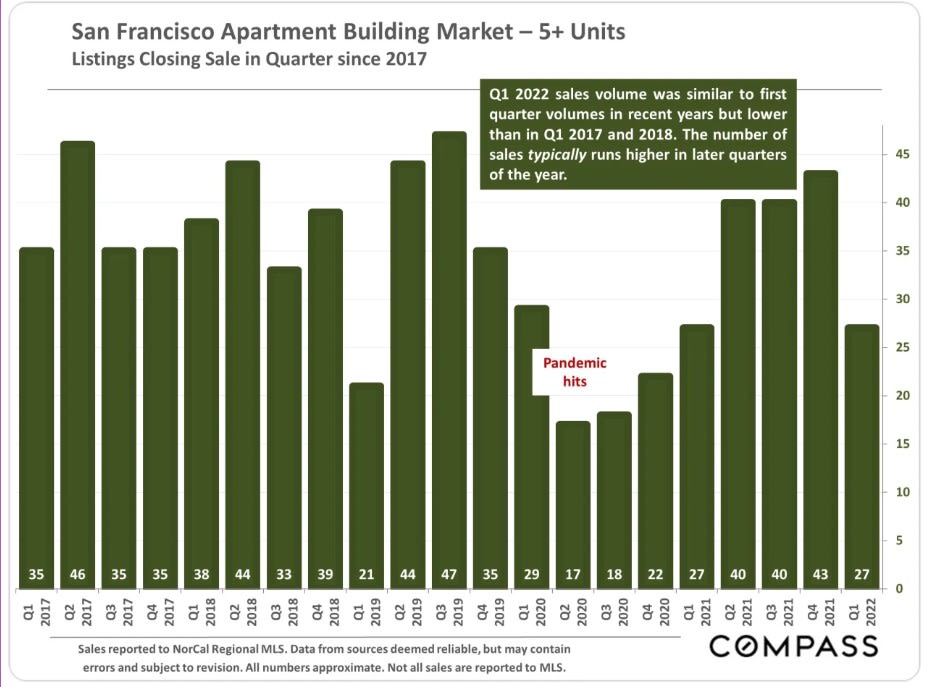
San Francisco Apartment Building Market - 5+ Units
Listings Closing Sale in Quarter since 2017
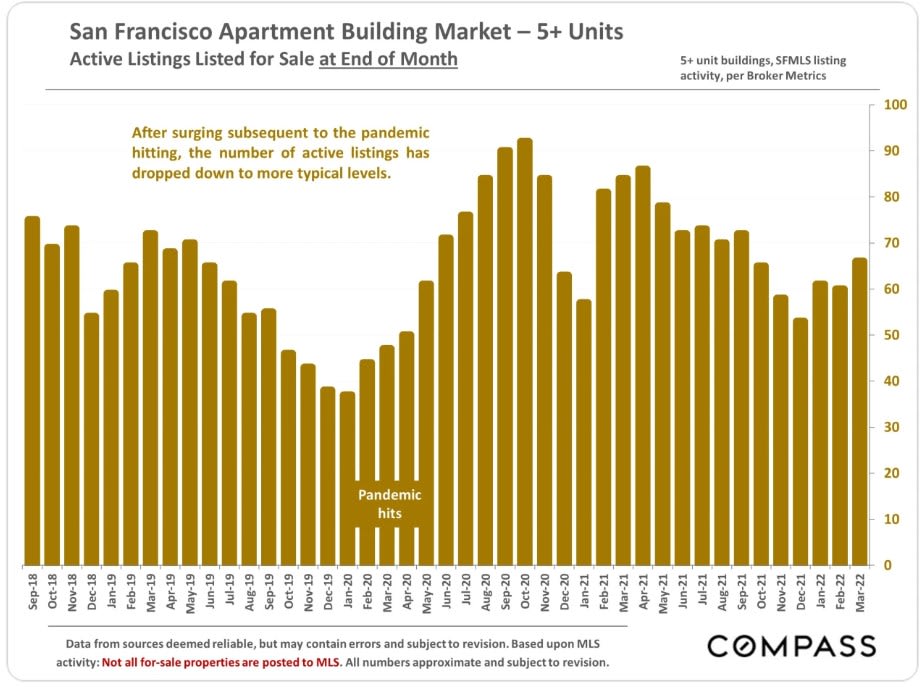
San Francisco Apartment Building Market - 5+ Units
Active Listings Listed for Sale at End of Month
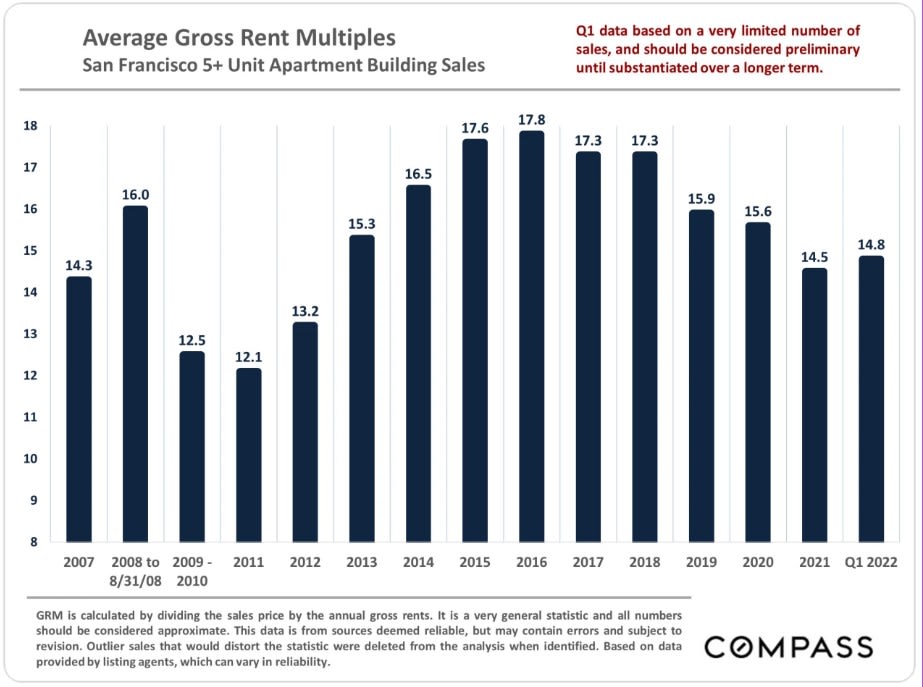
Average Gross Rent Multiples
San Francisco 5+ Unit Apartment Building Sales
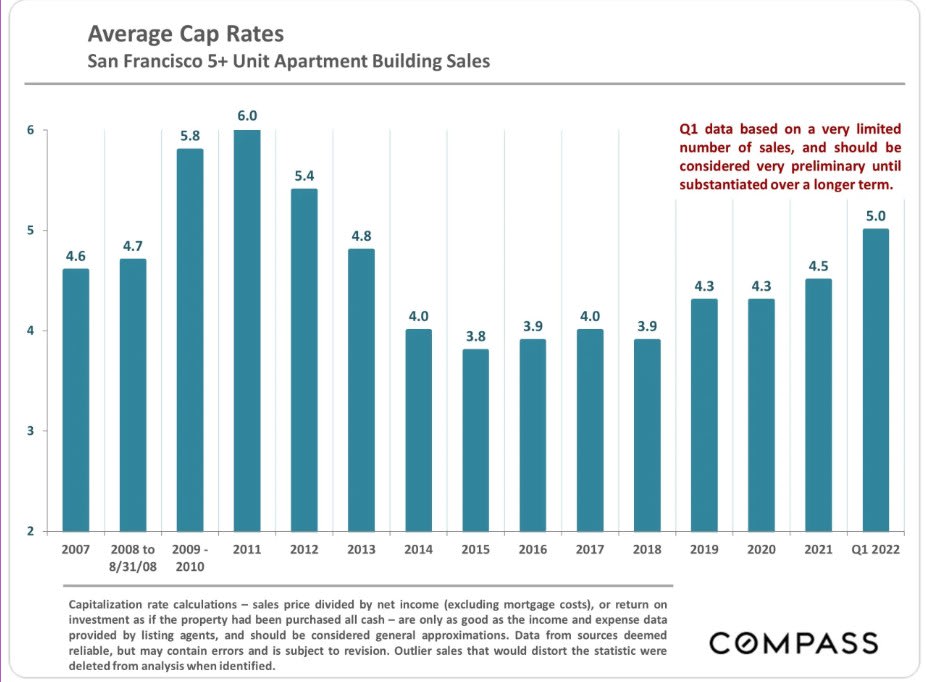
Average Cap Rates
San Francisco 5+ Unit Apartment Building Sales
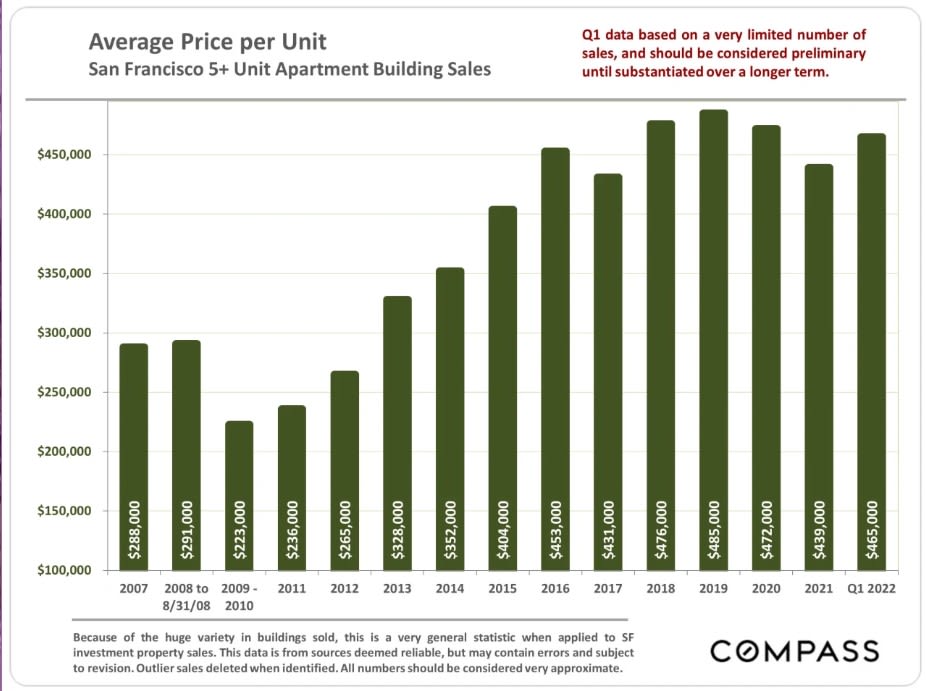
Average Price per Unit
San Francisco 5+ Unit Apartment Building Sales
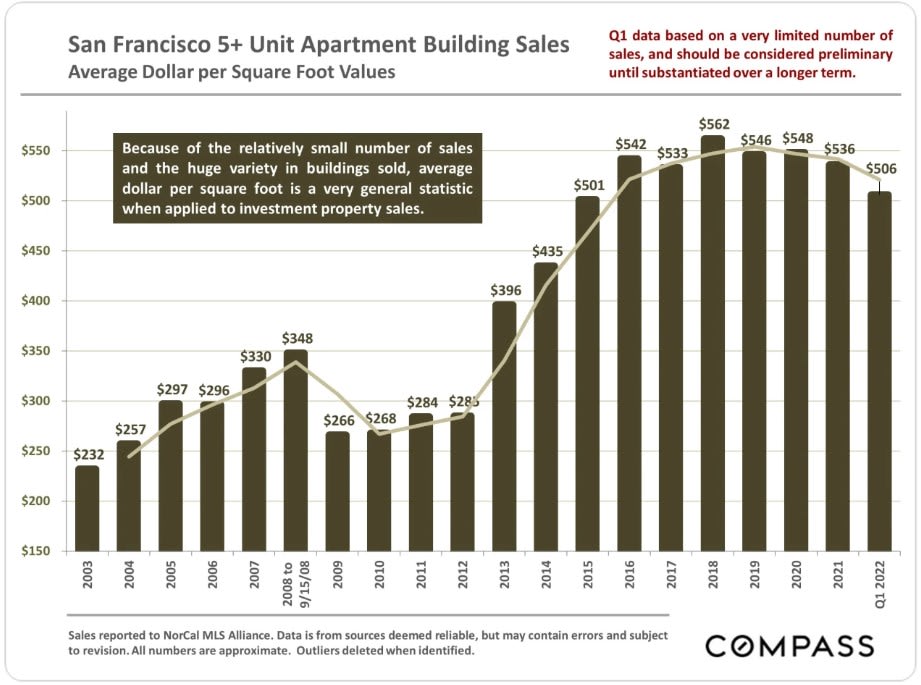
San Francisco 5+ Unit Apartment Building Sales
Average Dollar per Square Foot Values
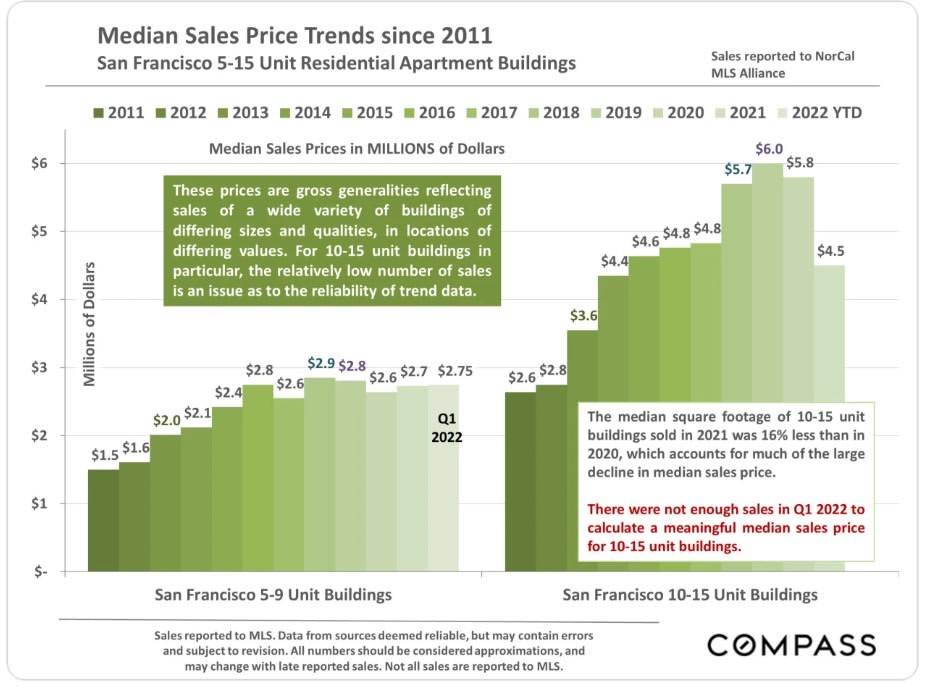
Median Sales Price Trends since 2011
San Francisco 5-15 Unit Residential Apartment Buildings
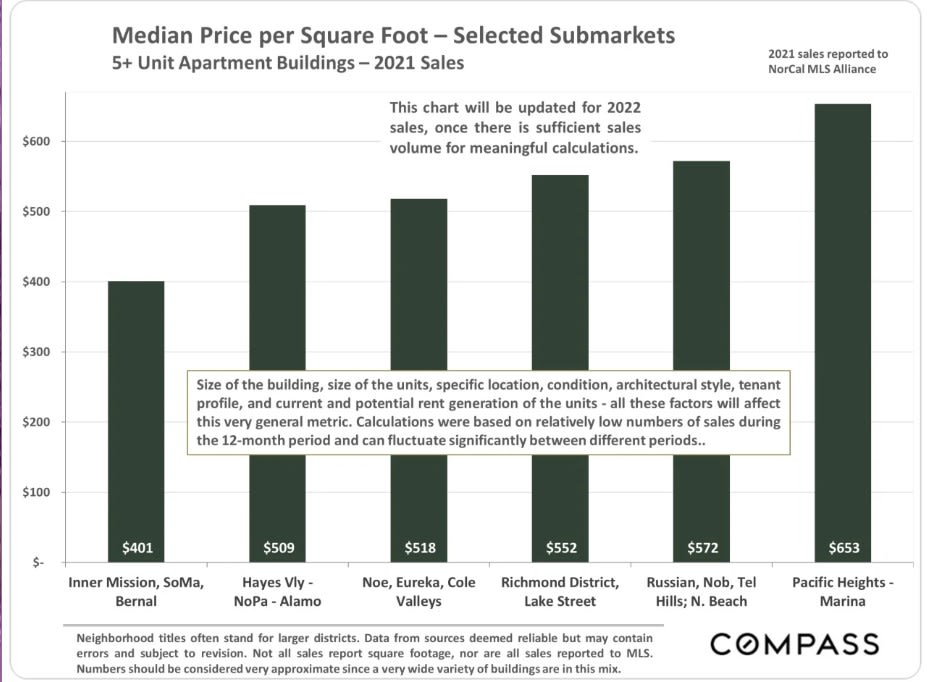
Median Price per Square Foot - Selected Submarkets
5+ Unit Apartment Buildings - 2021 Sales
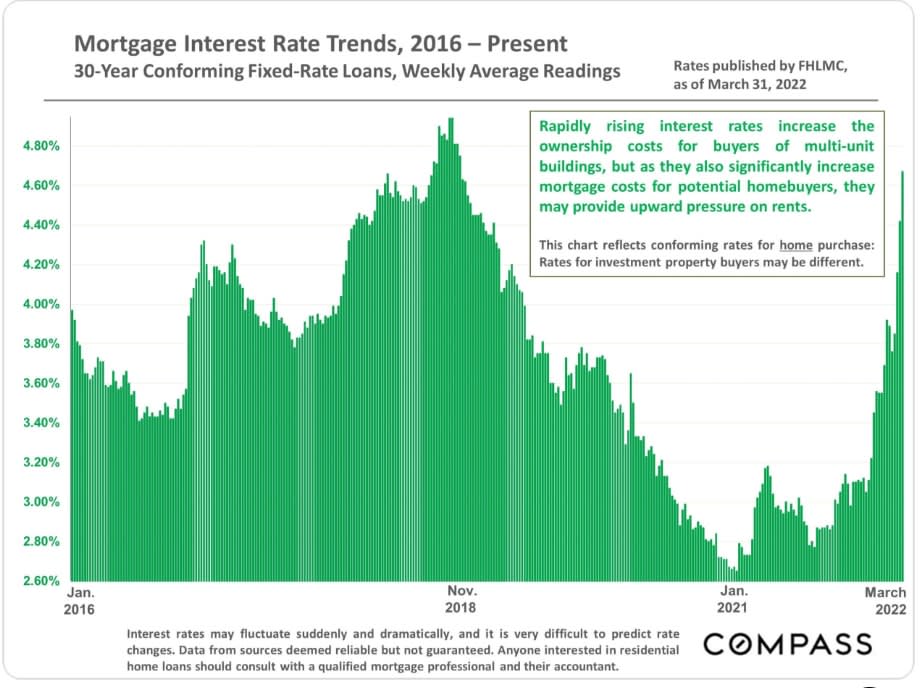
Mortgage Interest Rate Trends, 2016 - Present
30 - Year Conforming Fixed-Rate Loans, Weekly Average Readings
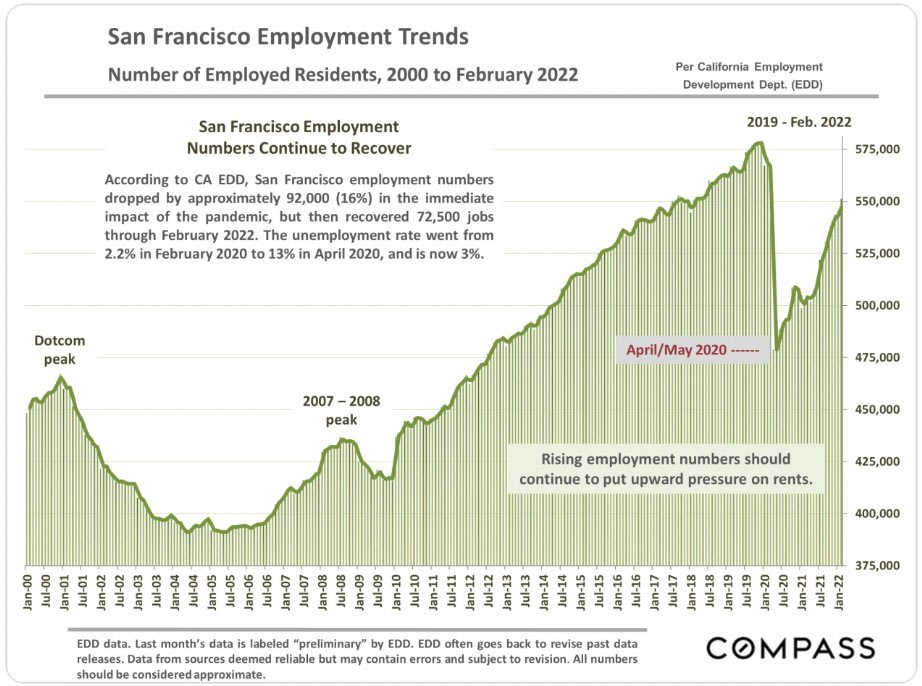
San Francisco Employment Trends
Number of Employed Residents, 2000 to February 2022
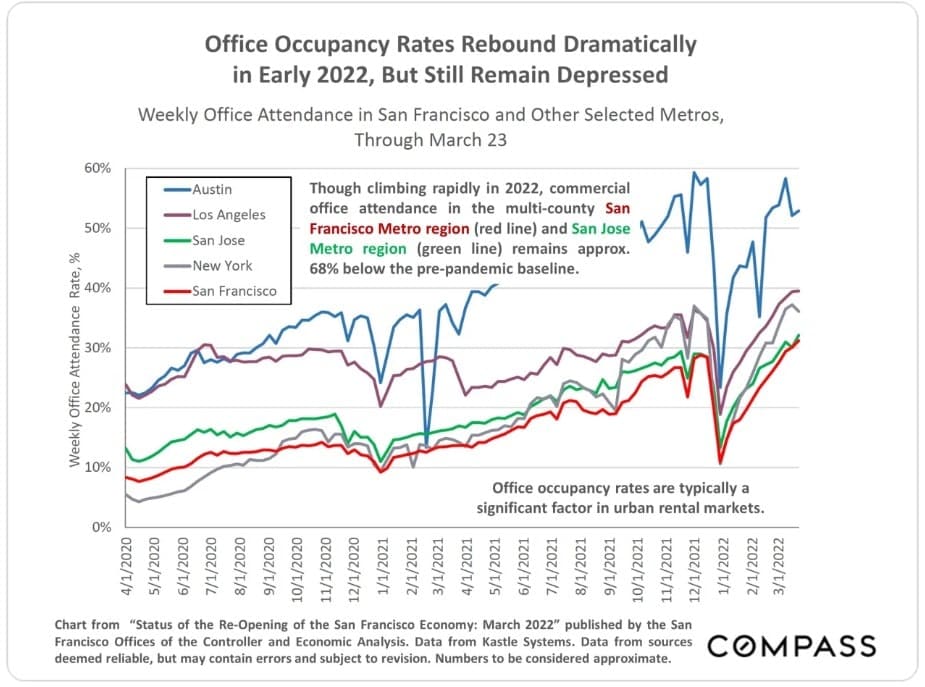
Office Occupancy Rates Rebound Dramatically in Early 2022, But Still Remain Depressed
Weekly Office Attendance in San Francisco and Other Selected Metros, Through March 23
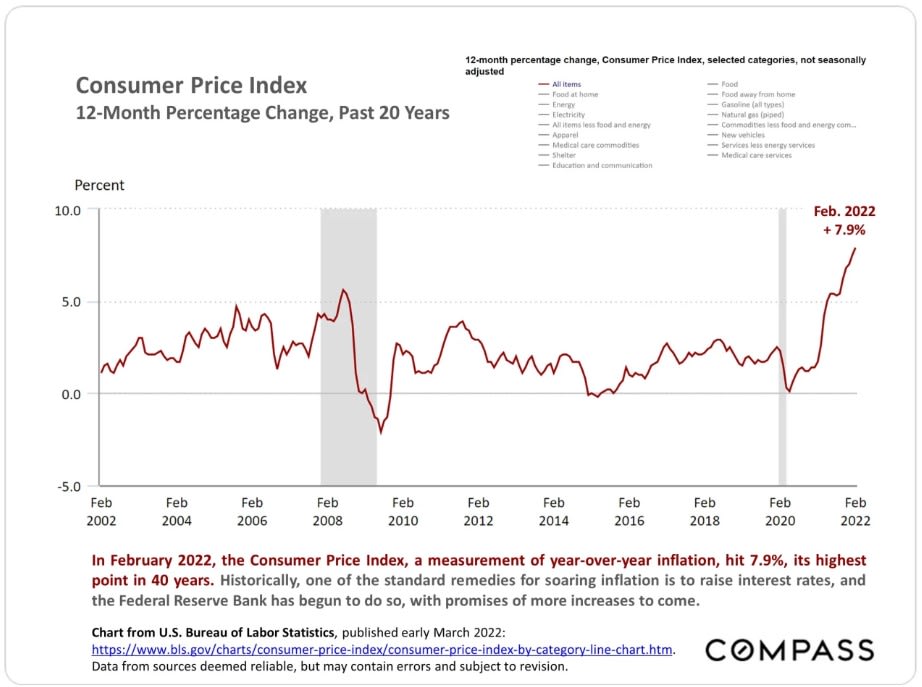
Consumer Price Index
12- Month Percentage Change, Past 20 Years
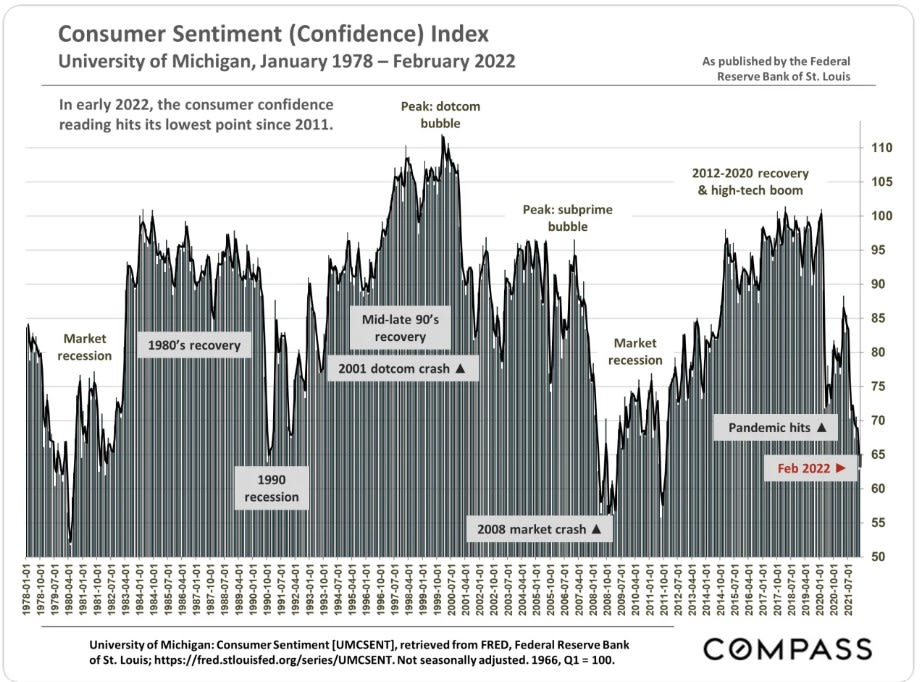
Consumer Sentiment (Confidence) Index
University of Michigan, January 1978 - February 2022
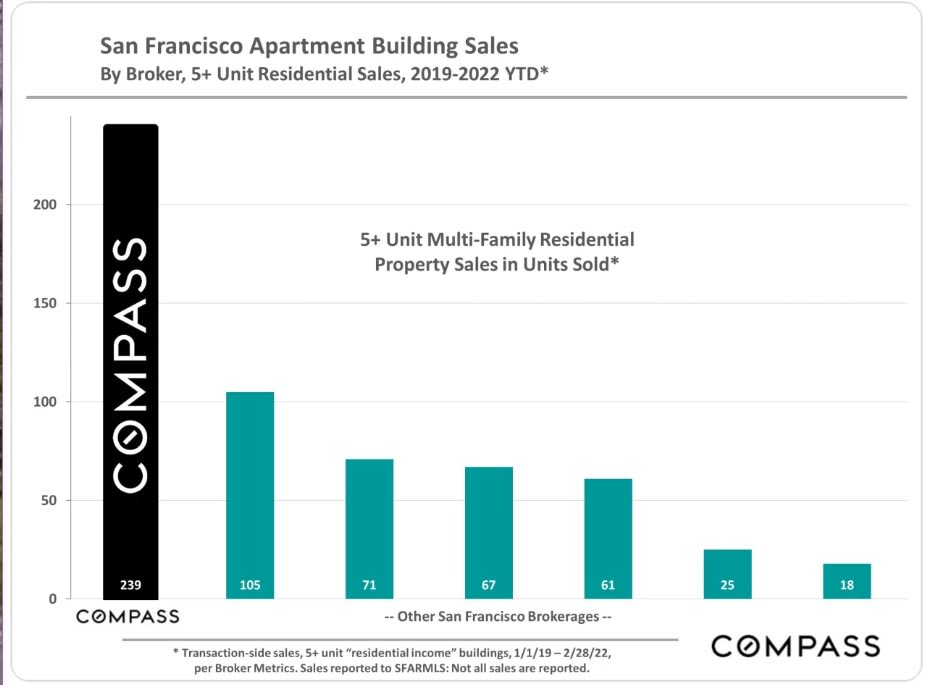
San Francisco Apartment Building Sales
By Broker, 5+ Unit Residential Sales, 2019-2022 YTD*
Note that the quantity of sales in any given local submarket is usually relatively small and/or the number of sales that report the necessary financial information can be limited. Buildings of different ages, qualities and sizes selling in different periods can cause these average and median figures to fluctuate significantly. Furthermore, the reliability of some of these calculations depends upon the quality of the income and expense figures provided by the listing agents, and sometimes instead of actual members, much less meaningful projected or scheduled figures are used. Late reported listings and sales may change these statistics. Therefore, the above statistics should be considered very general indicators, and how they apply to any particular property without a specific comparative market analysis is unknown.
These analyses were made in good faith with data from sources deemed reliable, but they may contain errors and are subject to revision. Statistics are generalities and all numbers should be considered approximate.
Compass is a real estate broker licensed by the State of California, DRE 01527235. Equal Housing Opportunity. This report has been prepared solely for information purposes. The information herein is based on or derived from information generally available to the public and/or from sources believed to be reliable. No representation or warranty can be given with respect to the accuracy or completeness of the information. Compass disclaims any and all liability relating to this report, including without limitation any express or implied representations or warranties for statements contained in, and omissions from, the report. Nothing contained herein is intended to be or should be read as any regulatory, legal, tax, accounting or other advice and Compass does not provide such advice. Al opinions are subject to change without notice. Compass makes no representation regarding the accuracy of any statements regarding any references to the laws, statutes or regulations of any state are those of the author(s). Past performance is no guarantee of future results.
