January 2021 Market Report for Residential 5+ Unit Buildings
Pandemic, shelter in place, unemployment soars, terrible financial hardships for many residents and small businesses, new ways of working, office buildings empty, people move, vacancy rates climb, rents plunge, sales drop, rigorous limits on evictions, new landlord-tenant laws, dreadful fires, an anxious presidential election, interest rates to historic lows, stock markets to new highs, and IPO mania breaks out again. A year of extremes and a challenging year for the residential income market.
5+ unit residential income buildings. Sales reported to MLS. This market consists of a relatively small number of sales, of buildings of widely varying sizes, qualities and financial characteristics, across a broad range of locations: This makes meaningful statistical analysis more difficult. Data from sources deemed reliable, but may contain errors and subject to revision. 2020 numbers are estimates using data available in early 2021: Late reported sales may alter these numbers. All numbers are approximate.
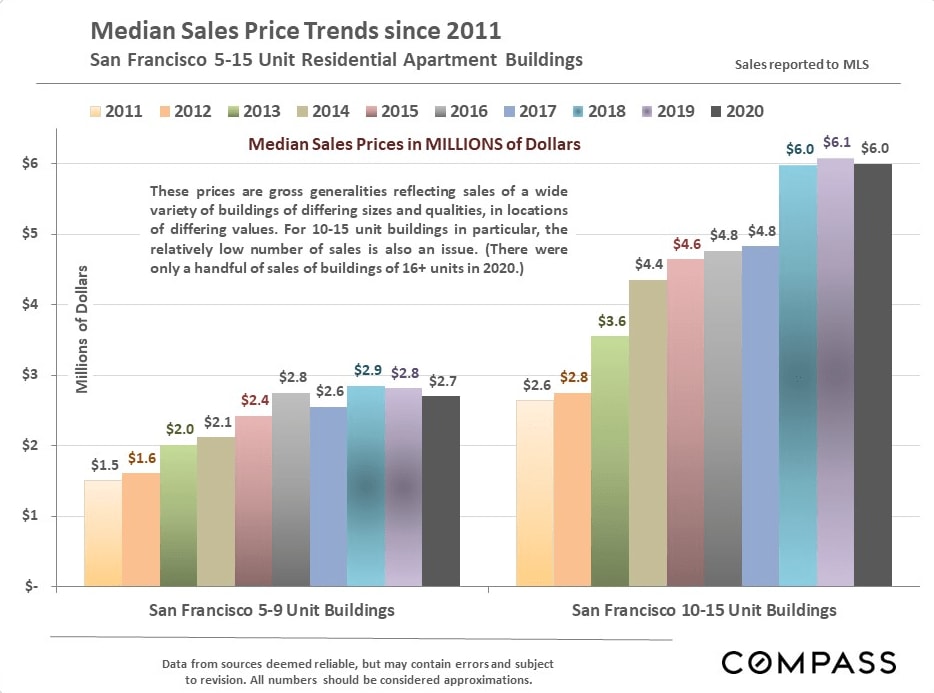
Median Sales Price Trends since 2011
San Francisco 5-15 Unit Residential Apartment Buildings
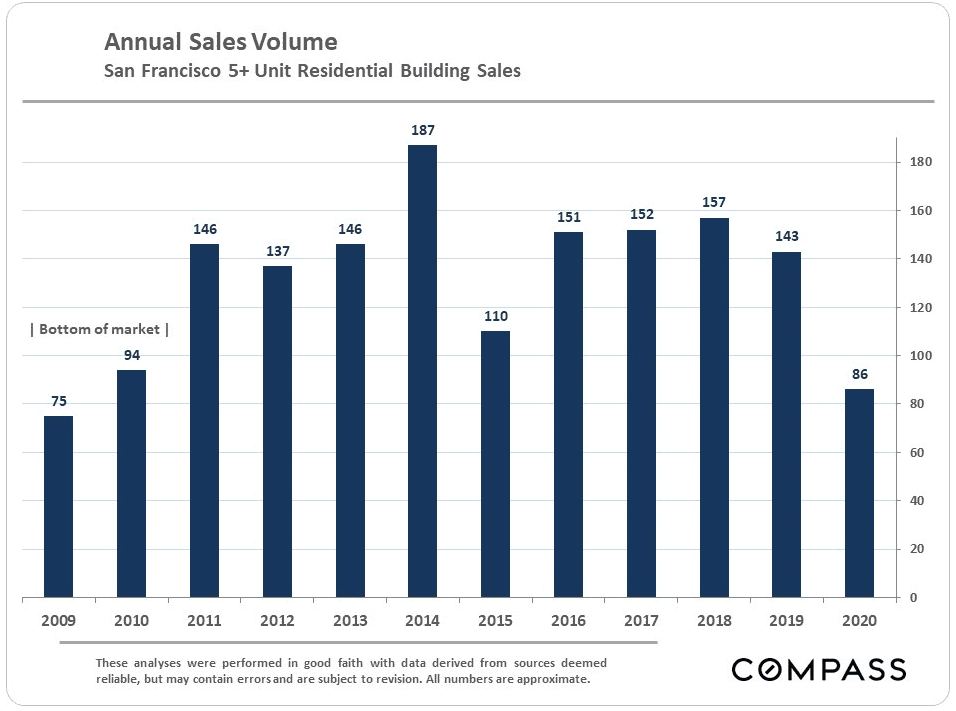
Annual Sales Volume
San Francisco 5+ Unit Residential Building Sales
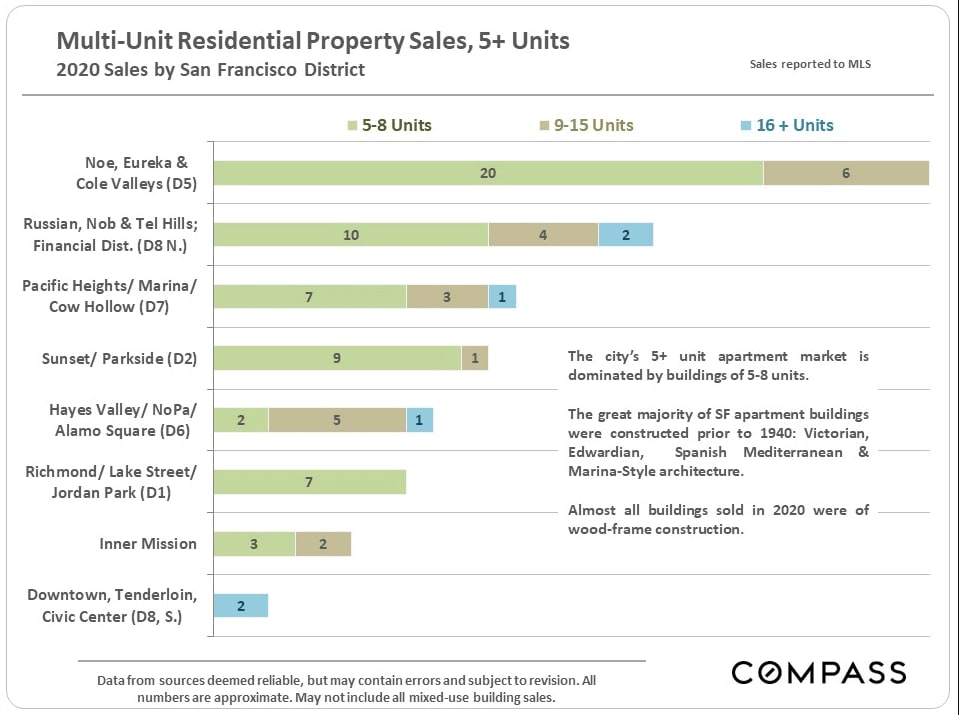
Multi-Unit Residential Property Sales, 5+ Units
2020 Sales by San Francisco District
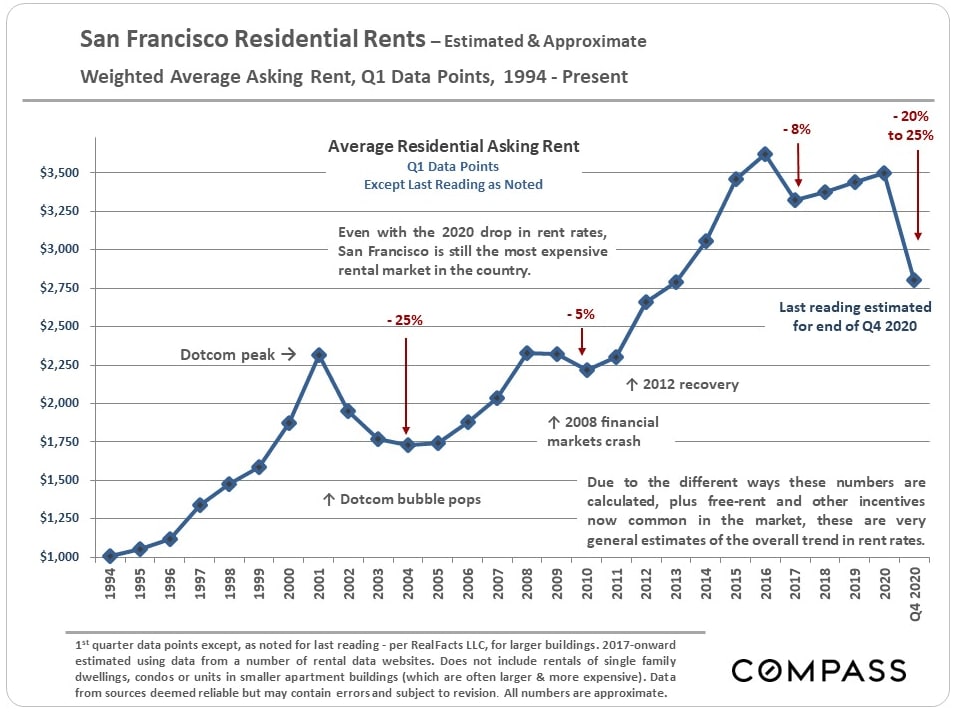
San Francisco Residential Rents - Estimated & Approximate
Weighted Average Asking Rent, Q1 Data Points, 1994 - Present
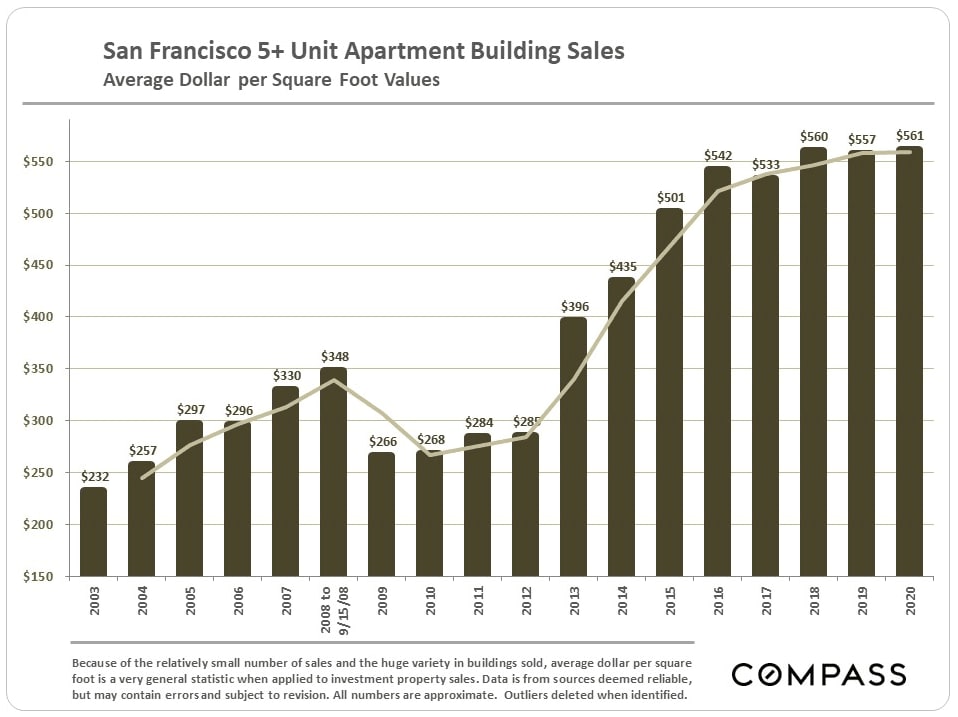
San Francisco 5+ Unit Apartment Building Sales
Average Dollar per Square Foot Values
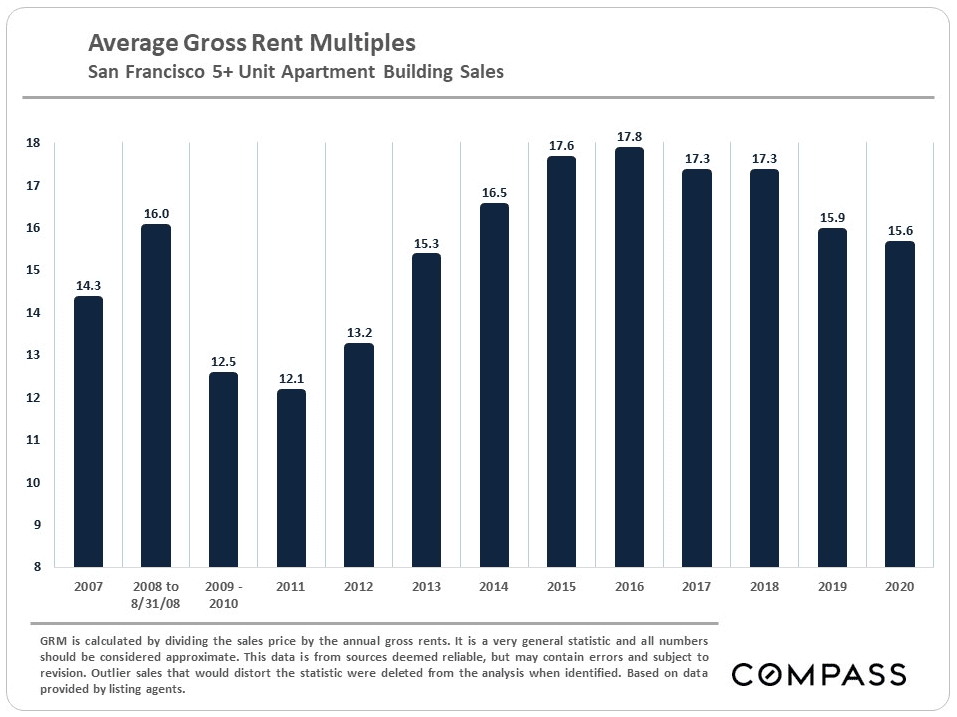
Average Gross Rent Multiples
San Francisco 5+ Unit Apartment Building Sales
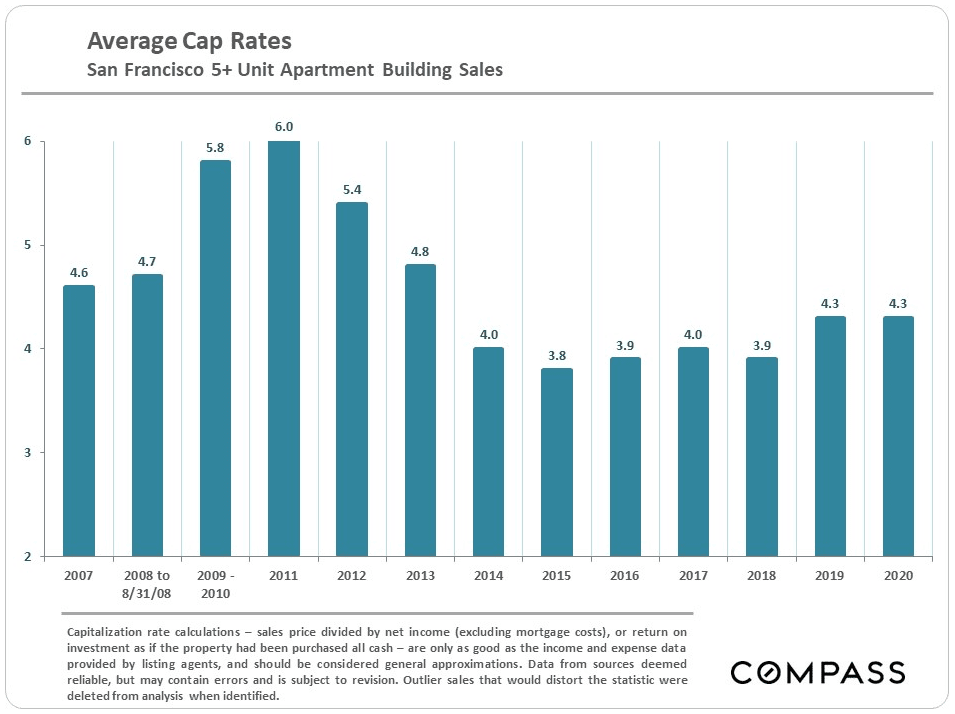
Average Cap Rates
San Francisco 5+ Unit Apartment Building Sales
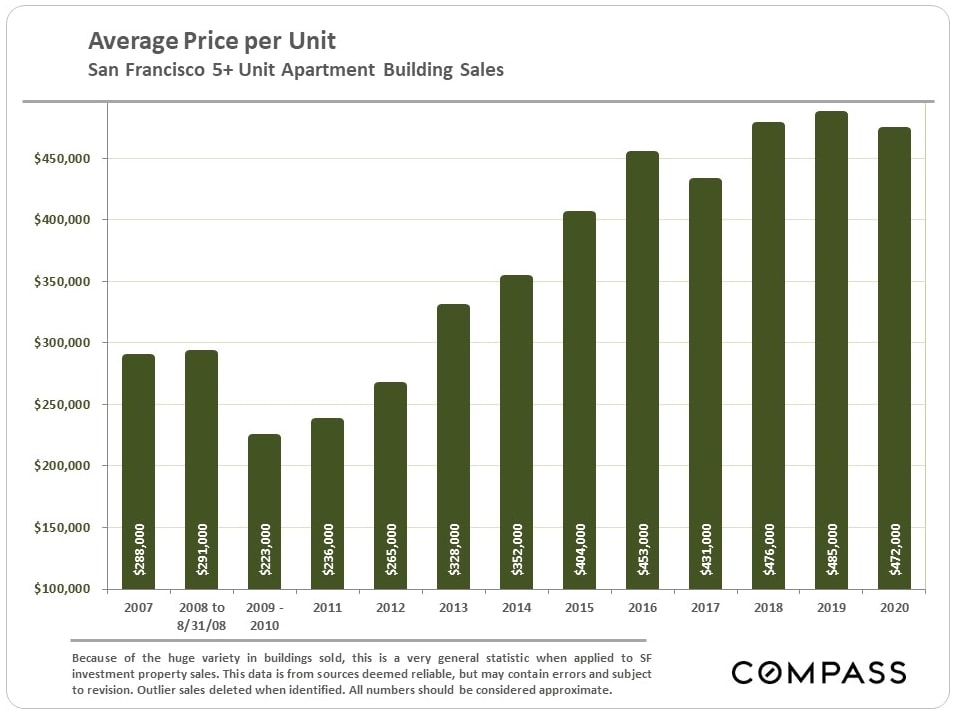
Average Price per Unit
San Francisco 5+ Unit Apartment Building Sales
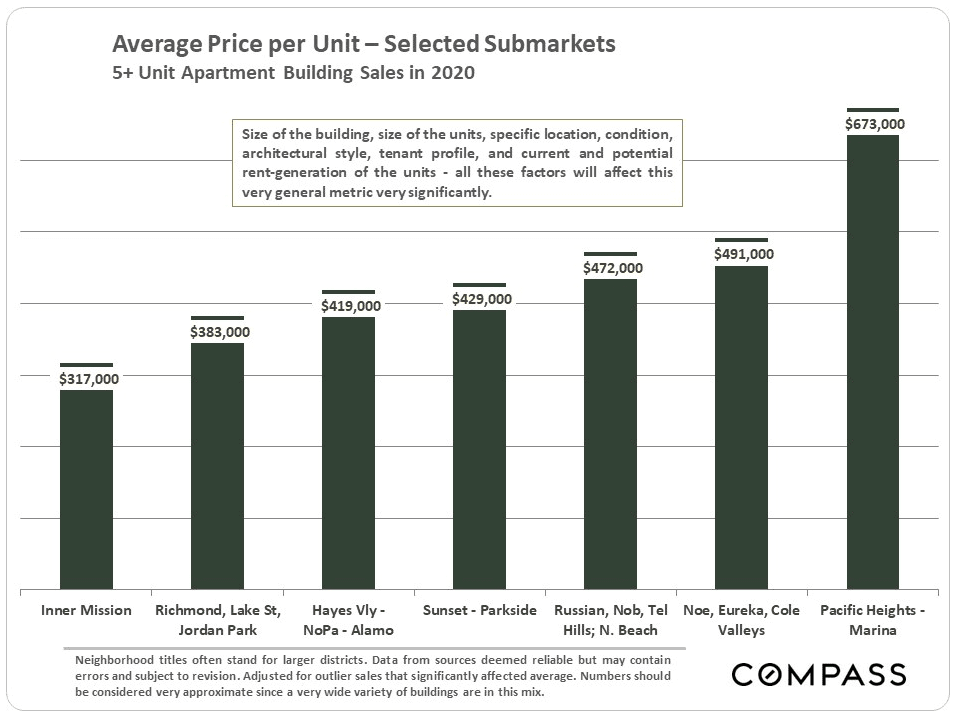
Average Price per Unit - Selected Submarkets
5+ Unit Apartment Building Sales in 2020
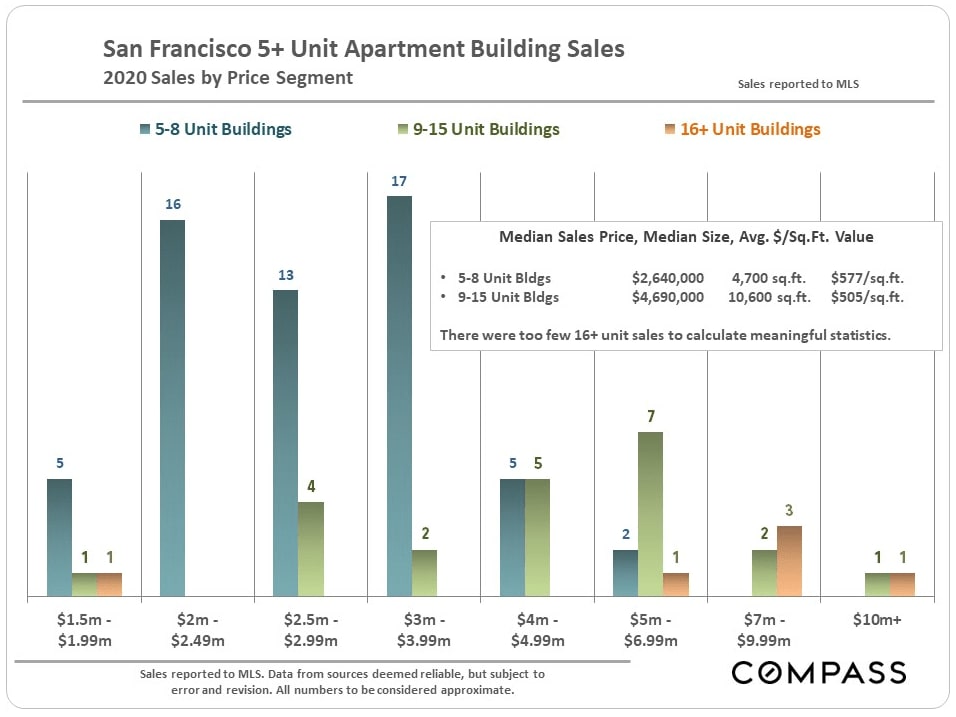
San Francisco 5+ Unit Apartment Building Sales
2020 Sales by Price Segment
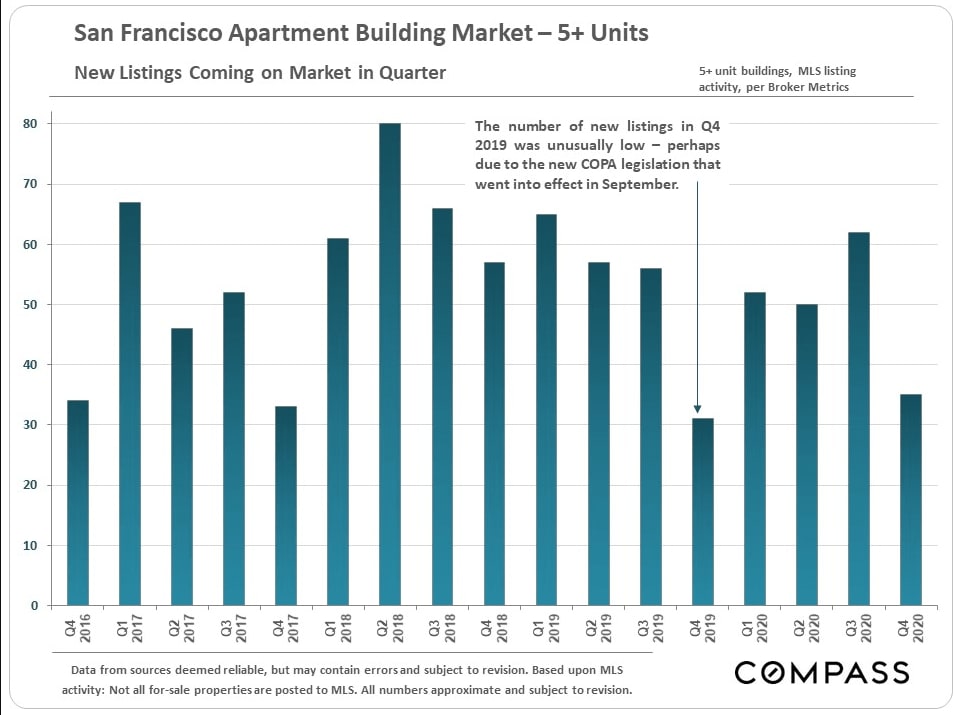
San Francisco Apartment Building Market - 5+ Units
New Listings Coming on Market in Quarter
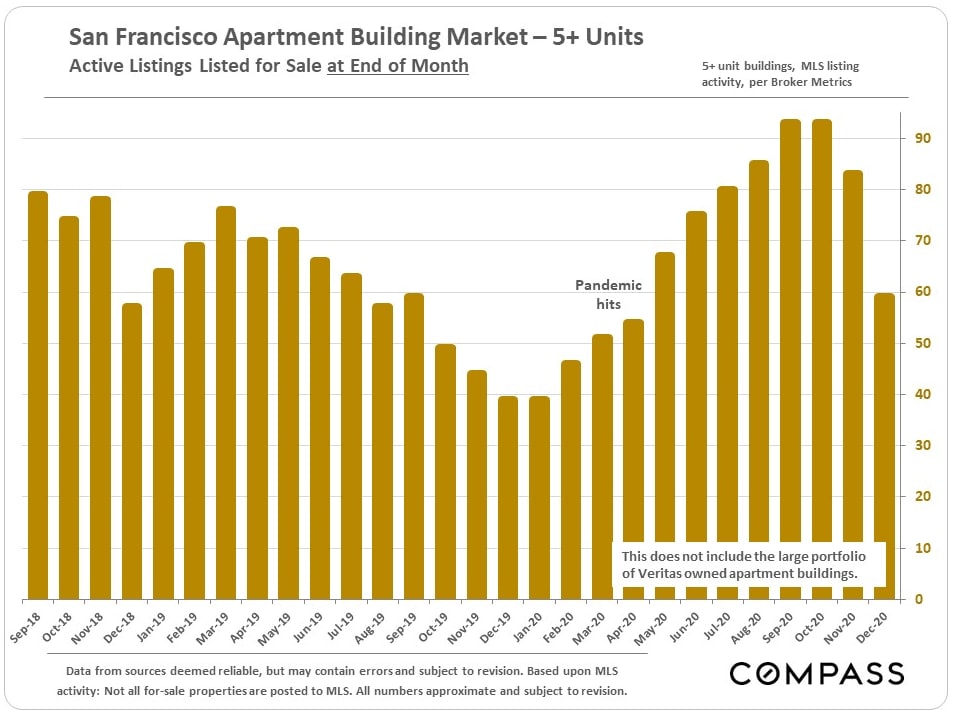
San Francisco Apartment Building Market - 5+ Units
Active Listings Listed for Sale at End of Month
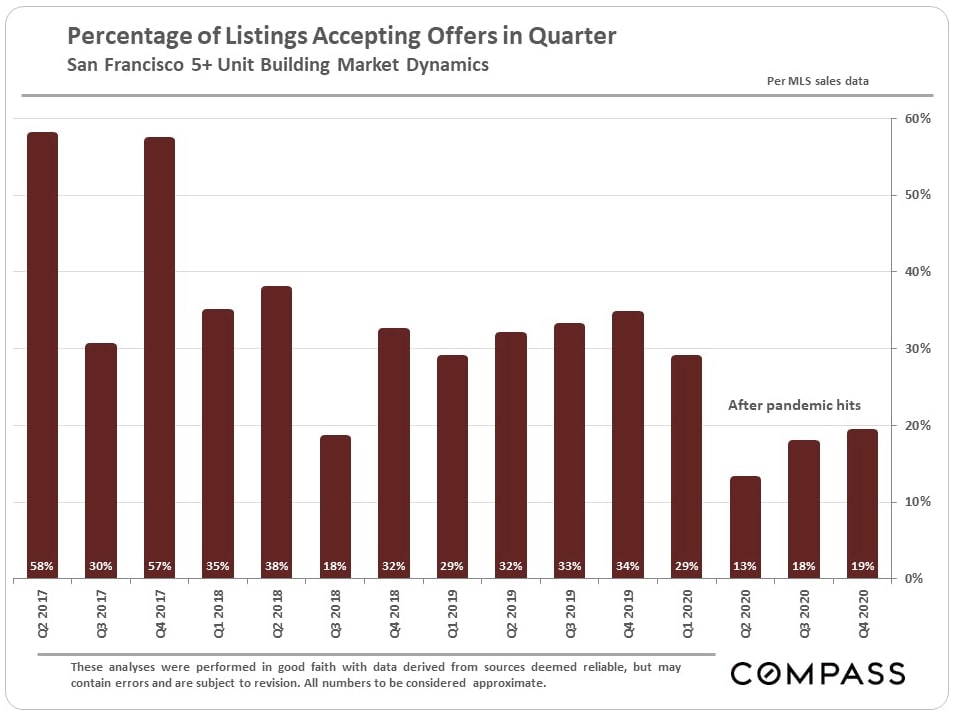
Percentage of Listings Accepting Offers in Quarter
San Francisco 5+ Unit Building Market Dynamics
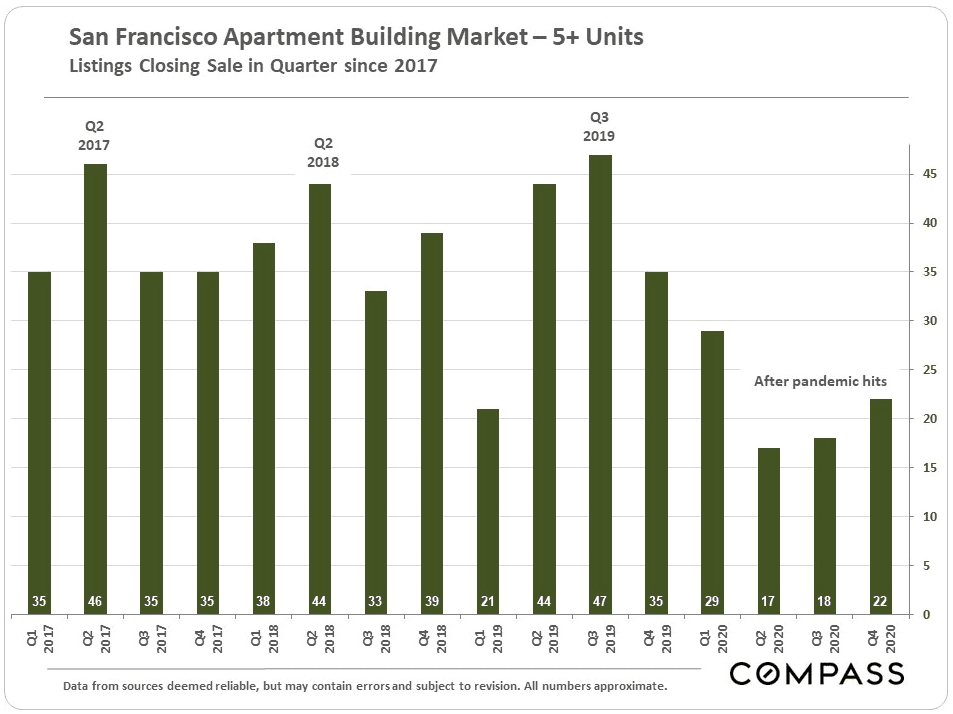
San Francisco Apartment Building Market - 5+ Units
Listings Closing Sale in Quarter since 2017
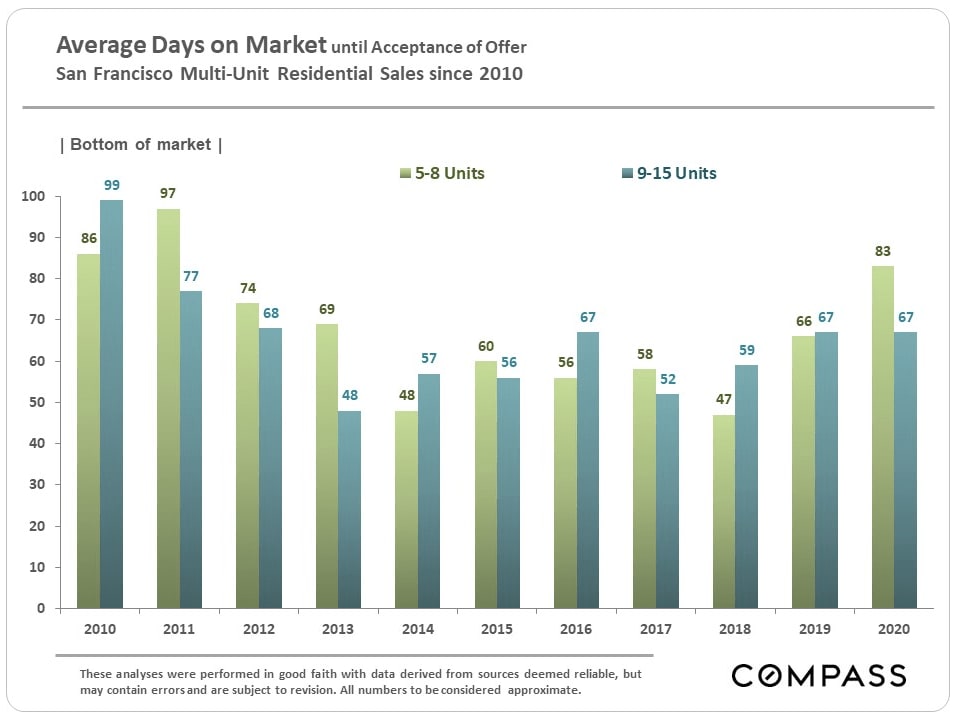
Average Days on Market until Acceptance of Offer
San Francisco Multi-Unit Residential Sales since 2010
San Francisco Apartment Building Sales
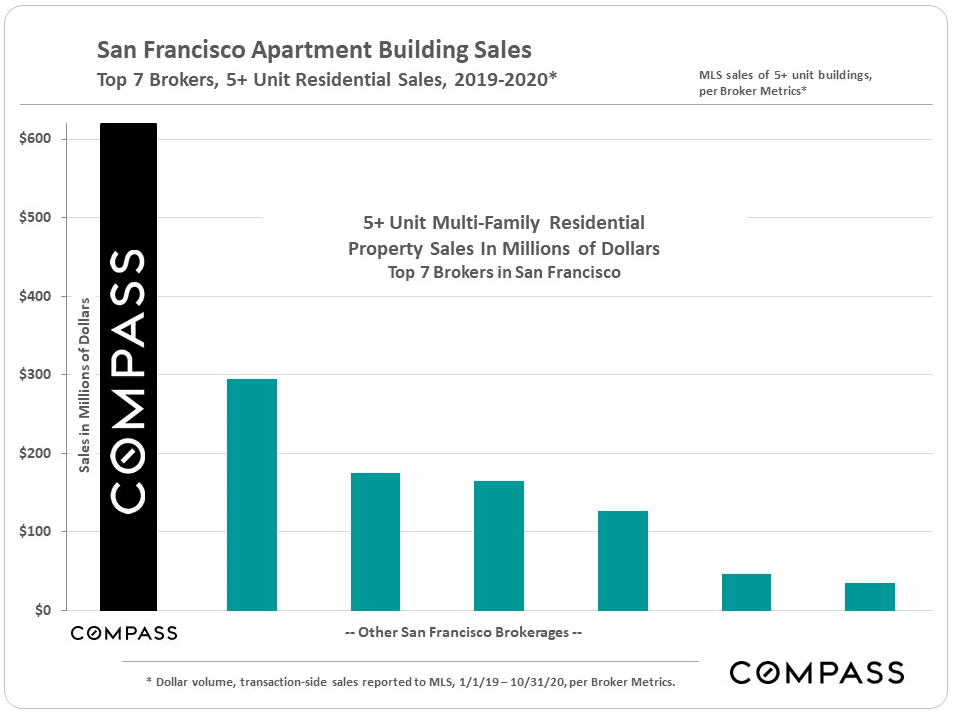
Top 7 Brokers, 5+ Unit Residential Sales, 2019-2020*