October 2023 Multi-Family Market Report for Residential 5+ Unit Buildings
5+ unit residential income buildings. Listings and sales reported to NorCal MLS Alliance. This market consists of a relatively small number of sales, of buildings warnings of widely varying sizes, qualities and financial characteristics, across a broad range of locations: This makes meaningful statistical analysis more difficult. All numbers should be considered approximate.
San Francisco Apartment Building Market - 5+ Units
Listings Closing Sale in Quarter since 2017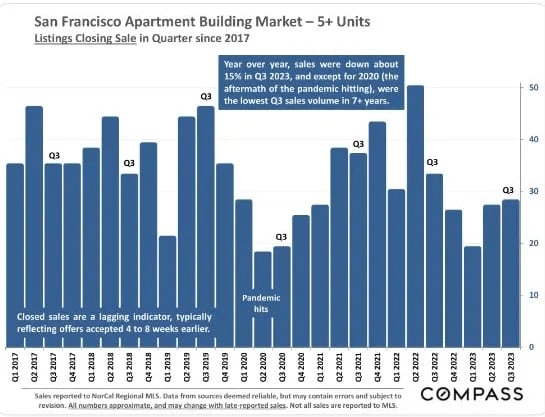
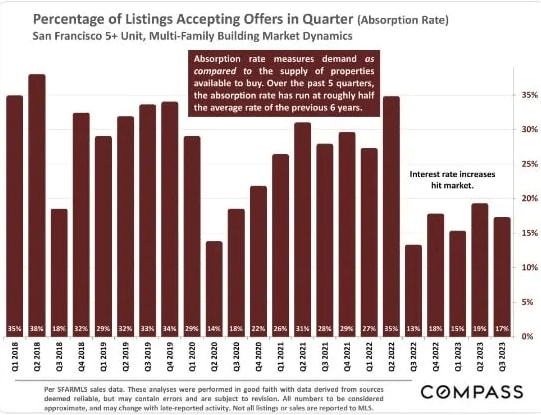
Percentage of Listings Accepting Offers in Quarter (Absorption Rate)
San Francisco 5+ Unit, Multi-Family Building Market Dynamics
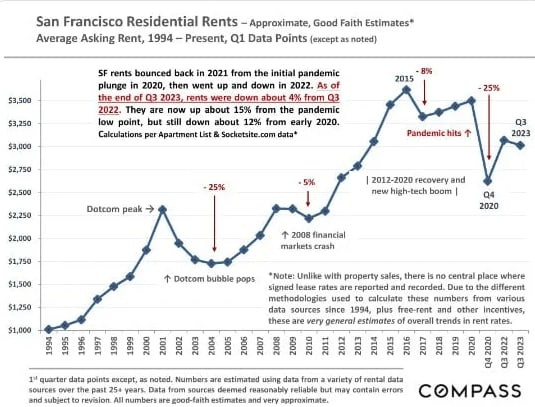
San Francisco Residential Rents - Approximate, Good Faith Estimates*
Average Asking Rent, 1994 - Present, Q1 Data Points (except as noted)
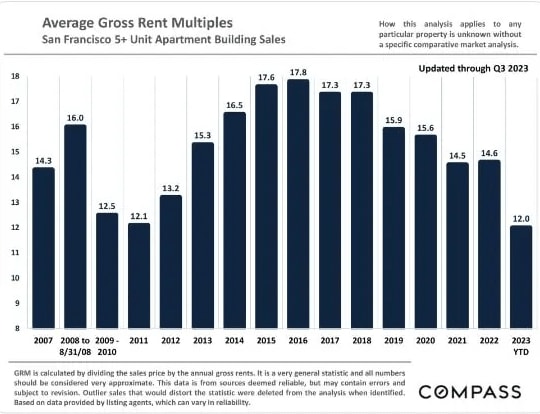
Average Gross Rent Multiples
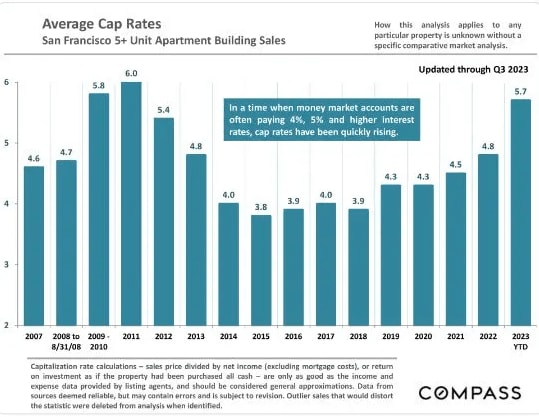
San Francisco 5+ Unit Apartment Building Sales
Average Cap Rates
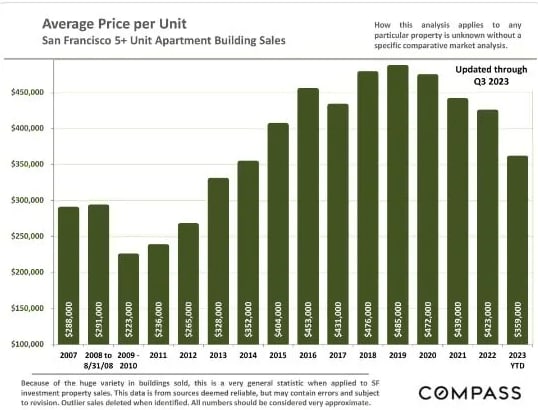
San Francisco 5+ Unit Apartment Building Sales
Average Price per Unit
San Francisco 5+ Unit Apartment Building Sales
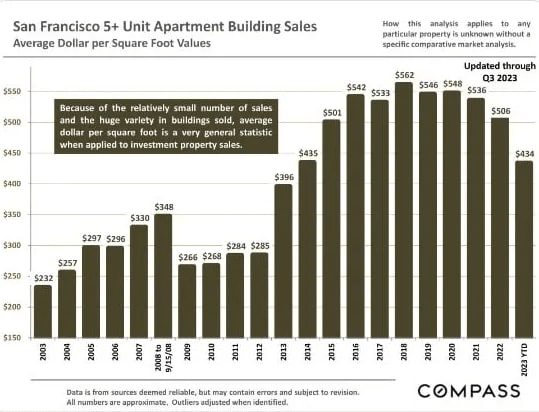
San Francisco 5+ Unit Apartment Building Sales
Average Dollar per Square Foot Values
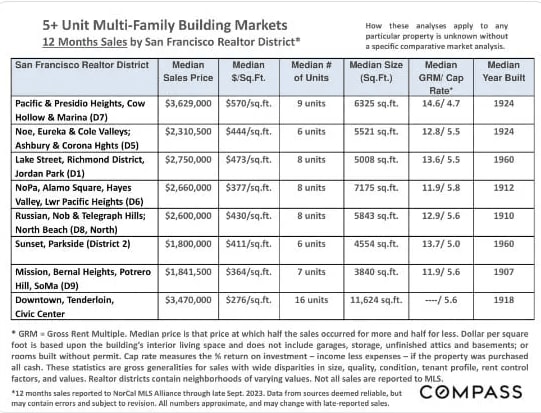
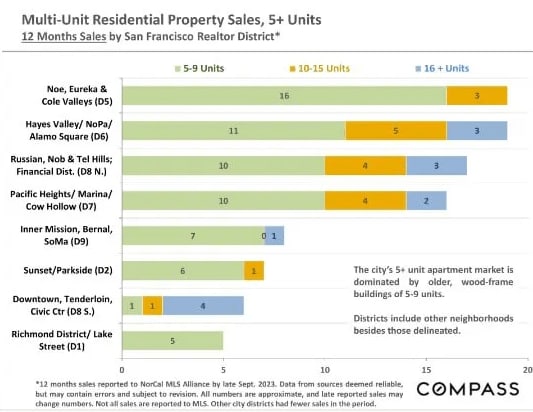
5+ Unit Multi-Family Building Markets
12 Months Sales by San Francisco Realtor District*
Multi-Unit Residential Property Sales, 5+ Units
12 Months Sales by San Francisco Realtor District*
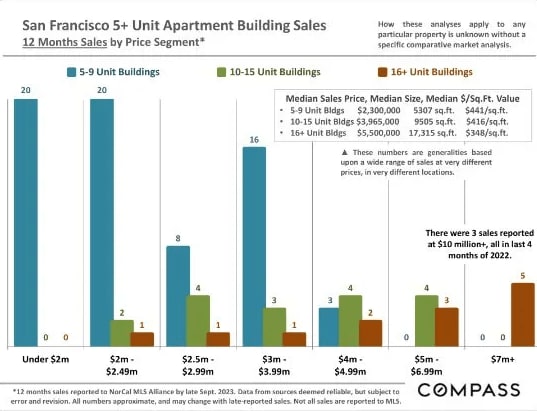
San Francisco 5+ Unit Apartment Building Sales
12 Months Sales by Price Segment*
"San Francisco's office market is seeing progress for the first time since the onset of the pandemic. Company searches for office space in the city are the highest they have been in years. Firms in the growing artificial-intelligence industry are leasing large blocks of space, signaling that the city's appeal as a tech hub hasn't evaporated. 2023 (has been) the most active year for sales since 2019. (Office building values and rents have dropped dramatically but constitute) the critical first steps toward recovery... The recent sales activity is part of the adjustment we've been waiting for,' said Ted Egan, San Francisco's chief economist. 'The market-moving is healthy'... Rent levels have fallen to the point that some tenants who were priced out of the city can afford space, brokers said that companies have search requests for 4.5 million square feet of office space, compared with 2.5 million square feet in January."
The Wall Street Journal, "San Francisco Office Market Shows of Life," 9/17/23
Any Improvement in San Francisco office leasing and occupancy is positive news for the city's residential rental market, though clearly the recovery has a very substantial way to go.
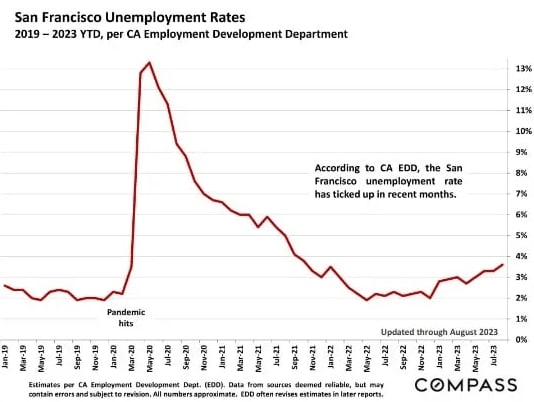
San Francisco Unemployment Rates
2019 - 2023 YTD, per CA Employment Development Department
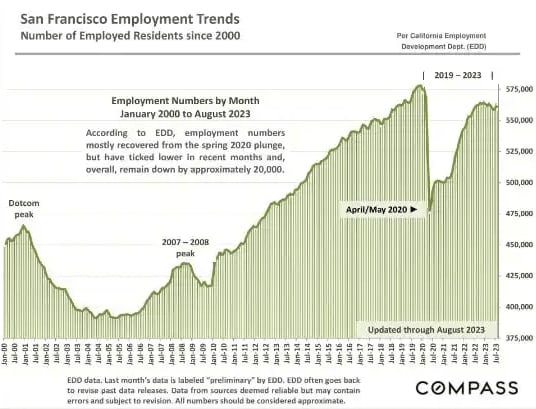
San Francisco Employment Trends
Number of Employed Residents since 2000
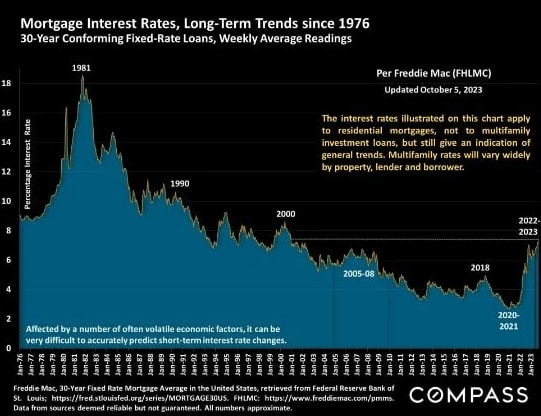
Mortgage Interest Rates, Long-Term Trends since 1976
30-Year Conforming Fixed-Rate Loans, Weekly Average Readings
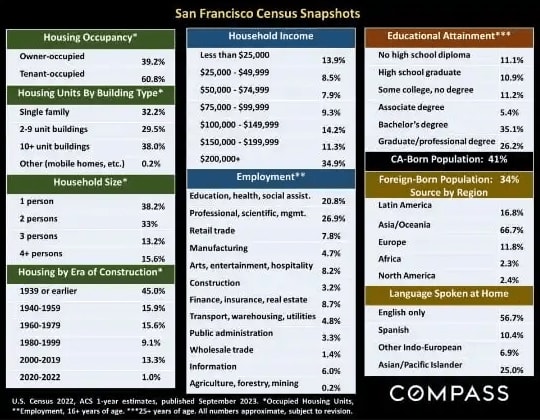
San Francisco Census Snapshots
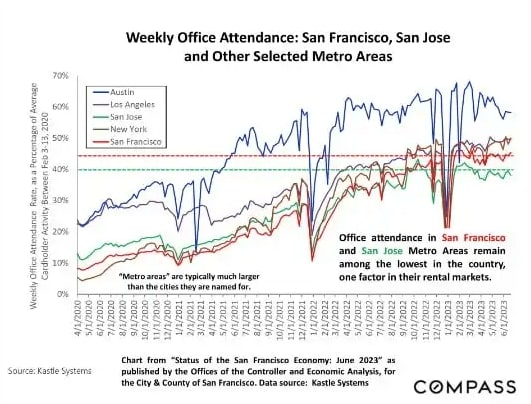
Weekly Office Attendance: San Francisco, San Jose and Other Selected Metro Areas

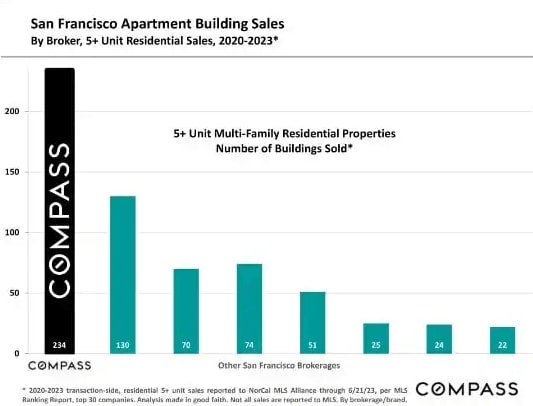
San Francisco Apartment Building Sales
By Broker, 5+ Unit Residential Sales, 2020-2023*
Note that the quantity of sales in any given local submarket is usually relatively small and/or the number of sales that report the necessary financial information can be limited. Buildings of different ages, qualities and sizes selling in different periods can cause these average and median figures to fluctuate significantly. Furthermore, the reliability of some of these calculations depends upon the quality of the income and expense figures provided by the listing agents, and sometimes instead of actual members, much less meaningful projected or scheduled figures are used. Late reported listings and sales may change these statistics. Therefore, the above statistics should be considered very general indicators, and how they apply to any particular property without a specific comparative market analysis is unknown.
These analyses were made in good faith with data from sources deemed reliable, but they may contain errors and are subject to revision. Statistics are generalities and all numbers should be considered approximate. Numbers may change with late-reported sales activity.
Compass is a real estate broker licensed by the State of California, DRE 01527235. Equal Housing Opportunity. This report has been prepared solely for information purposes. The information herein is based on or derived from information generally available to the public and/or from sources believed to be reliable. No representation or warranty can be given with respect to the accuracy or completeness of the information. Compass disclaims any and all liability relating to this report, including without limitation any express or implied representations or warranties for statements contained in, and omissions from, the report. Nothing contained herein is intended to be or should be read as any regulatory, legal, tax, accounting or other advice and Compass does not provide such advice. Al opinions are subject to change without notice. Compass makes no representation regarding the accuracy of any statements regarding any references to the laws, statutes or regulations of any state are those of the author(s). Past performance is no guarantee of future results.
@ 2023 Compass
