Blog

January 2026 Multi-Family Market Report for Residential 5+ Unit Buildings | San Francisco

January 2026 San Francisco apartment building market report for residential 5+ unit buildings

Market report says San Francisco’s residential income market rebounded in 2025 and expects growth to accelerate in 2026.

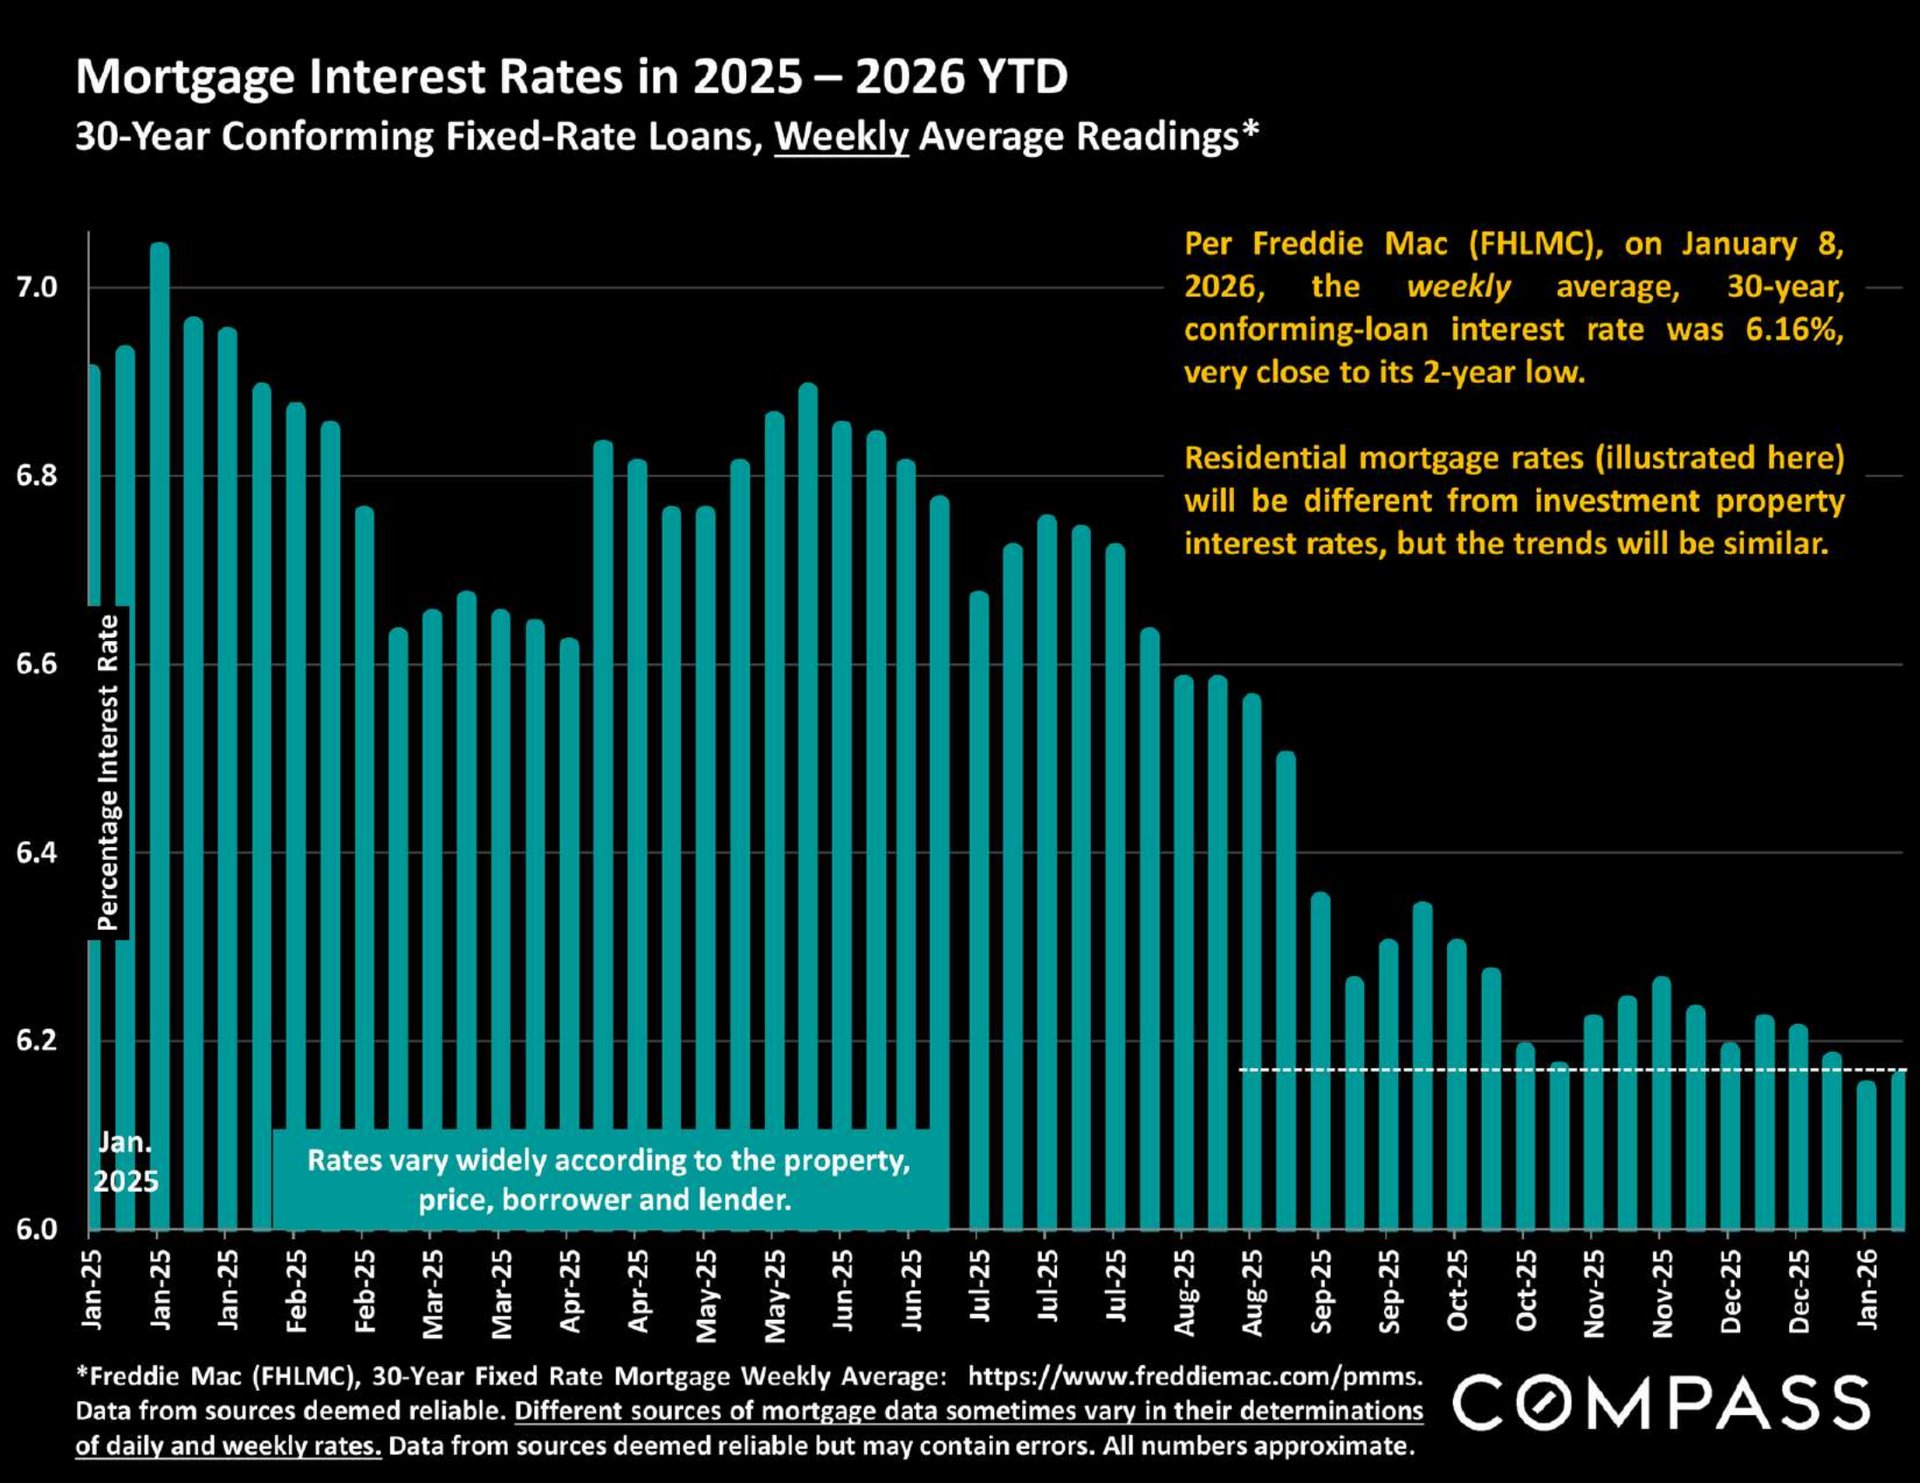
Chart of weekly 30-year mortgage rates from January 2025 to January 2026, declining to about 6.16%.

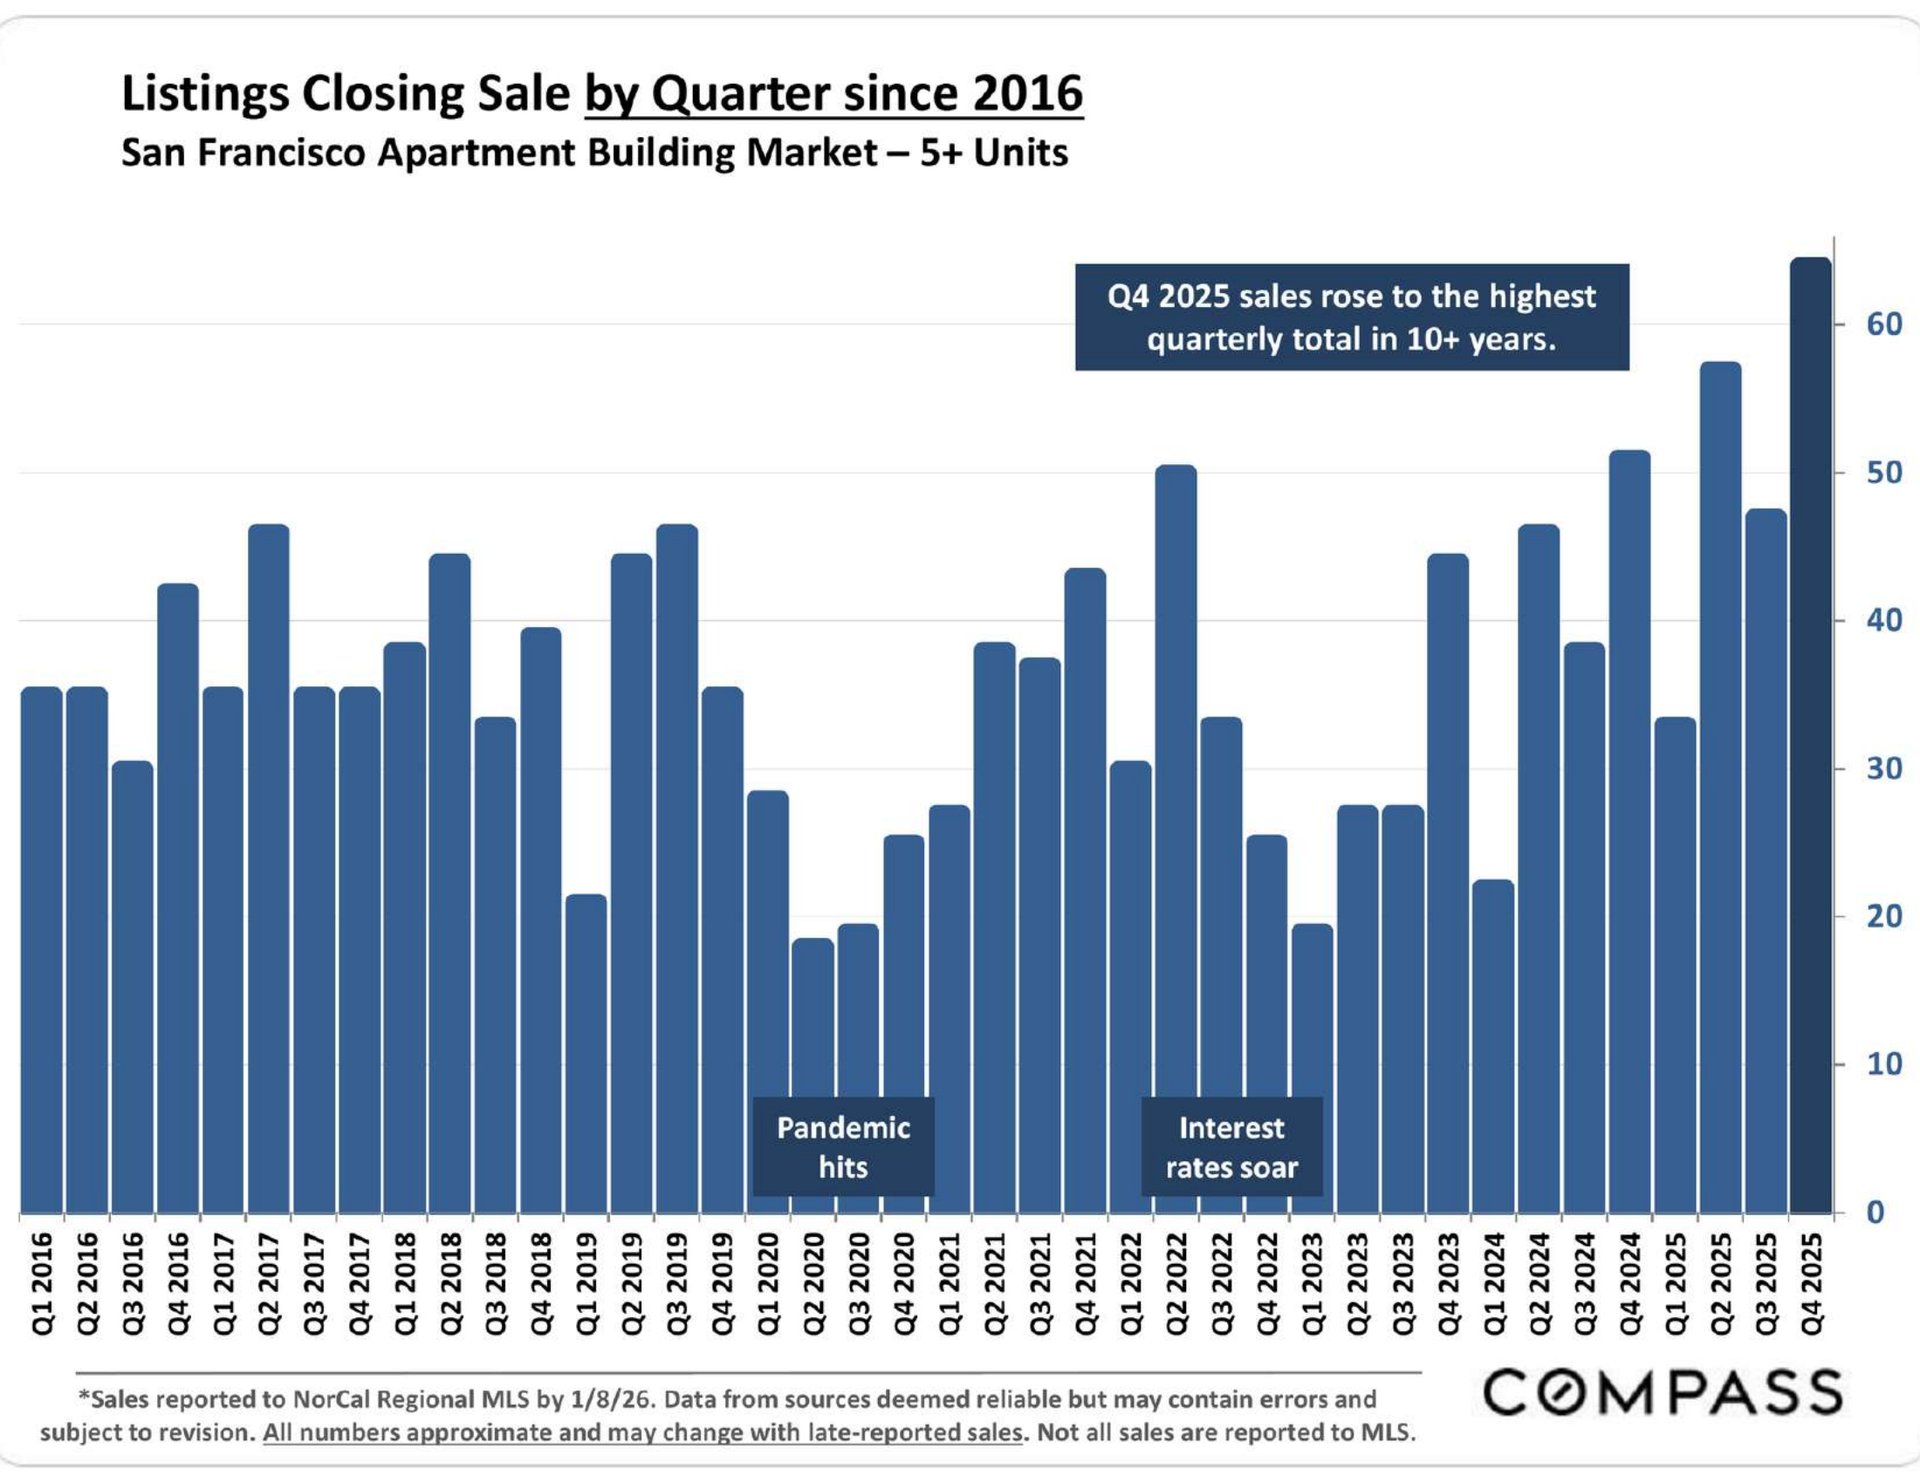
Chart of quarterly San Francisco sales of apartment buildings with five or more units, 2016–2025; Q4 2025 reached a ten-year high.

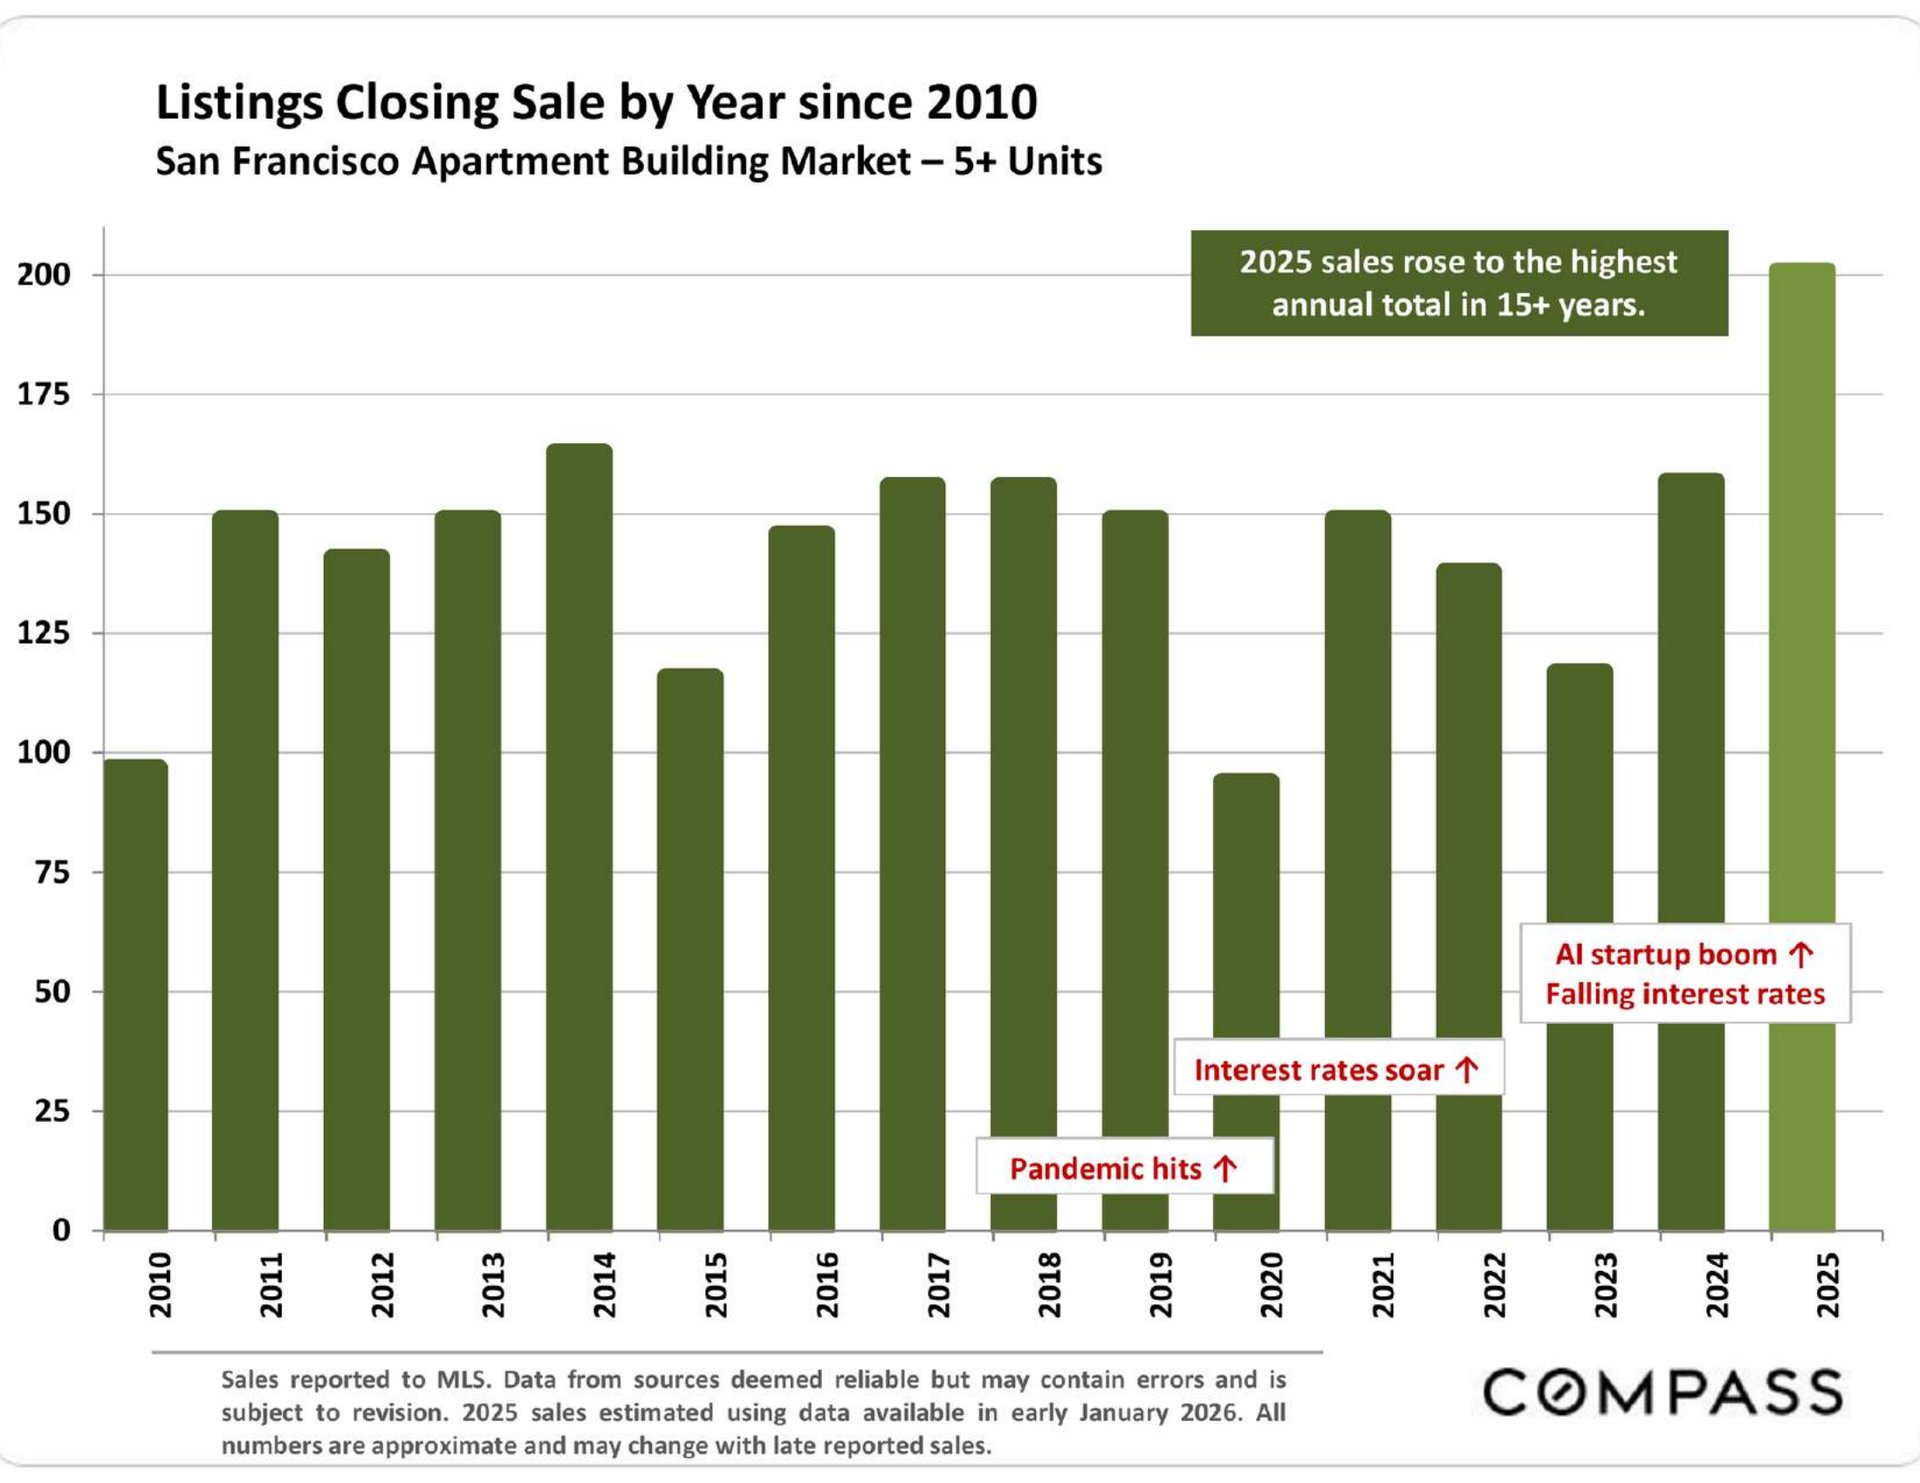
Chart of San Francisco apartment building sales from 2010–2025, peaking at about 202 in 2025.

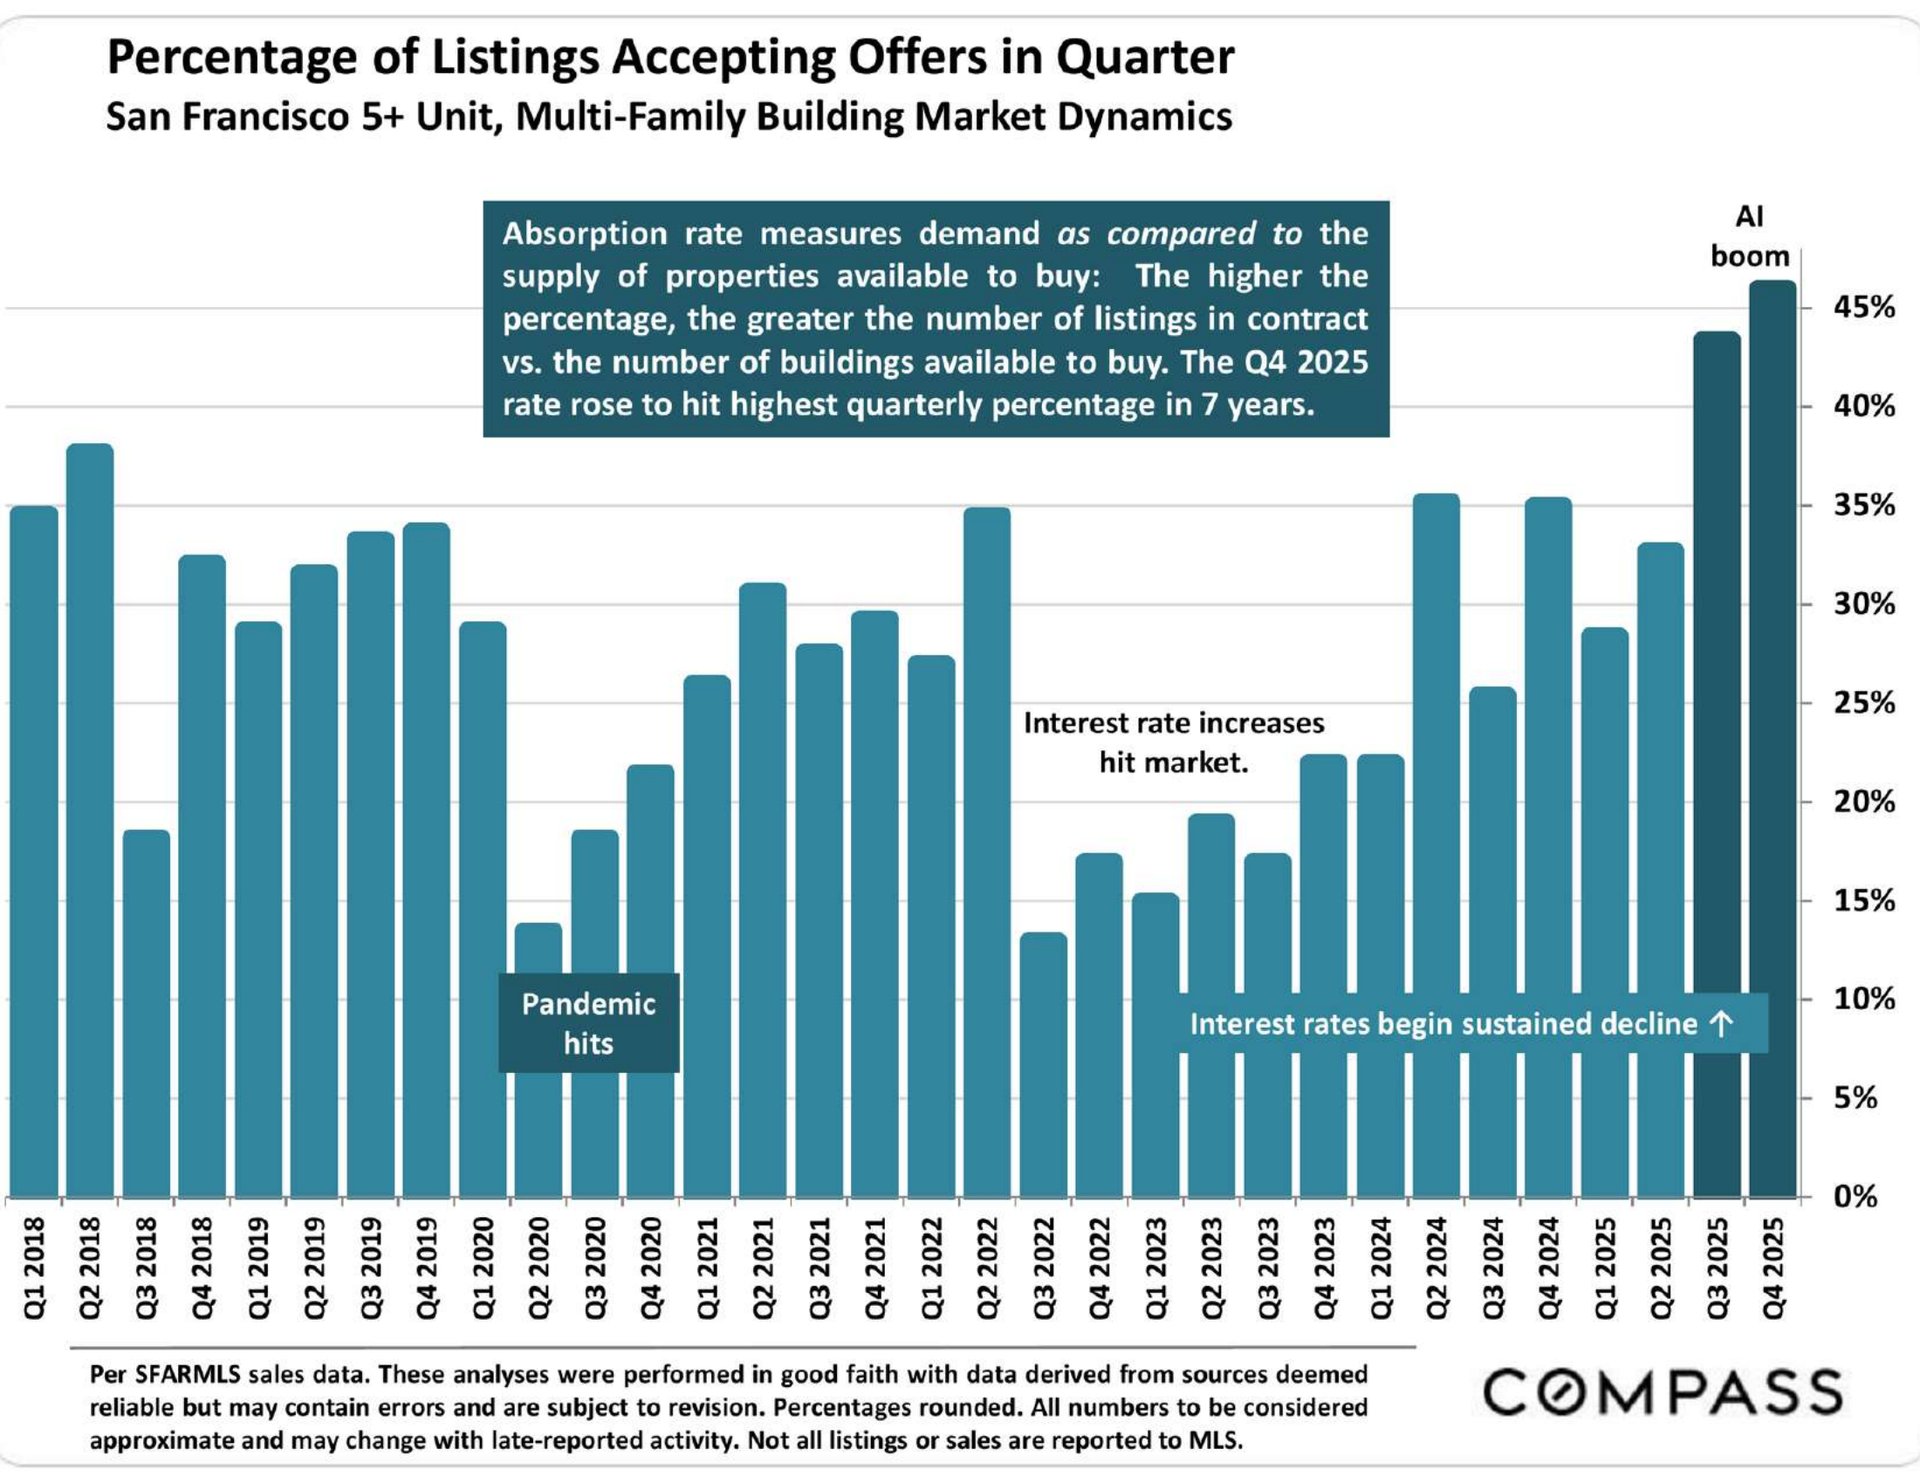
Bar chart of San Francisco 5+ unit listings accepting offers, rising to a seven-year high in Q4 2025.

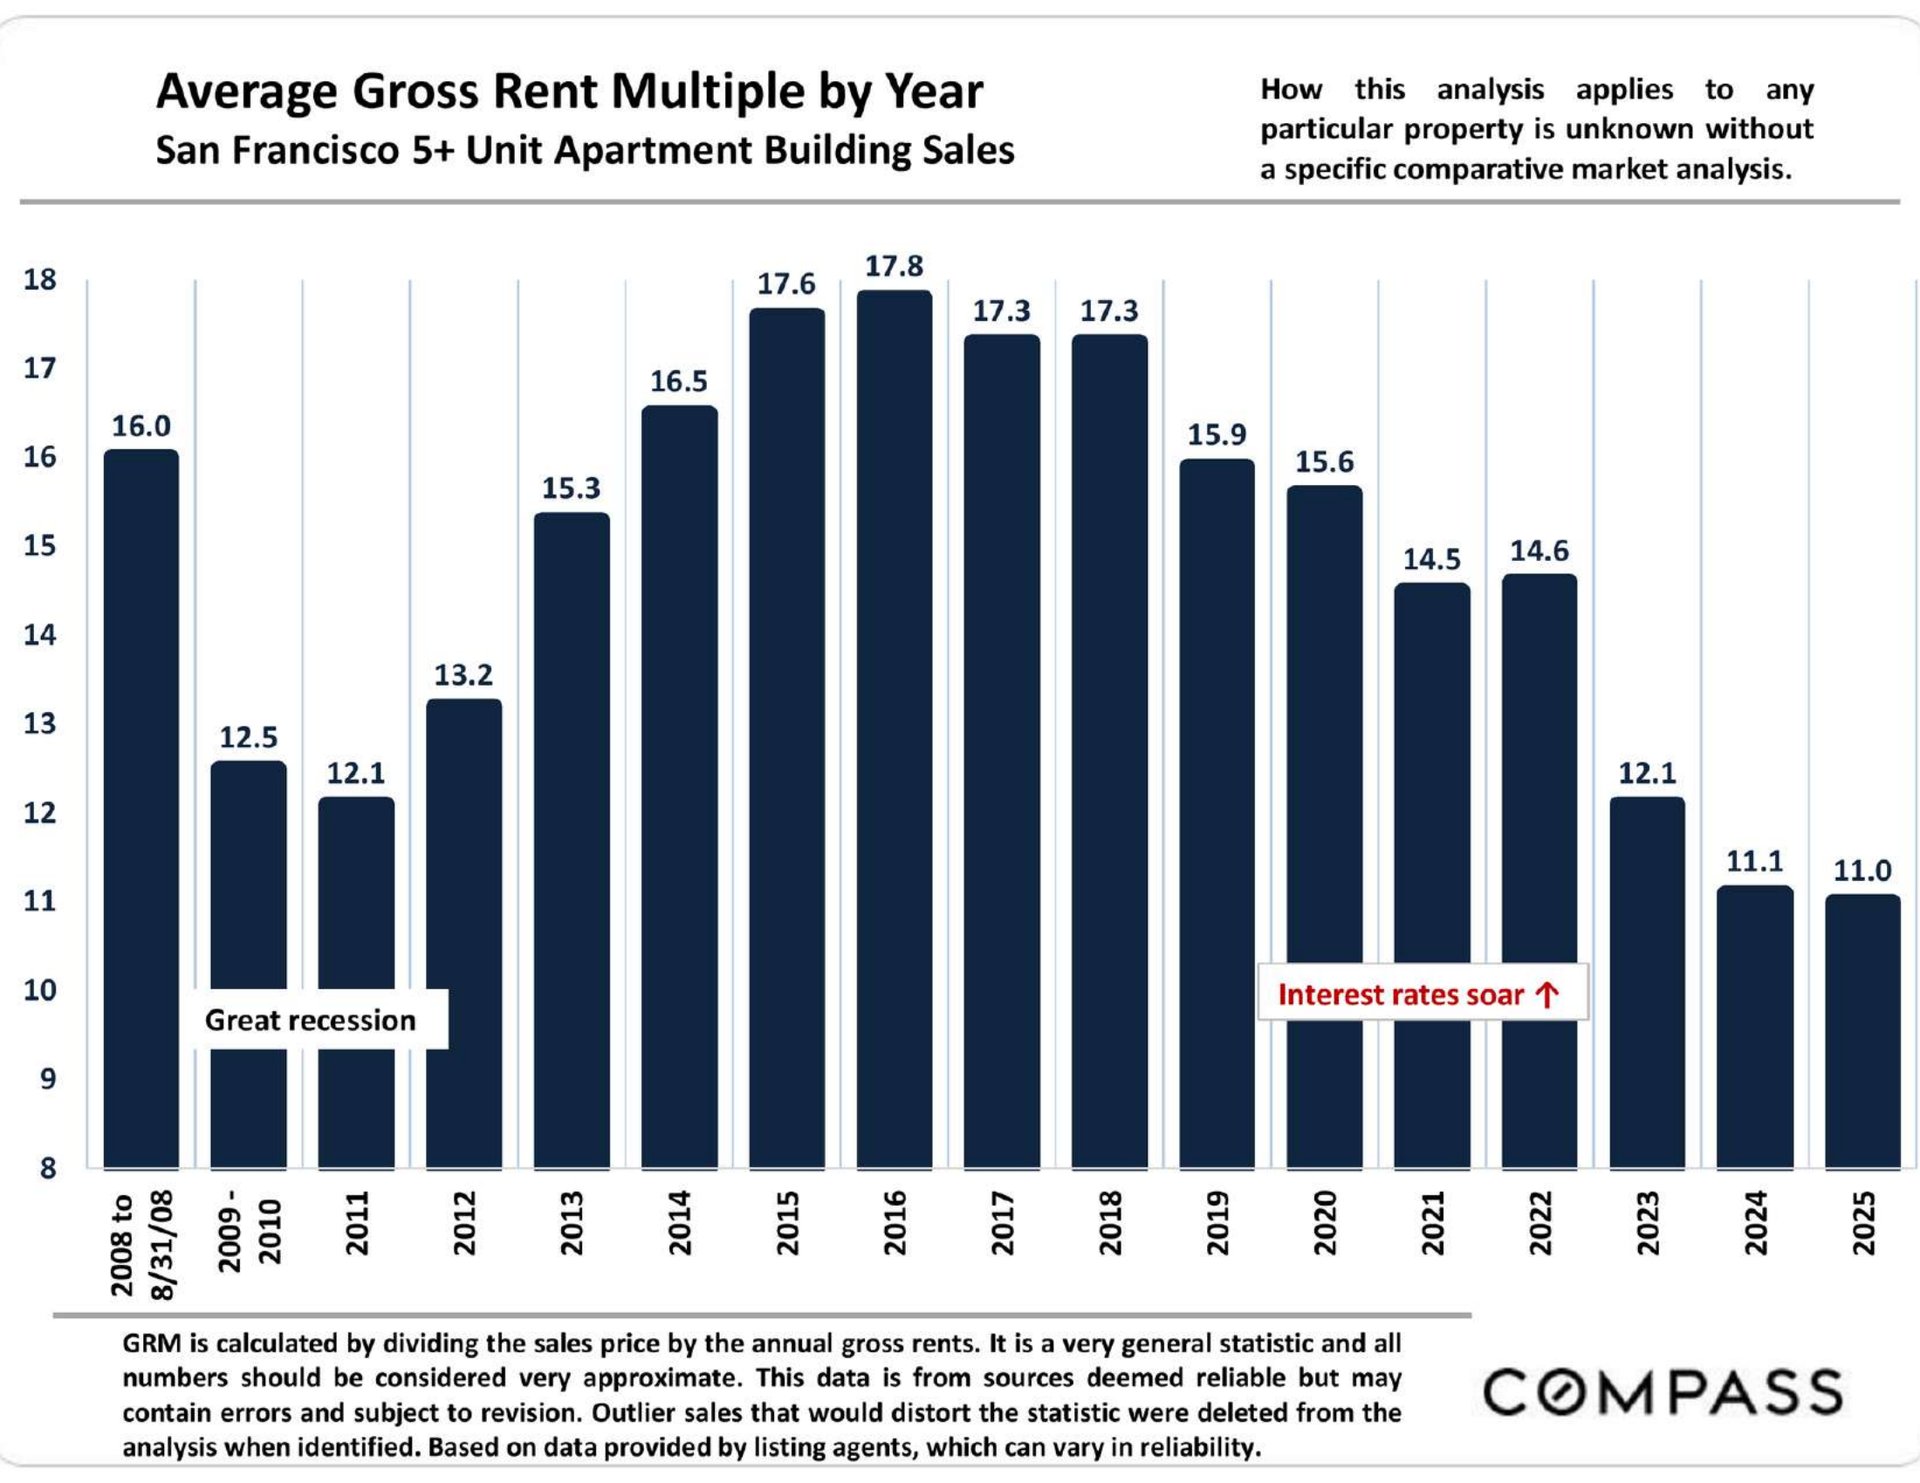
Bar chart of San Francisco 5+ unit apartment building gross rent multiples, peaking at 17.8 in 2016 and falling to 11.0 in 2025.

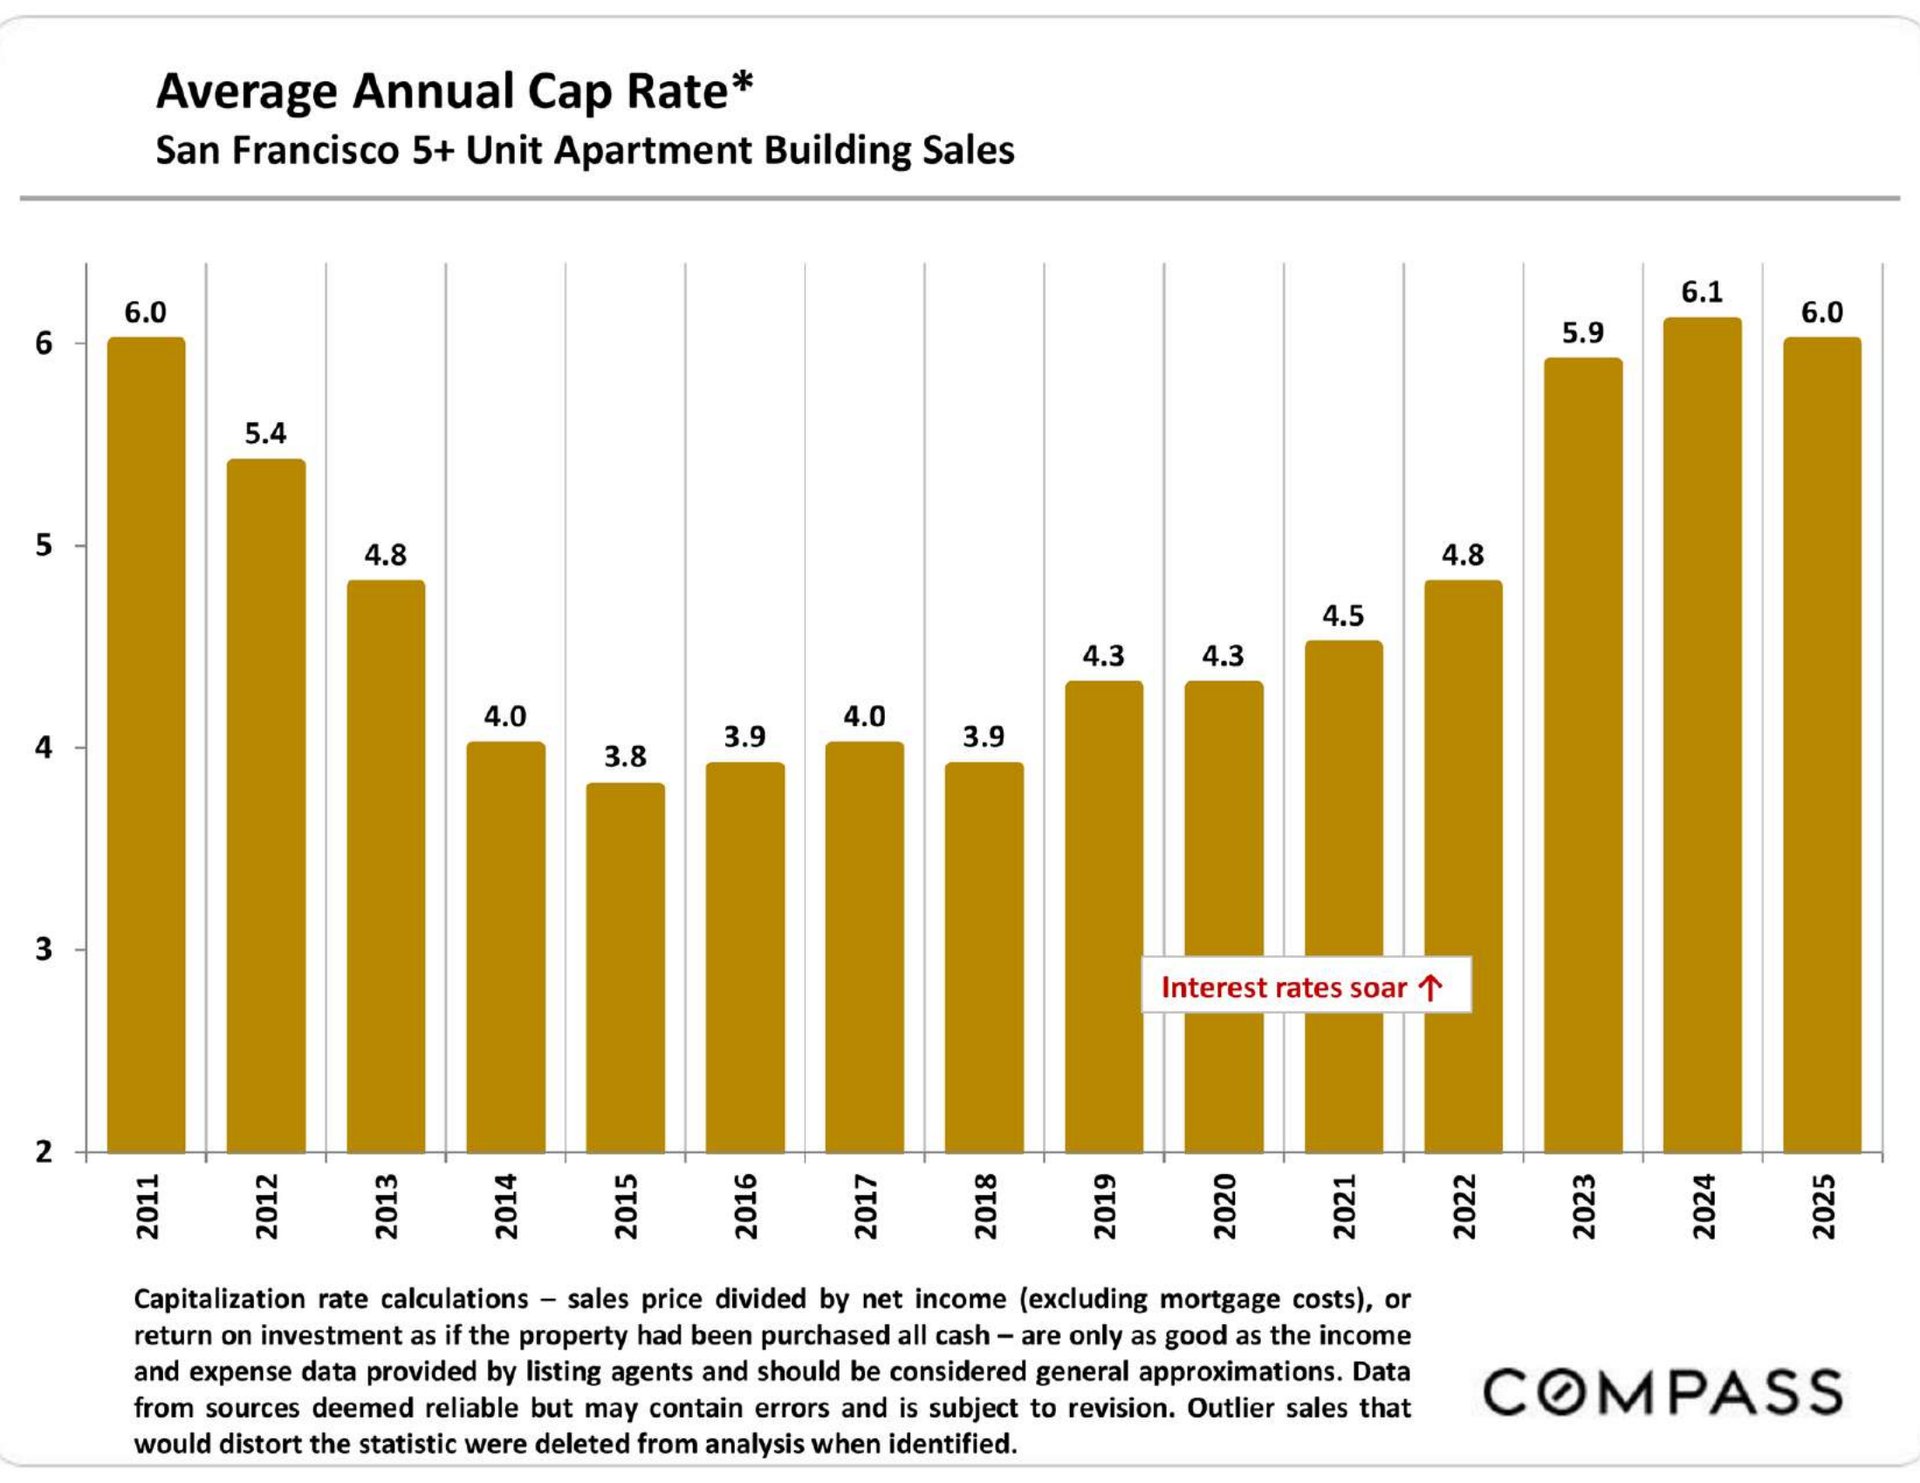
Bar chart of San Francisco 5+ unit apartment building cap rates, rising to 6.0% in 2025 after peaking at 6.1% in 2024.

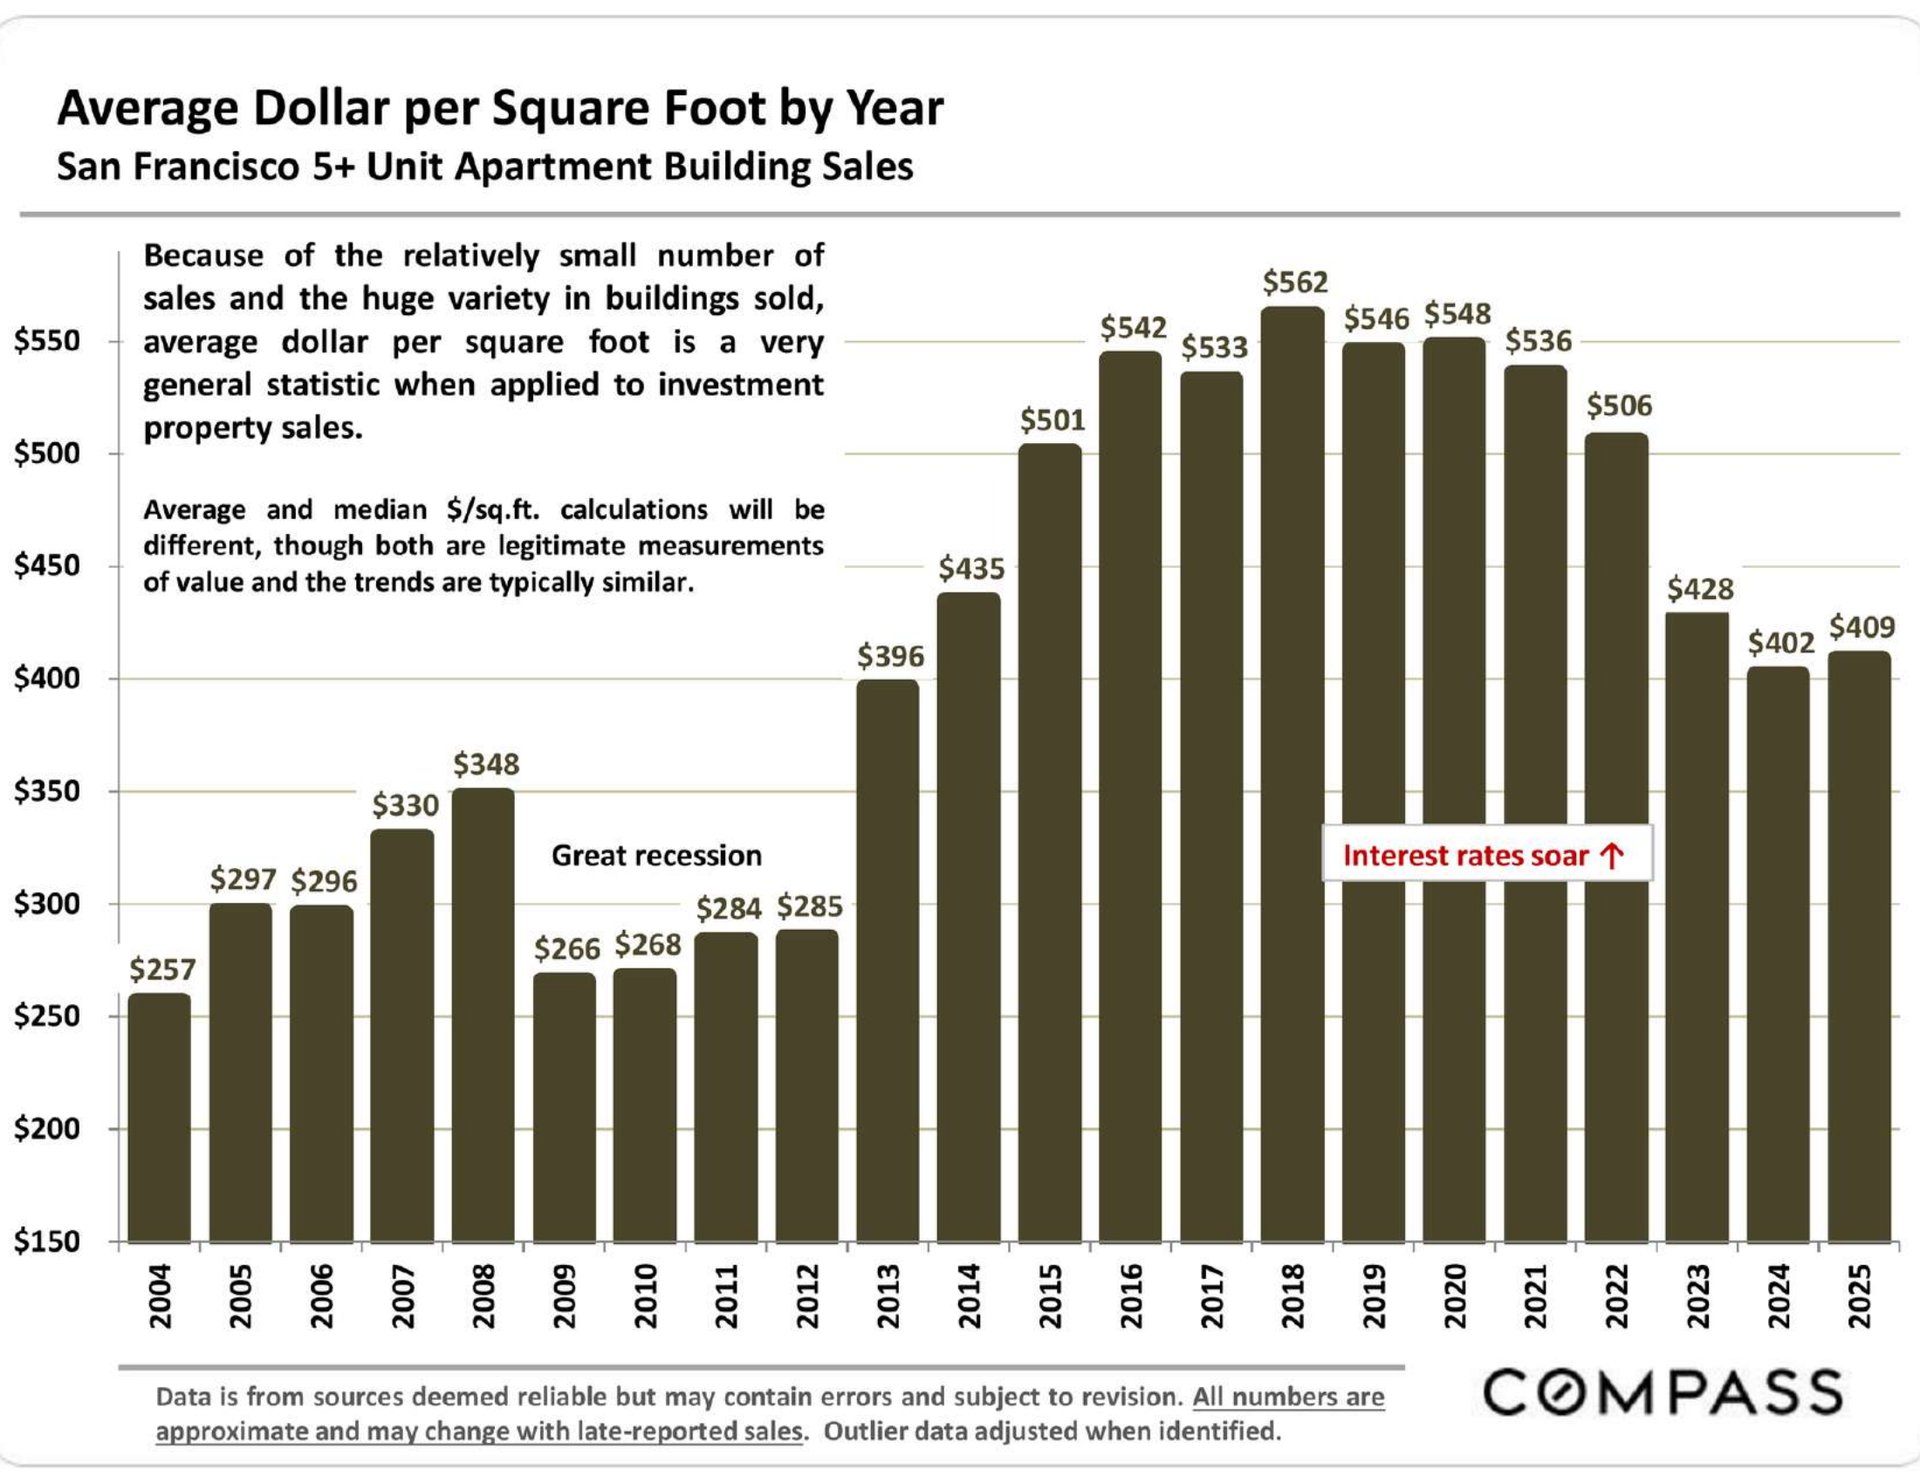
Bar chart of San Francisco 5+ unit apartment sale prices per square foot, peaking at $562 in 2018 and reaching $409 in 2025.

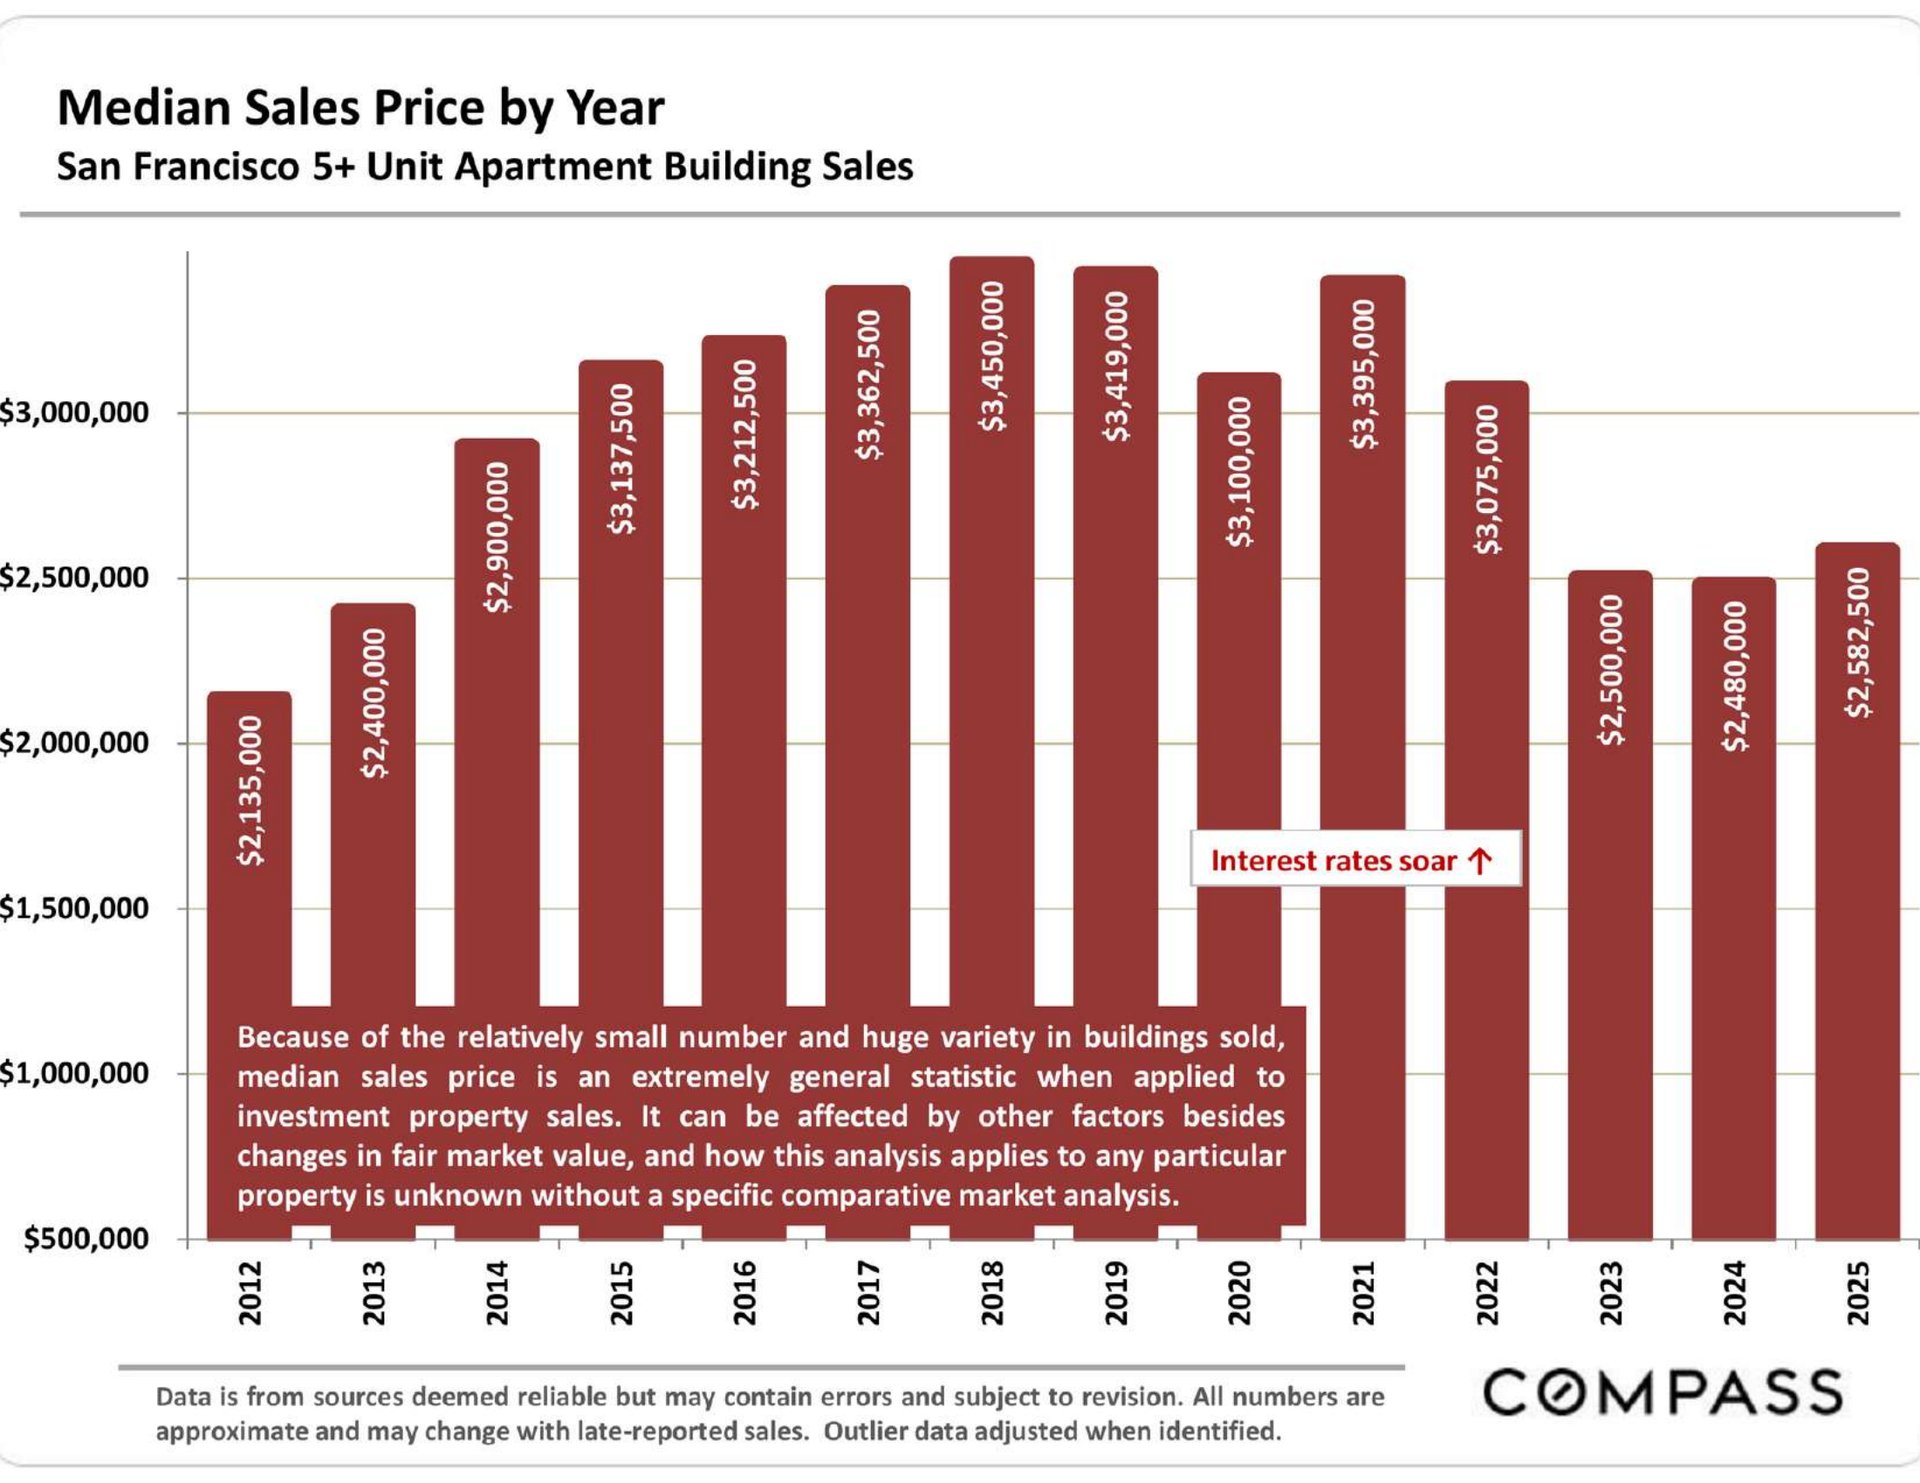
Bar chart of San Francisco 5+ unit apartment building median prices, peaking in 2018 and reaching $2.58 million in 2025.

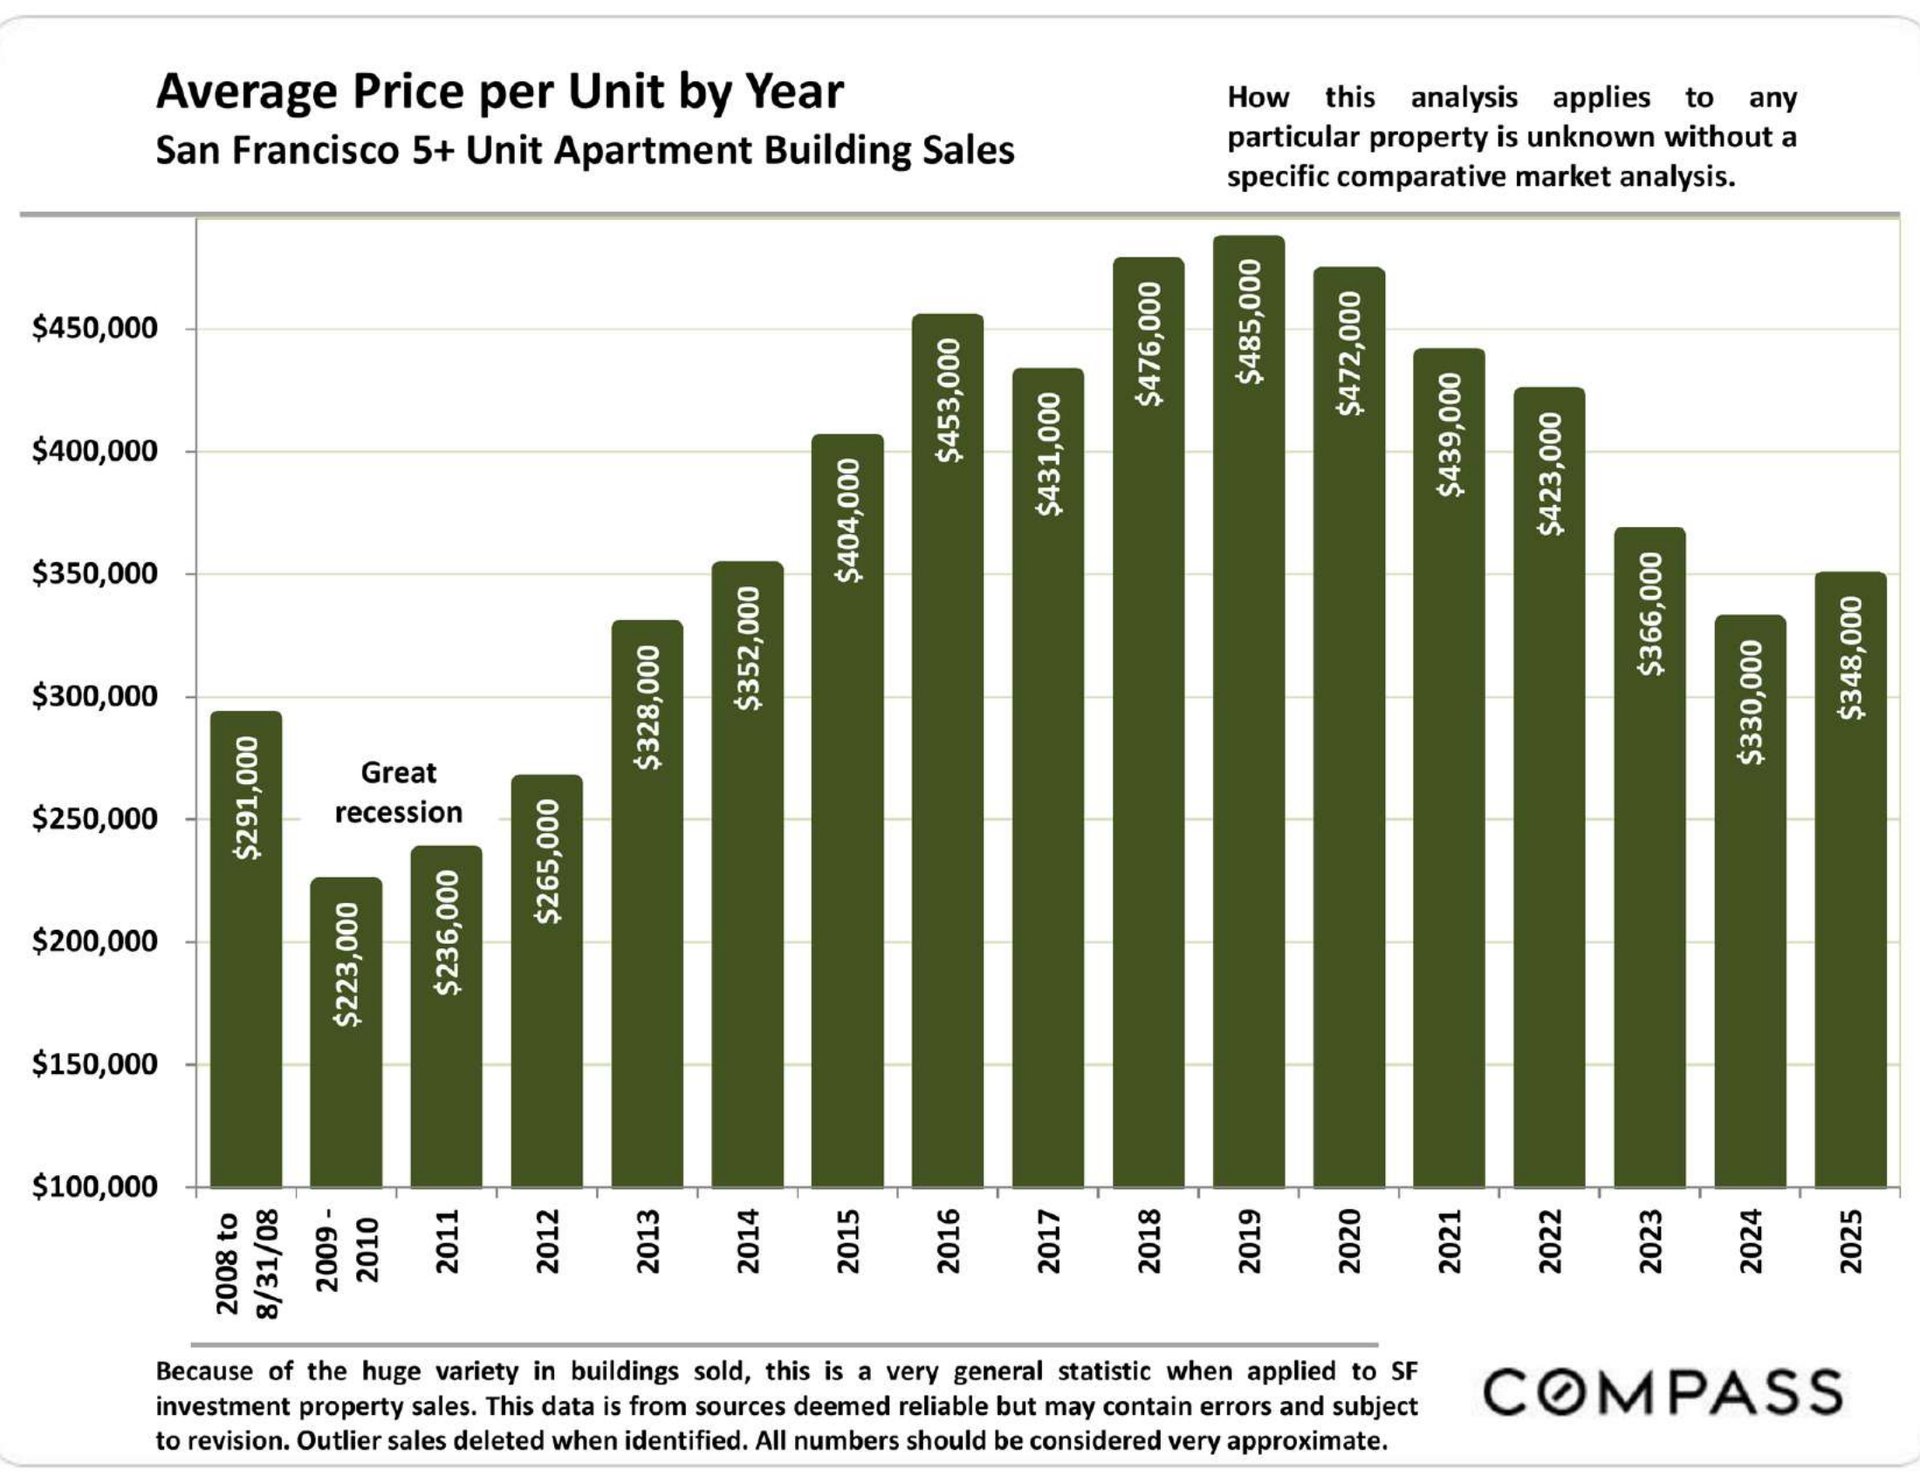
Chart of average San Francisco 5+ unit apartment building prices per unit, peaking at $485,000 in 2019 and reaching $348,000 in 2025.

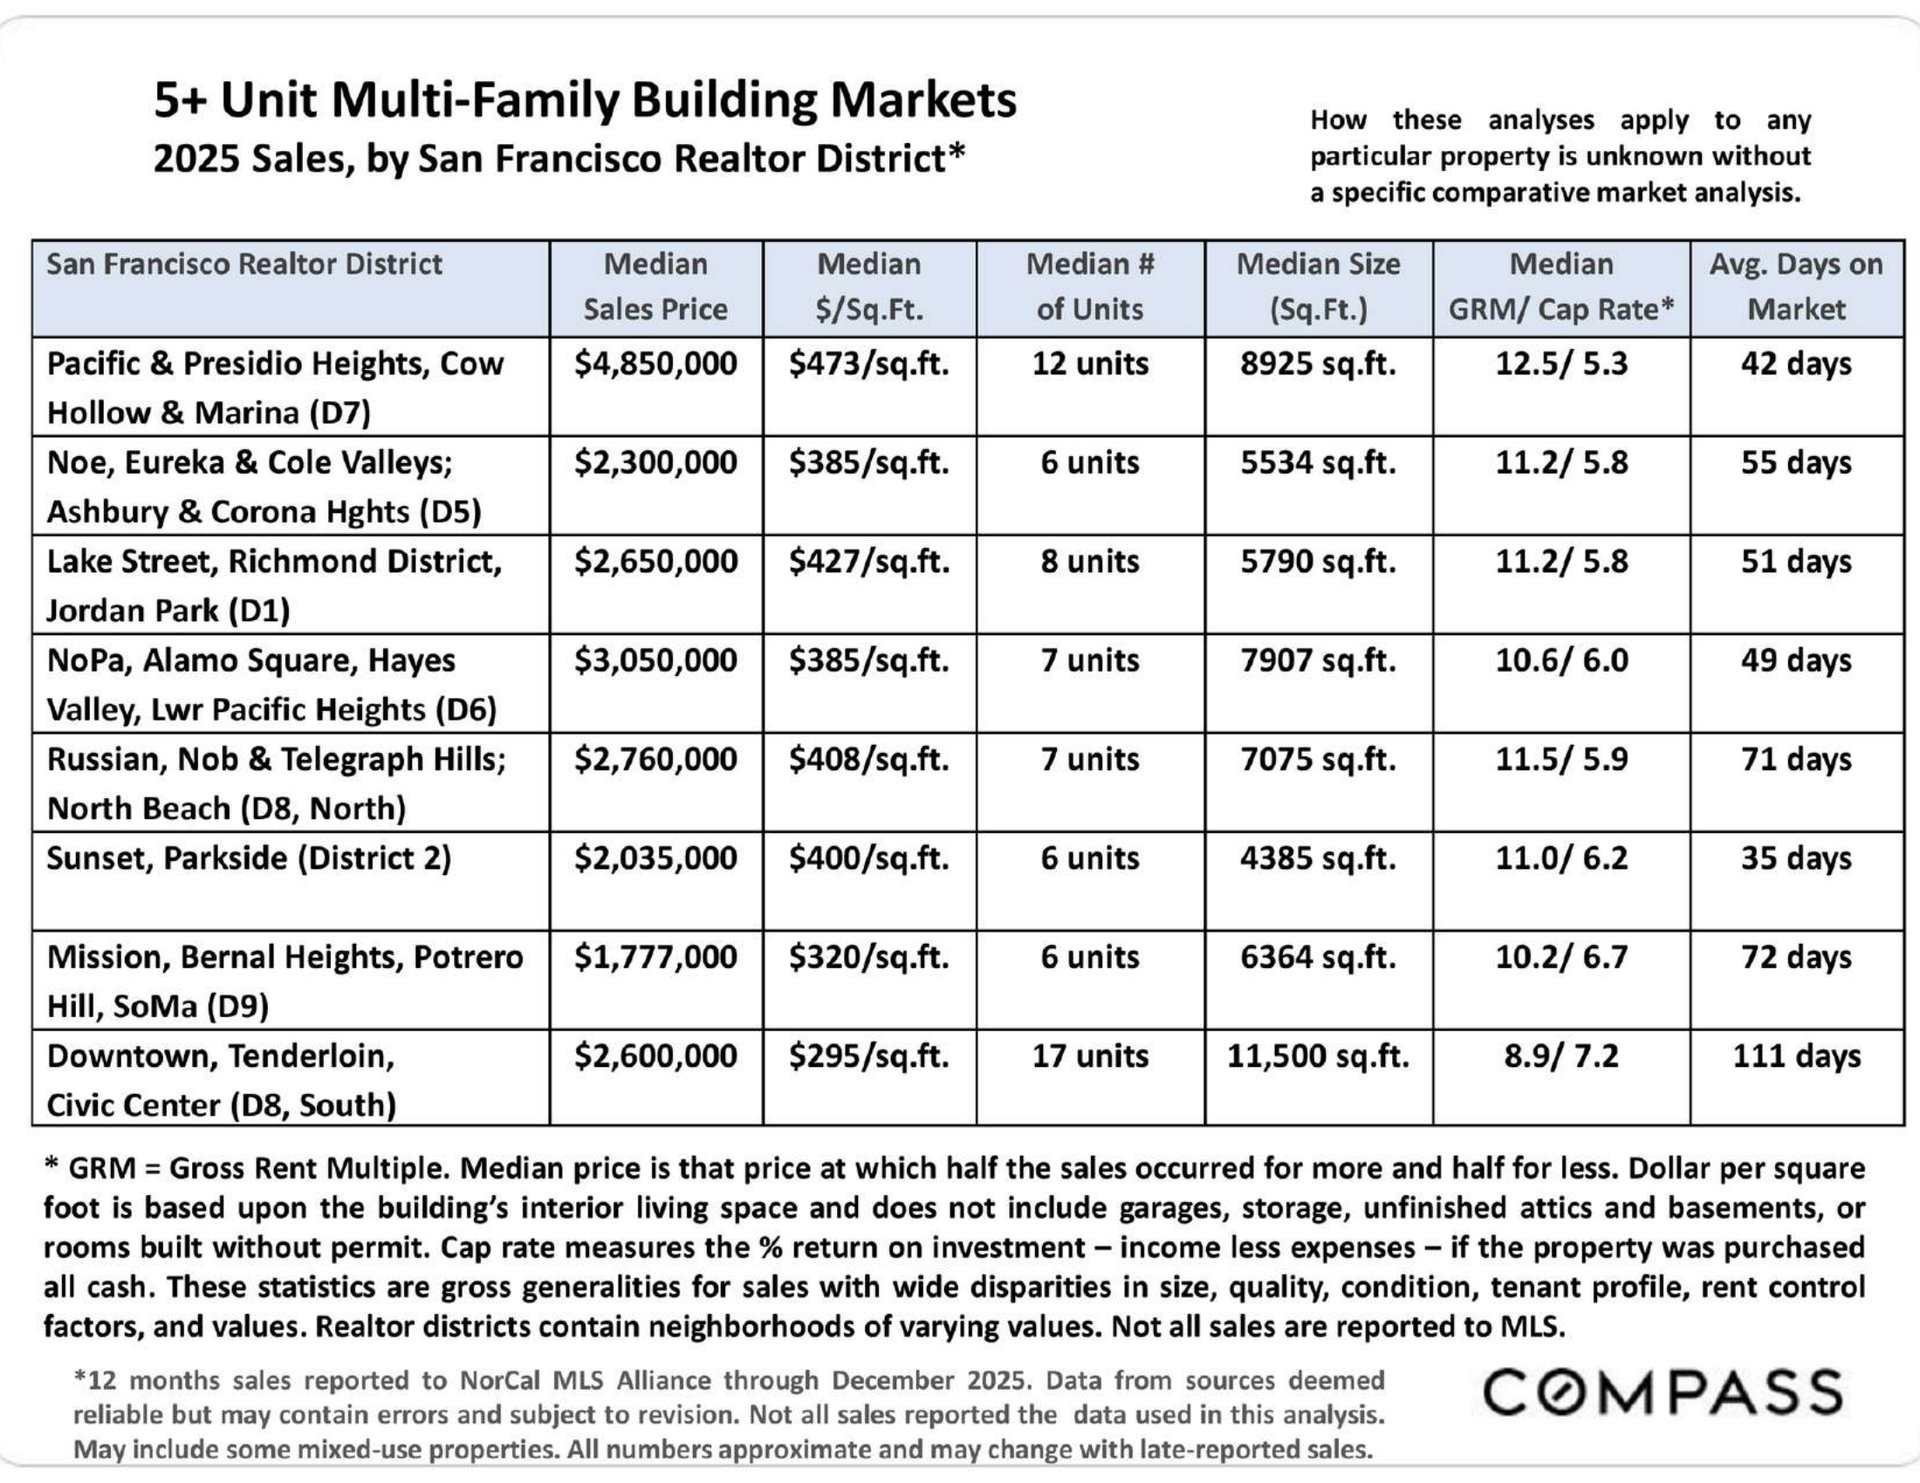
Table of 2025 San Francisco five-plus-unit multifamily sales by realtor district, with prices, sizes, returns, and market days.

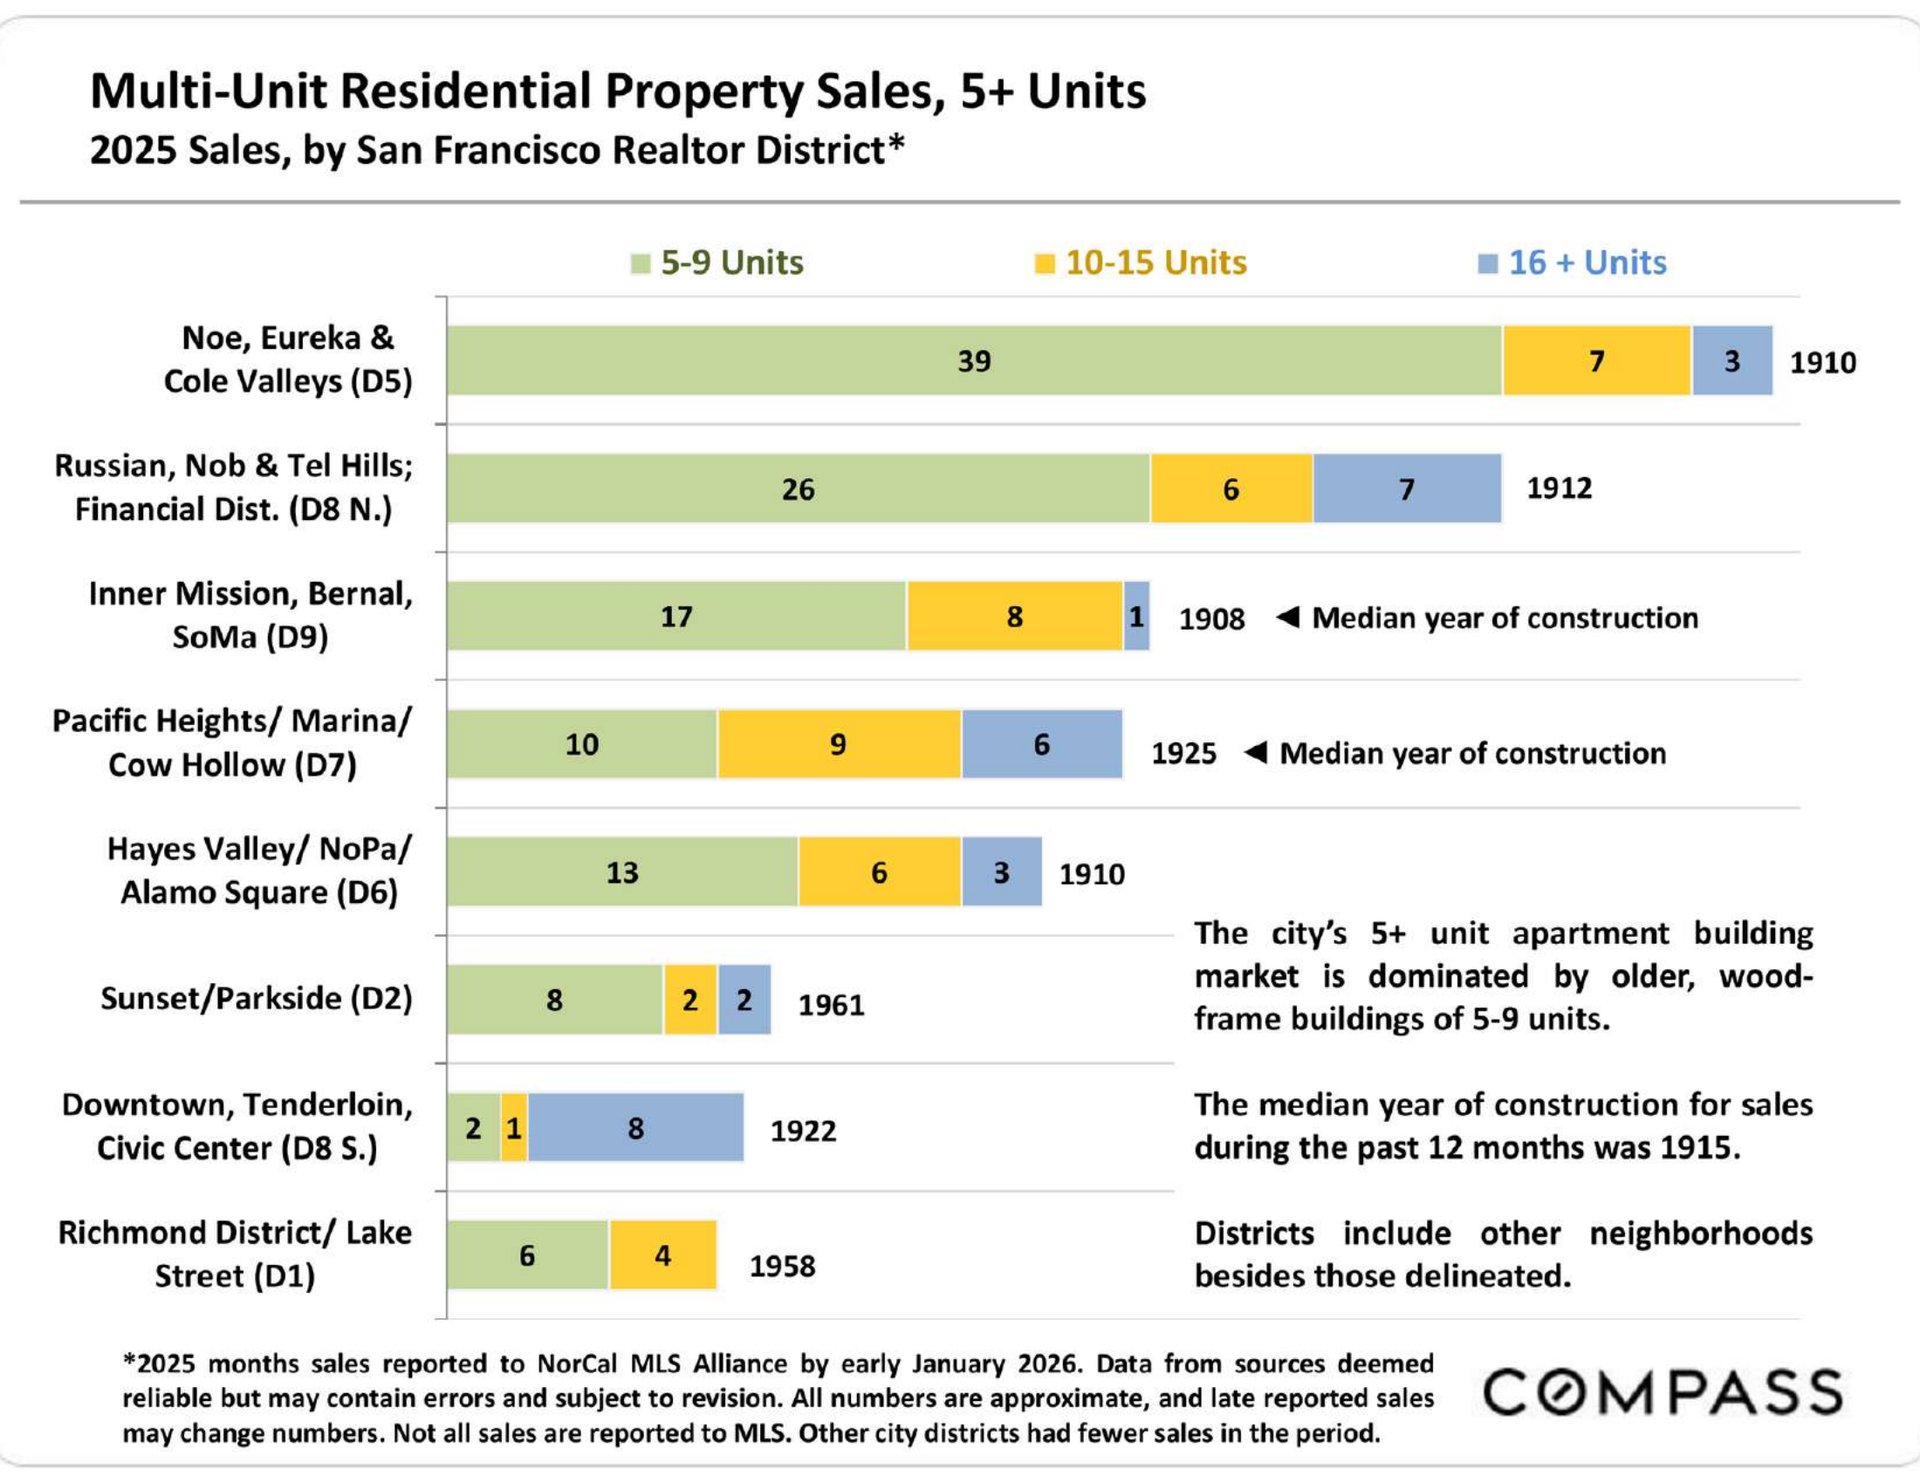
Chart of 2025 San Francisco 5+ unit apartment sales by district, grouped by building unit count.

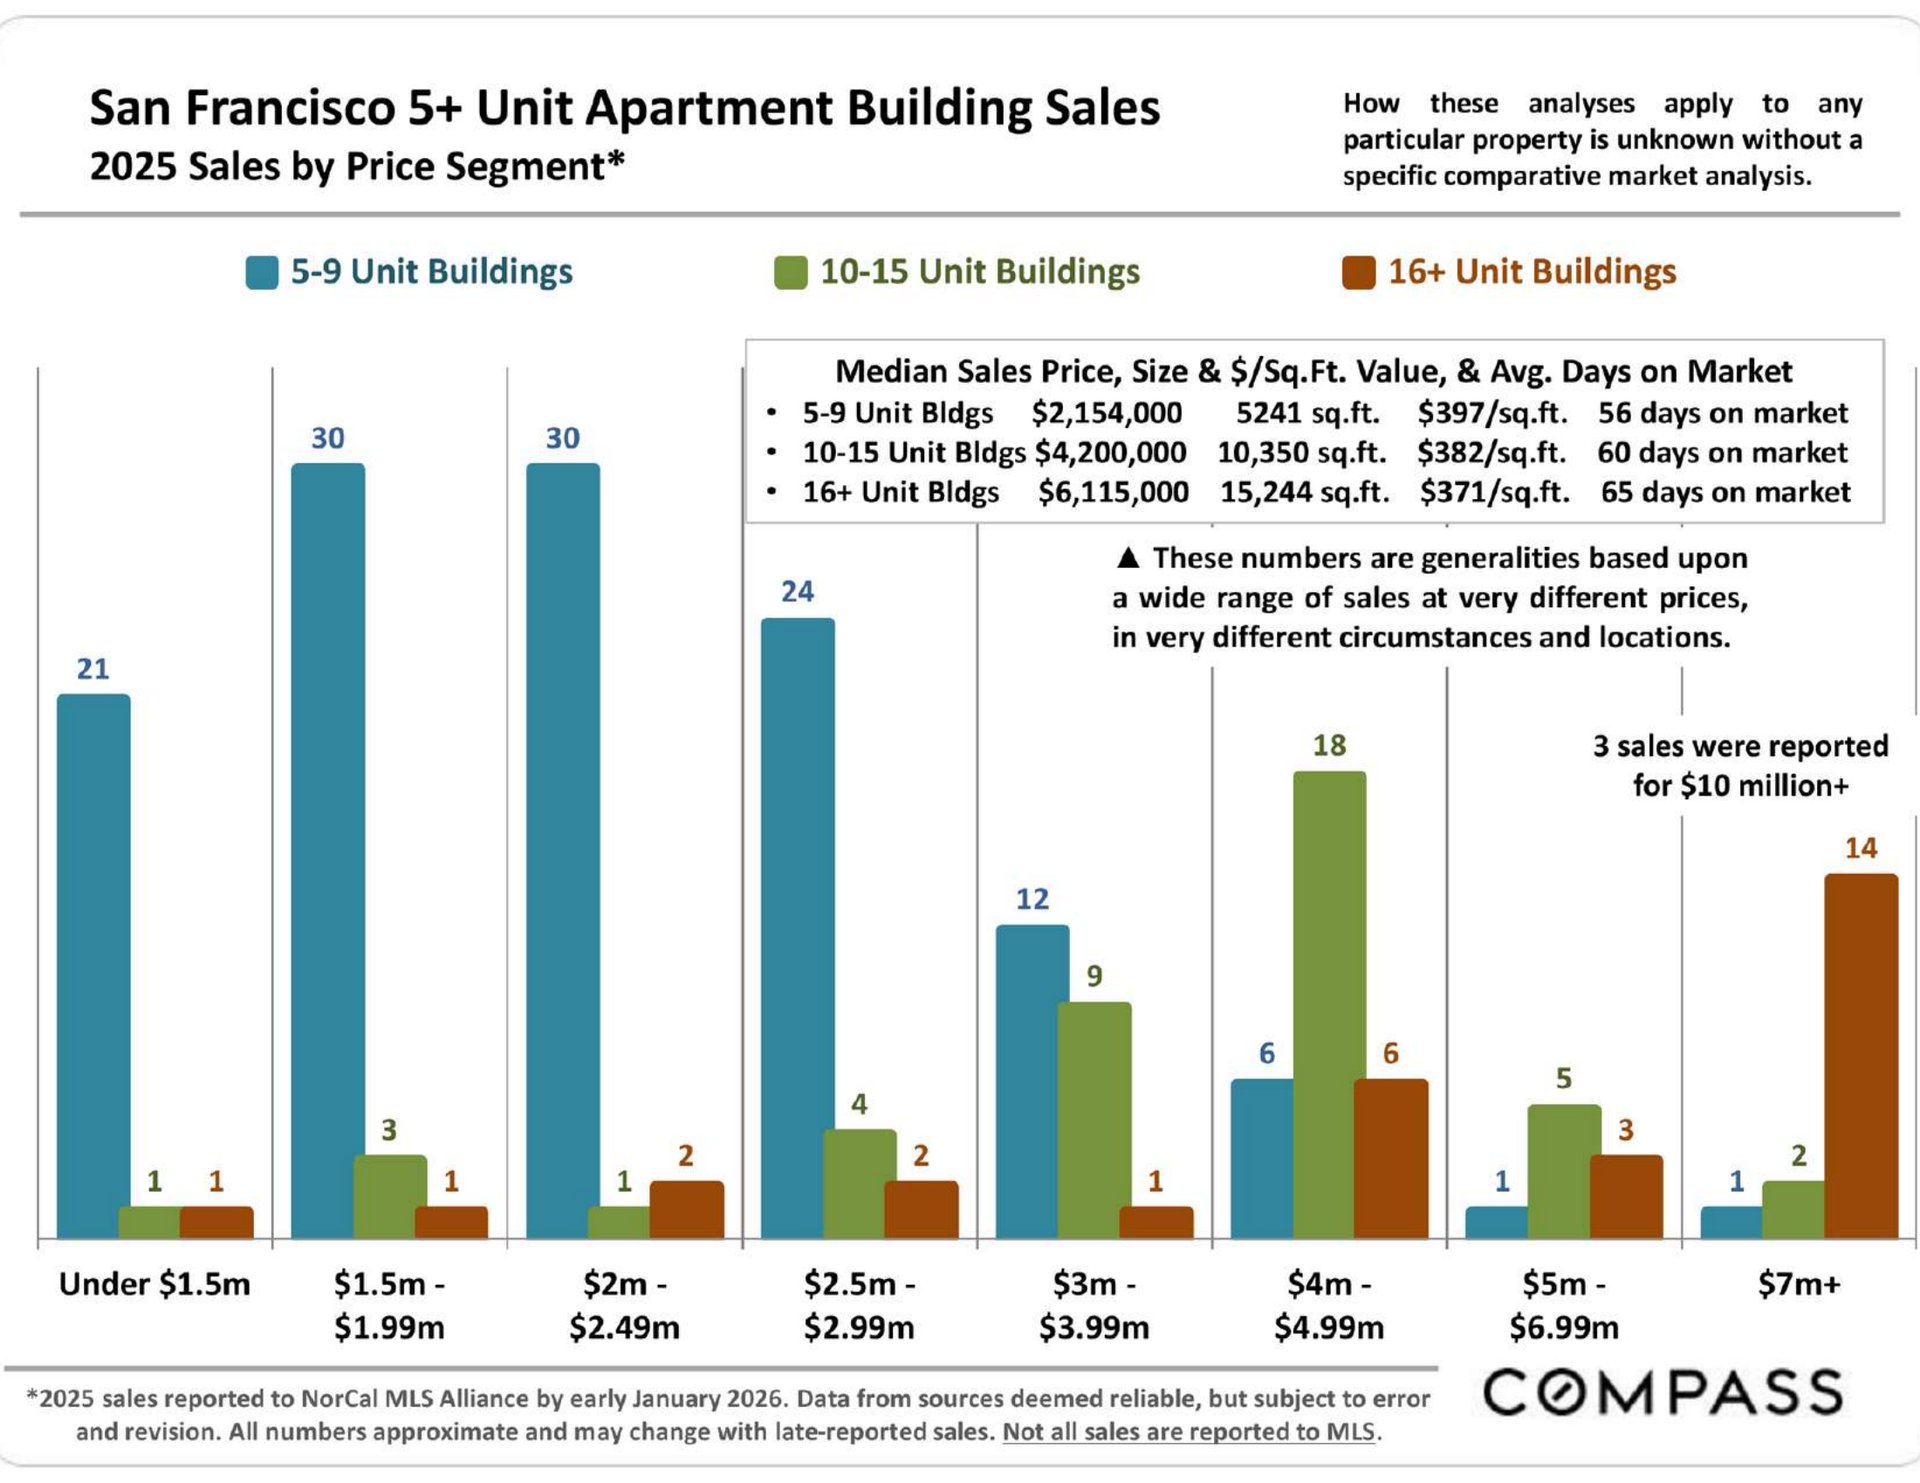
Chart of 2025 San Francisco apartment building sales by price segment and unit count, with median prices and market statistics.

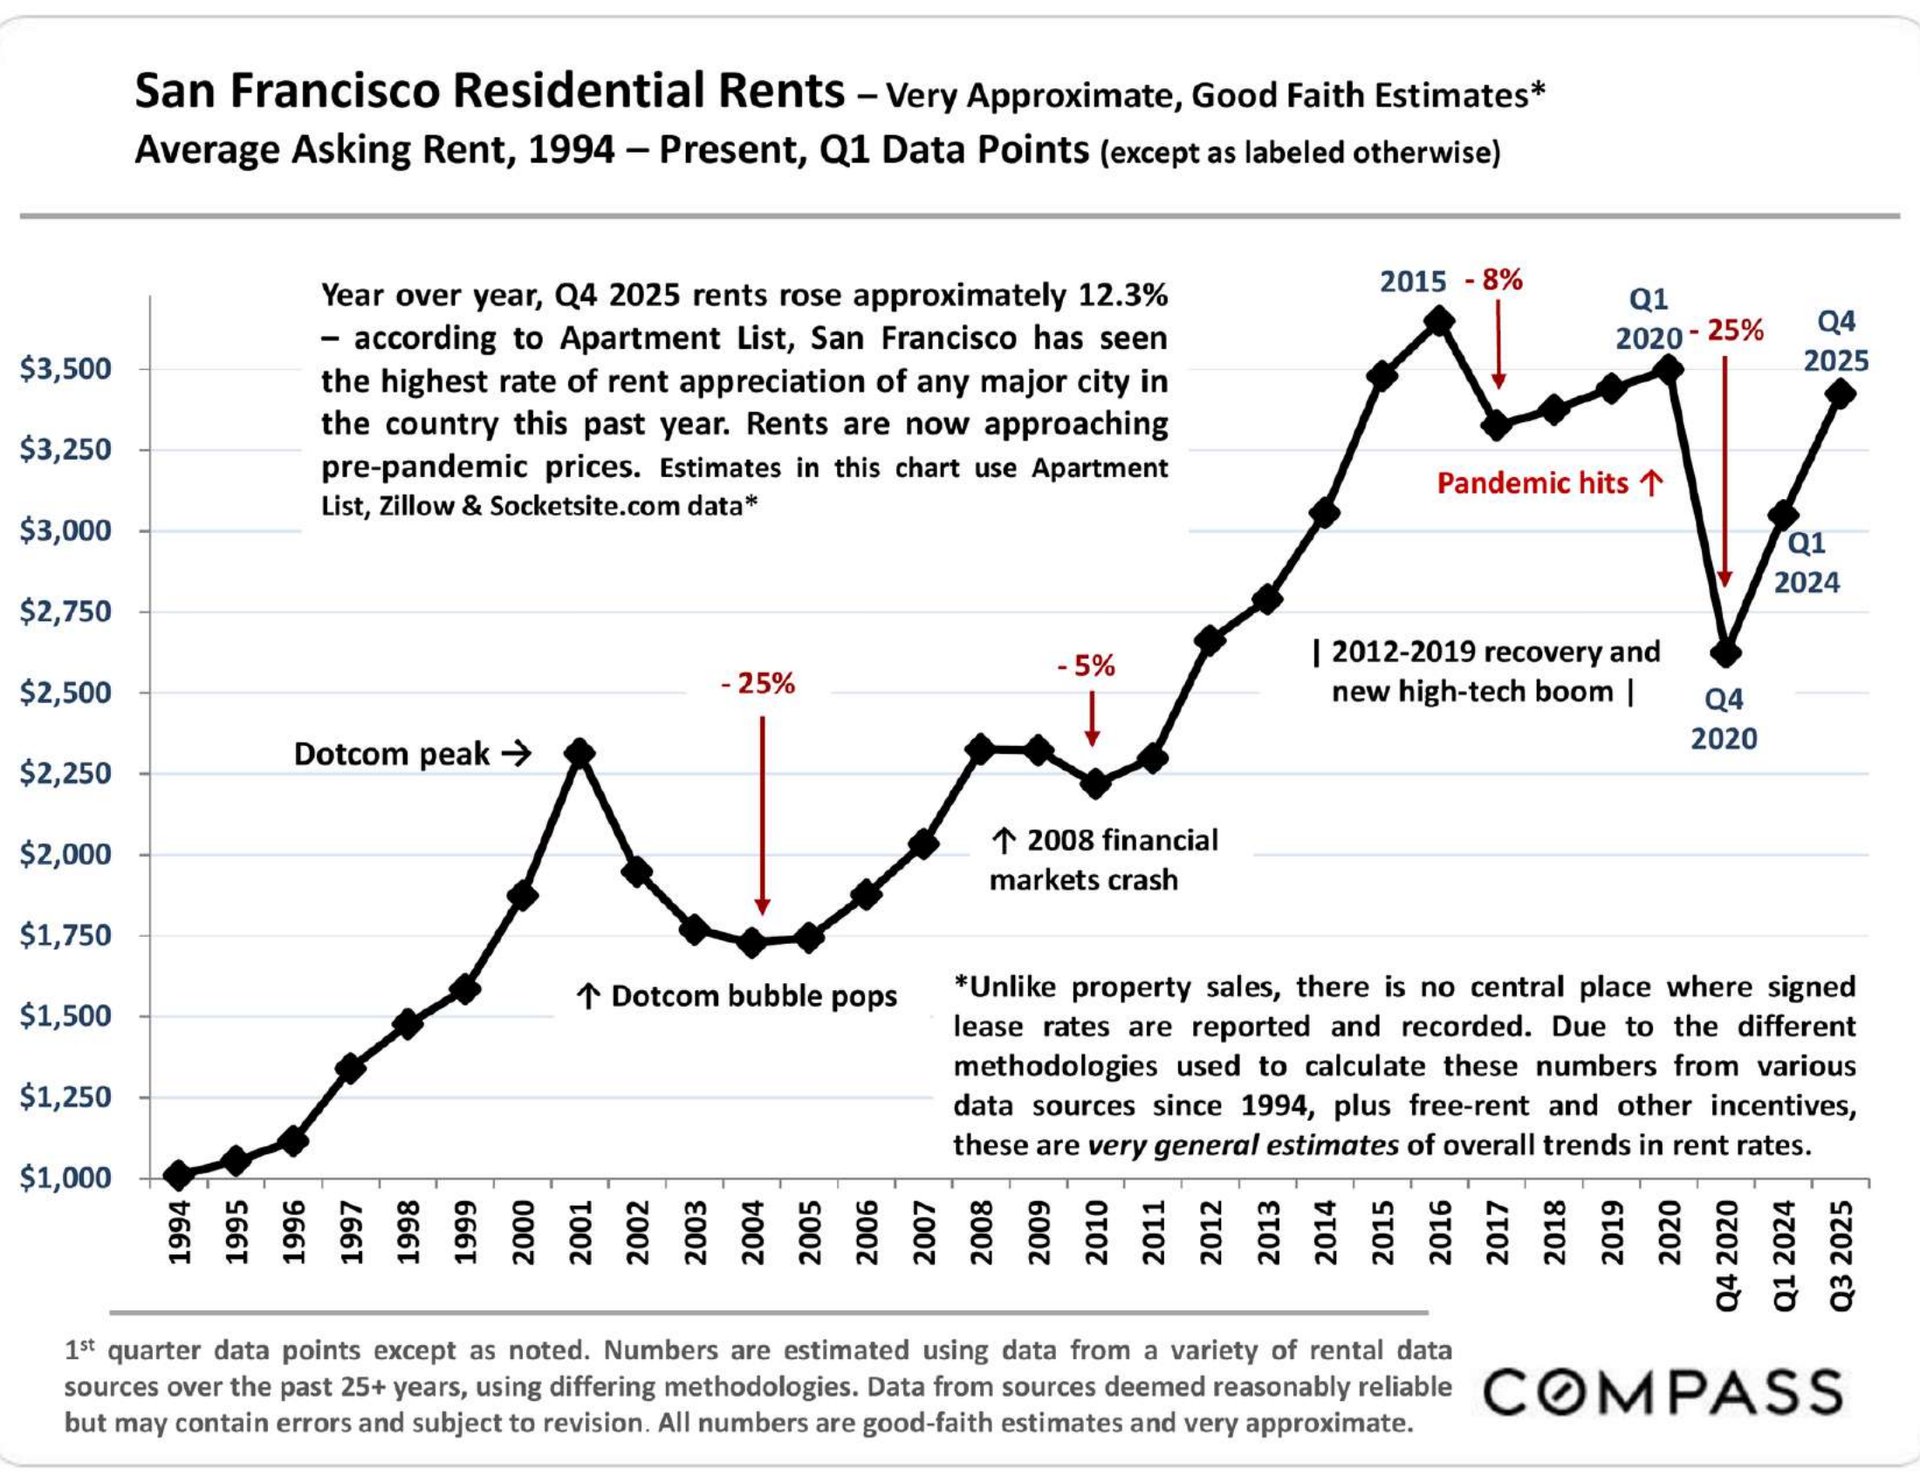
Chart of estimated San Francisco asking rents from 1994 to 2025, including the pandemic-era decline and recovery.

Selected Economic Indicators section title

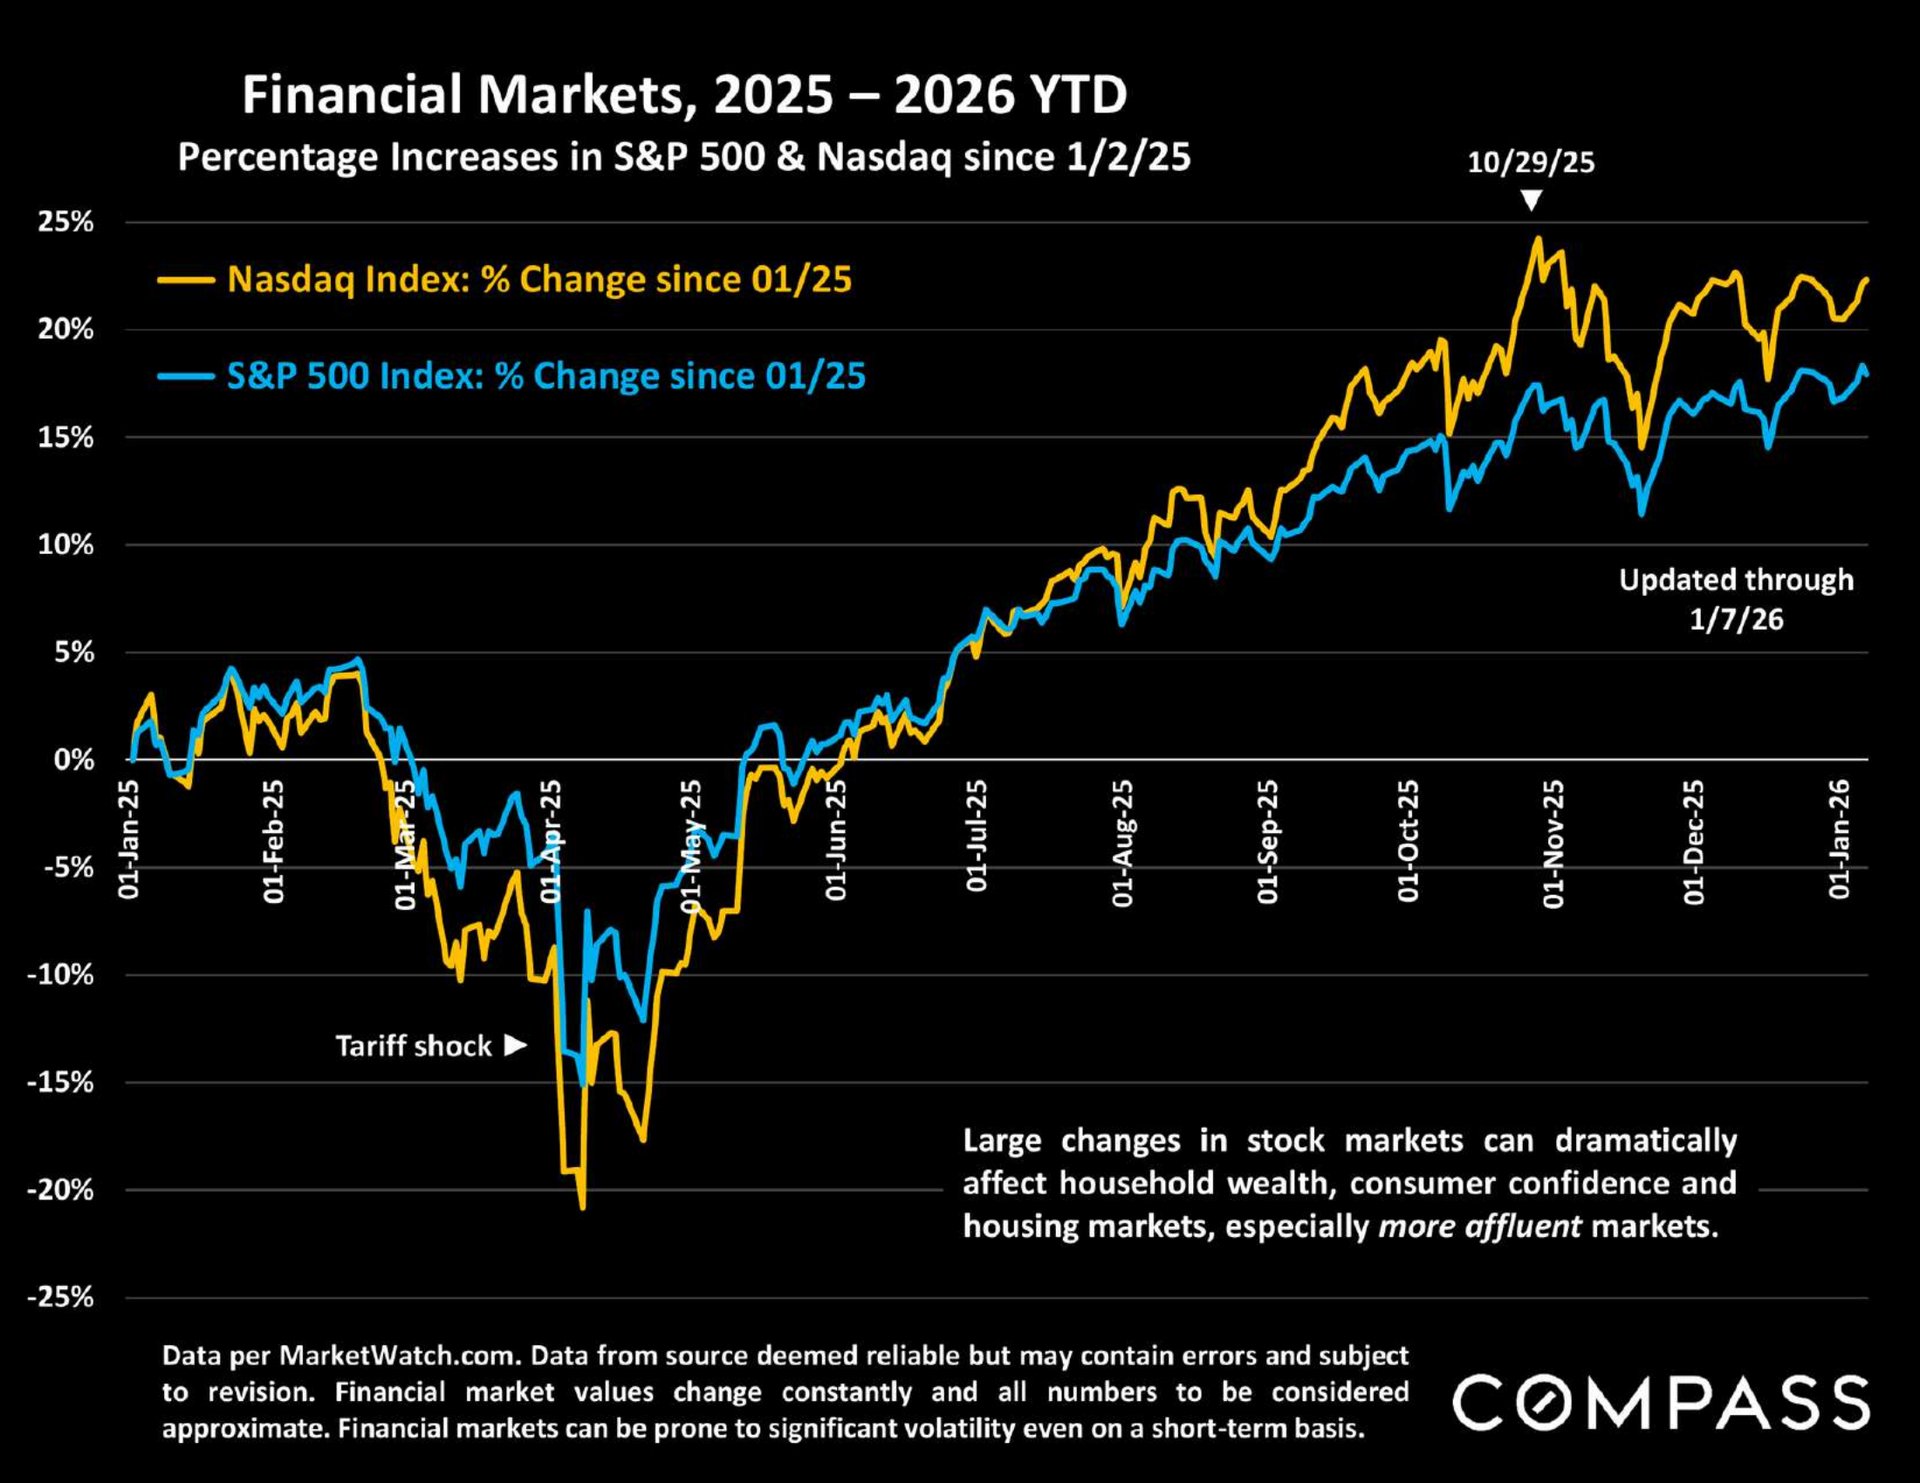
Chart comparing Nasdaq and S&P 500 gains from January 2025 to January 2026, with a sharp spring decline and subsequent recovery.

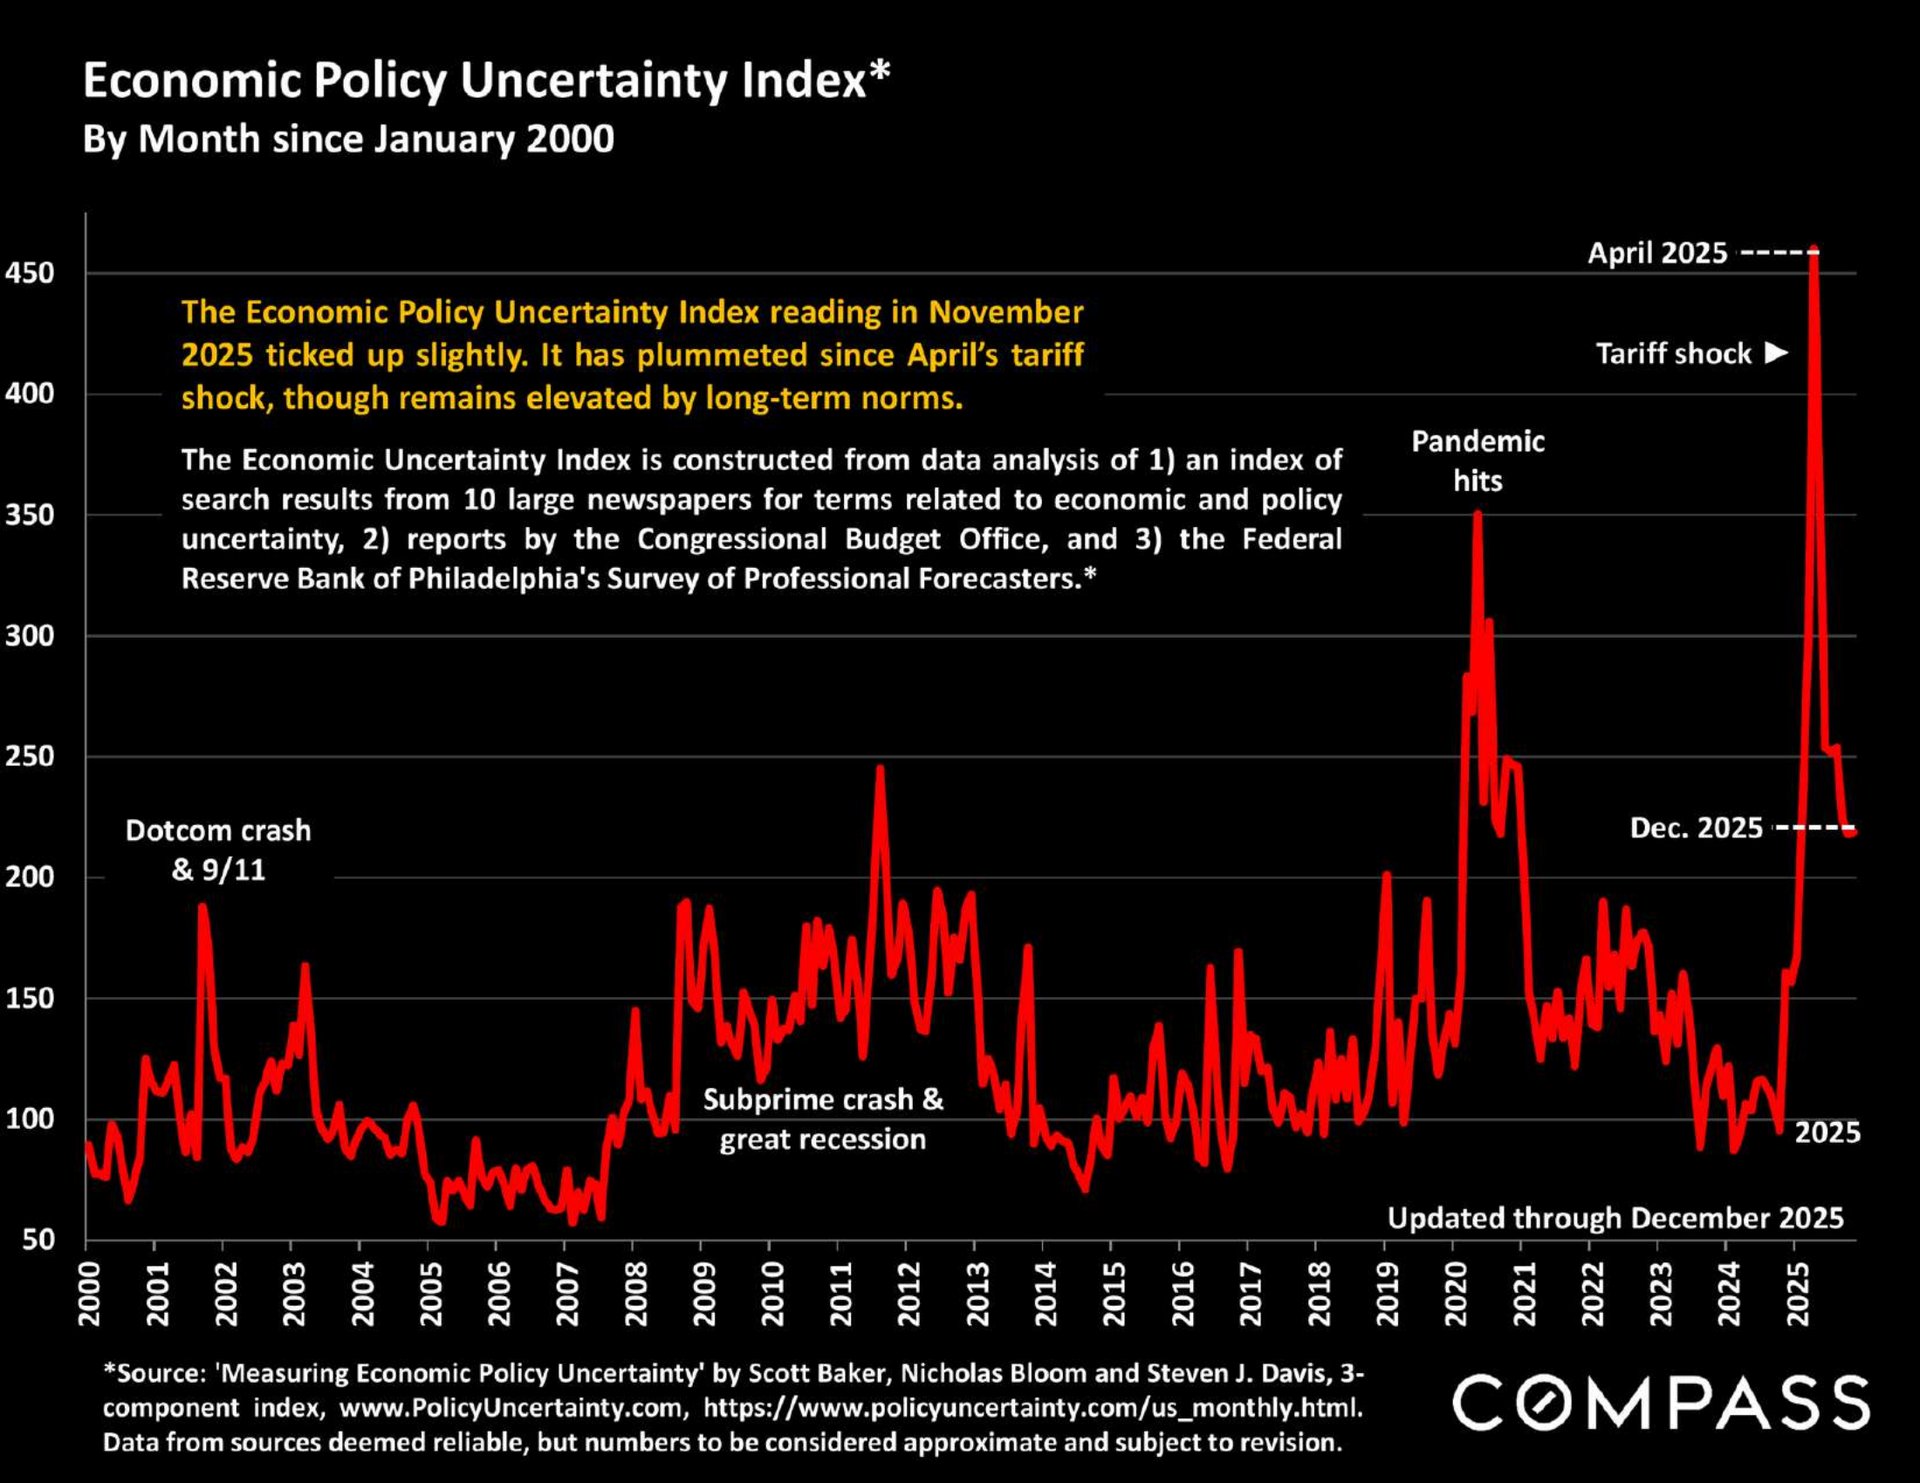
Economic Policy Uncertainty Index chart, 2000–2025, with a prominent spike during the April 2025 tariff shock.

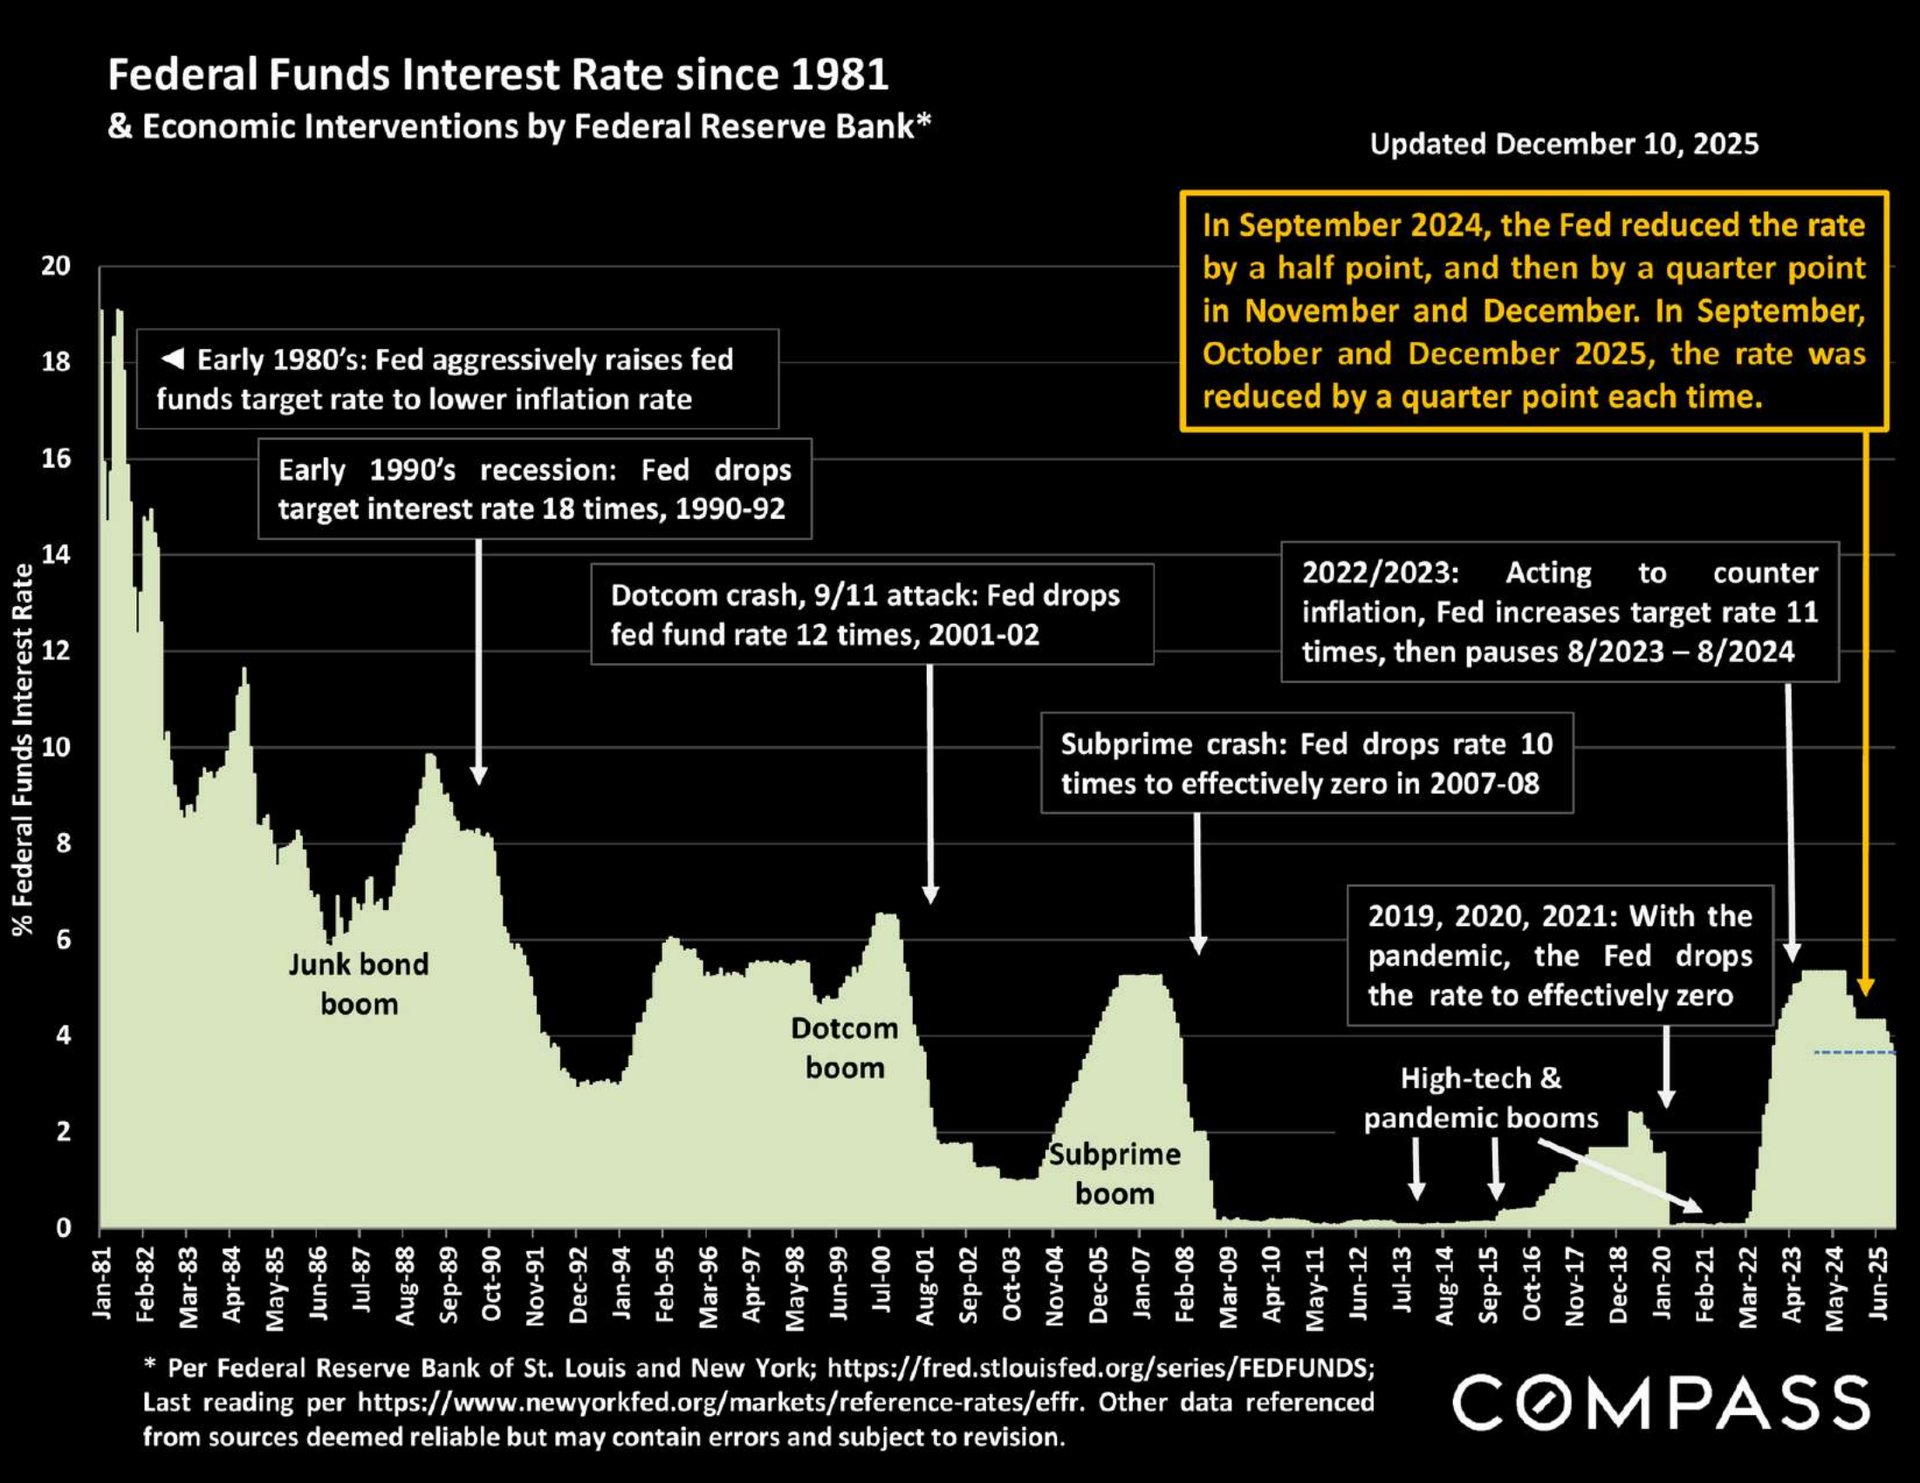
Chart tracing federal funds interest rates from 1981 to 2025, annotated with economic interventions and rate changes.

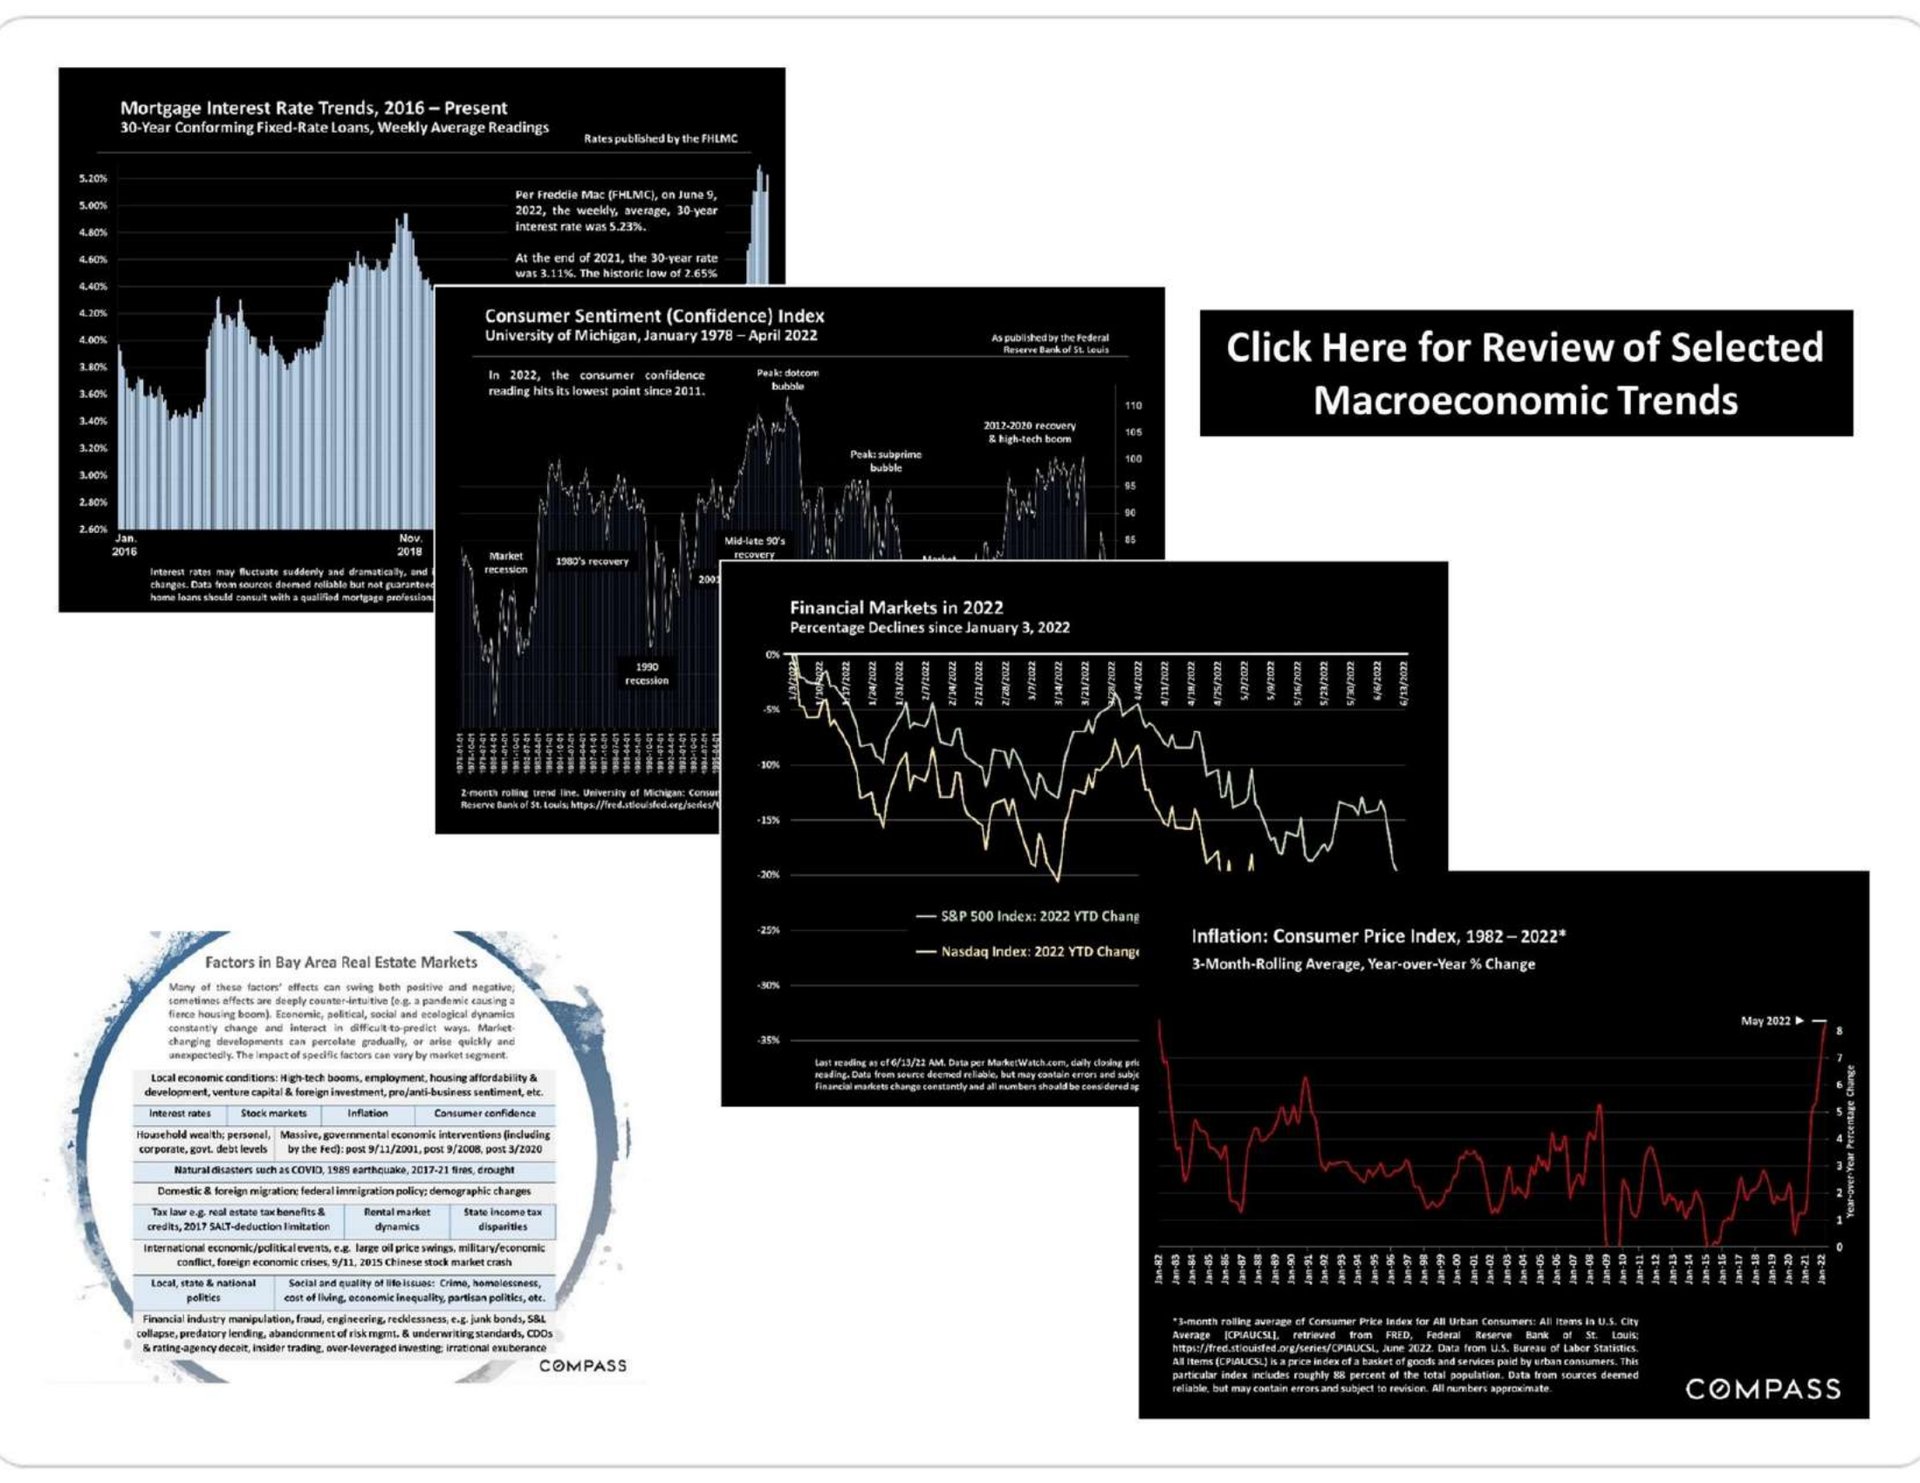
Collage of economic charts on mortgage rates, consumer confidence, market declines, inflation, and Bay Area real estate factors.

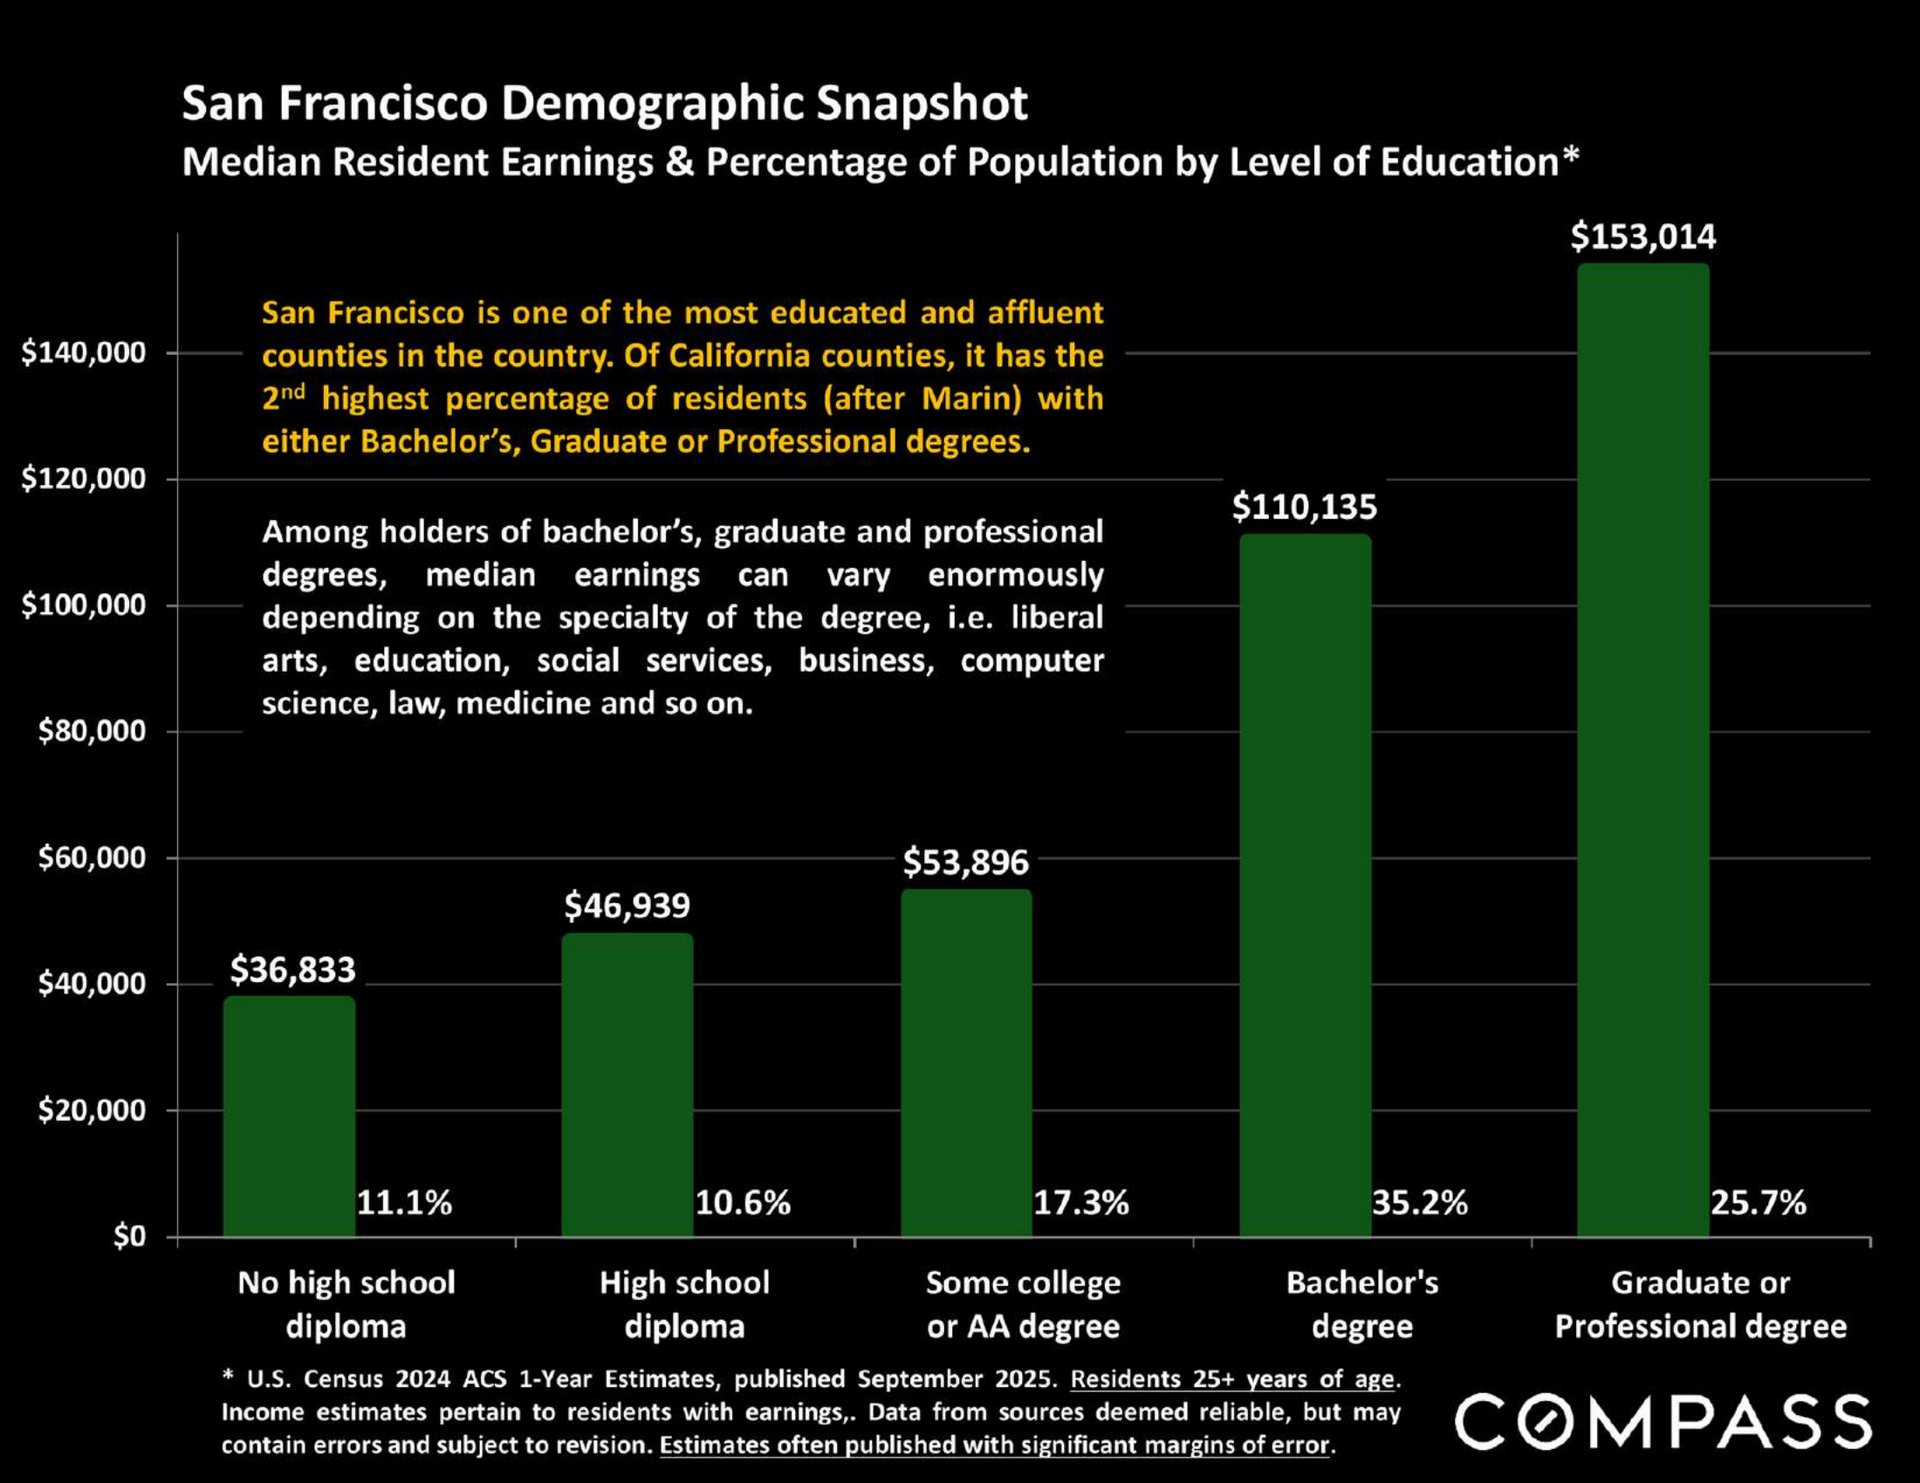
Chart compares San Francisco earnings and population shares across five education levels; graduate and professional degrees show the highest earnings.

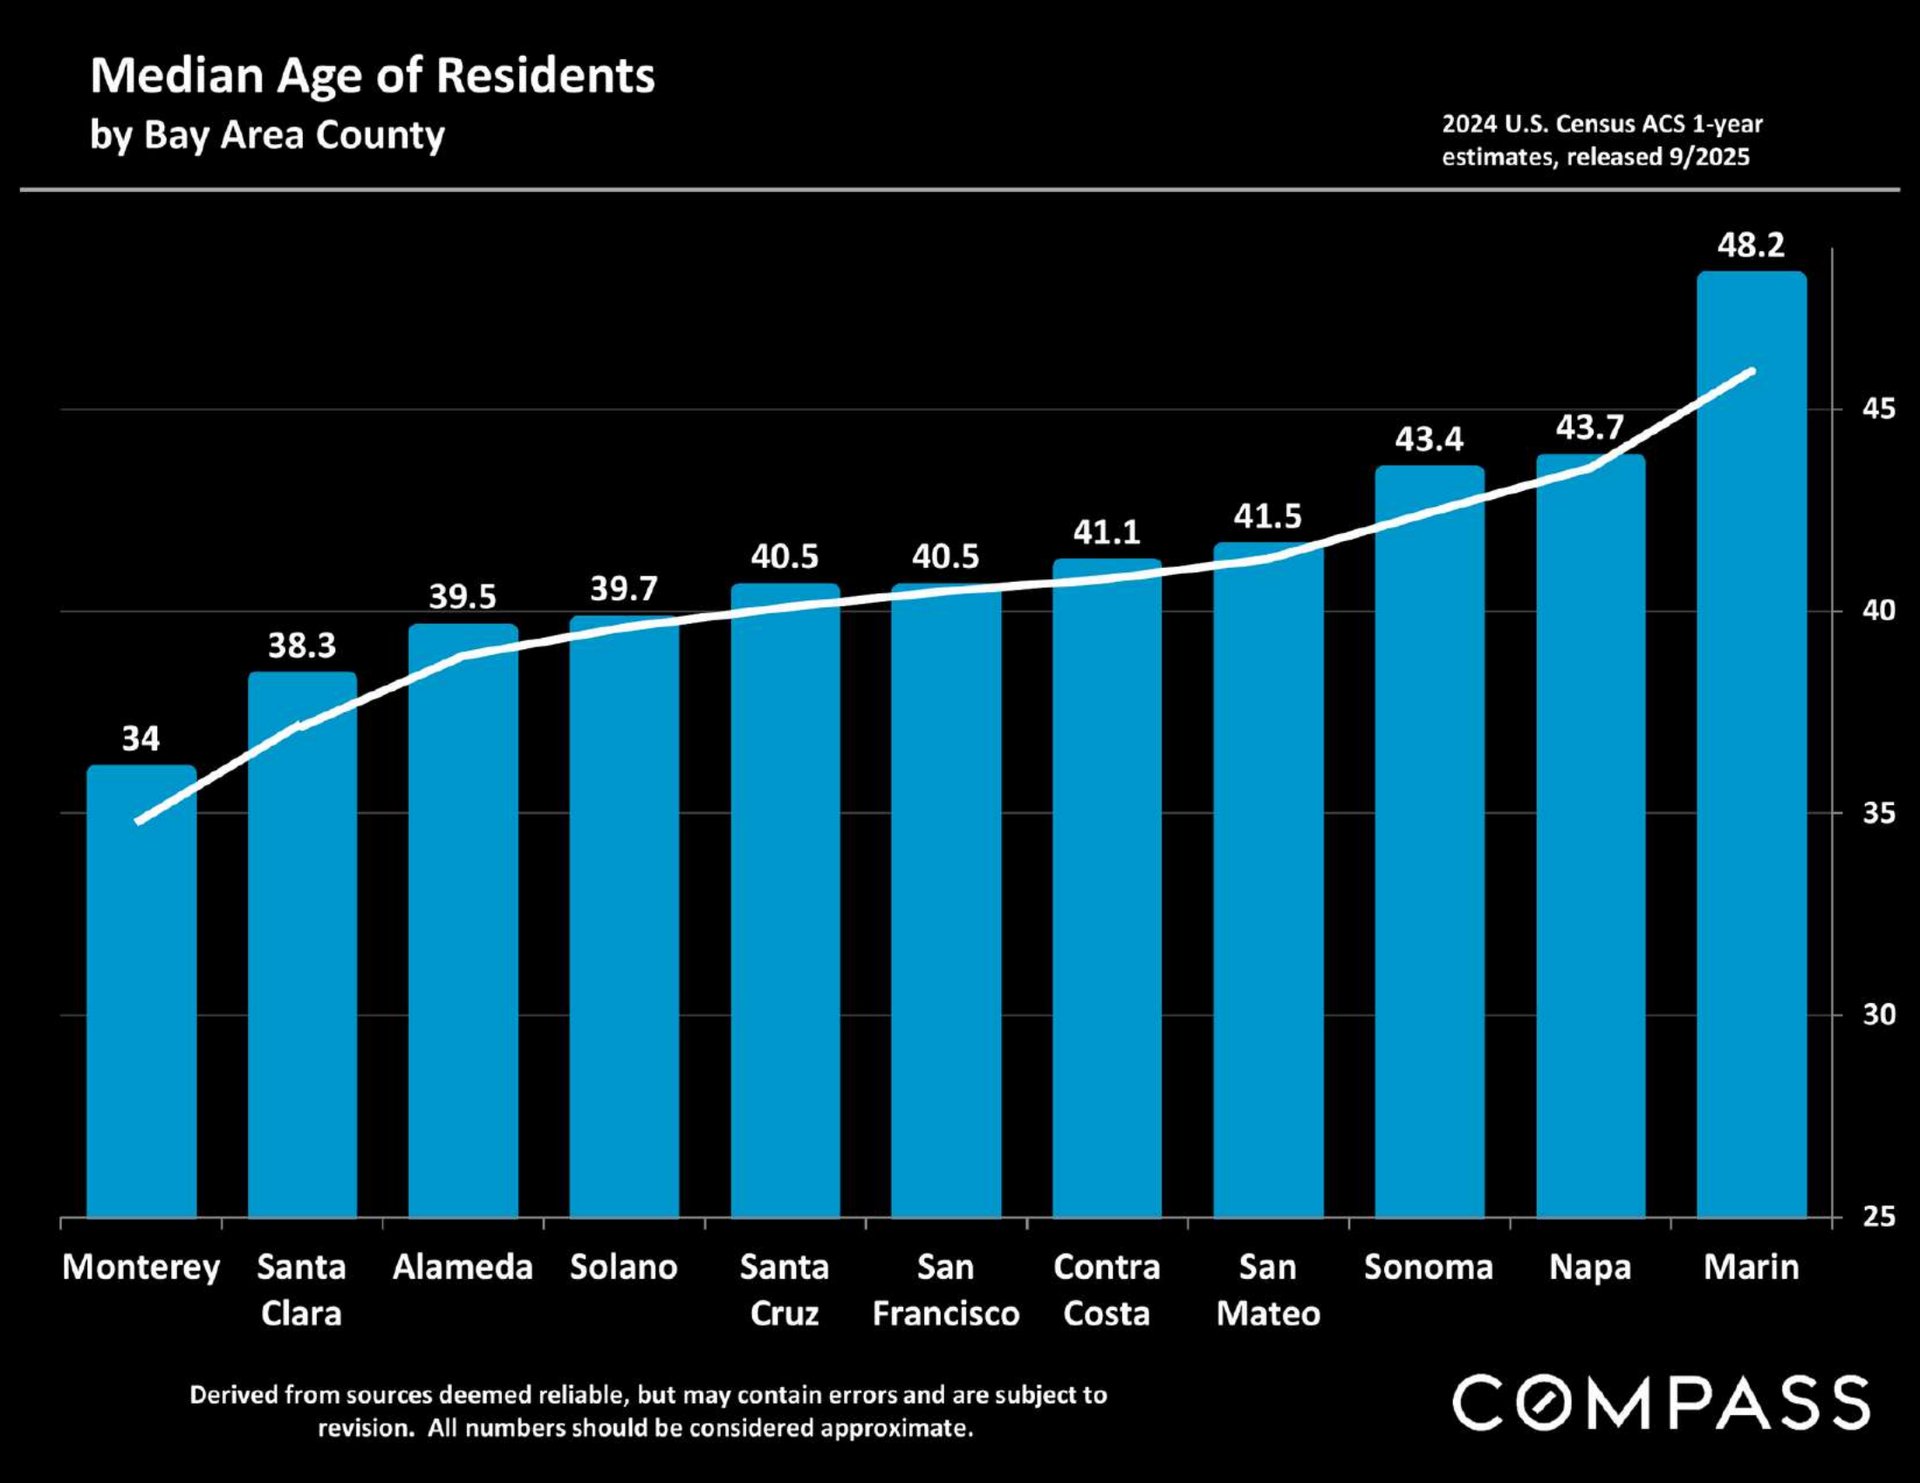
Chart comparing median resident ages across Bay Area counties, from Monterey at 34 to Marin at 48.2.

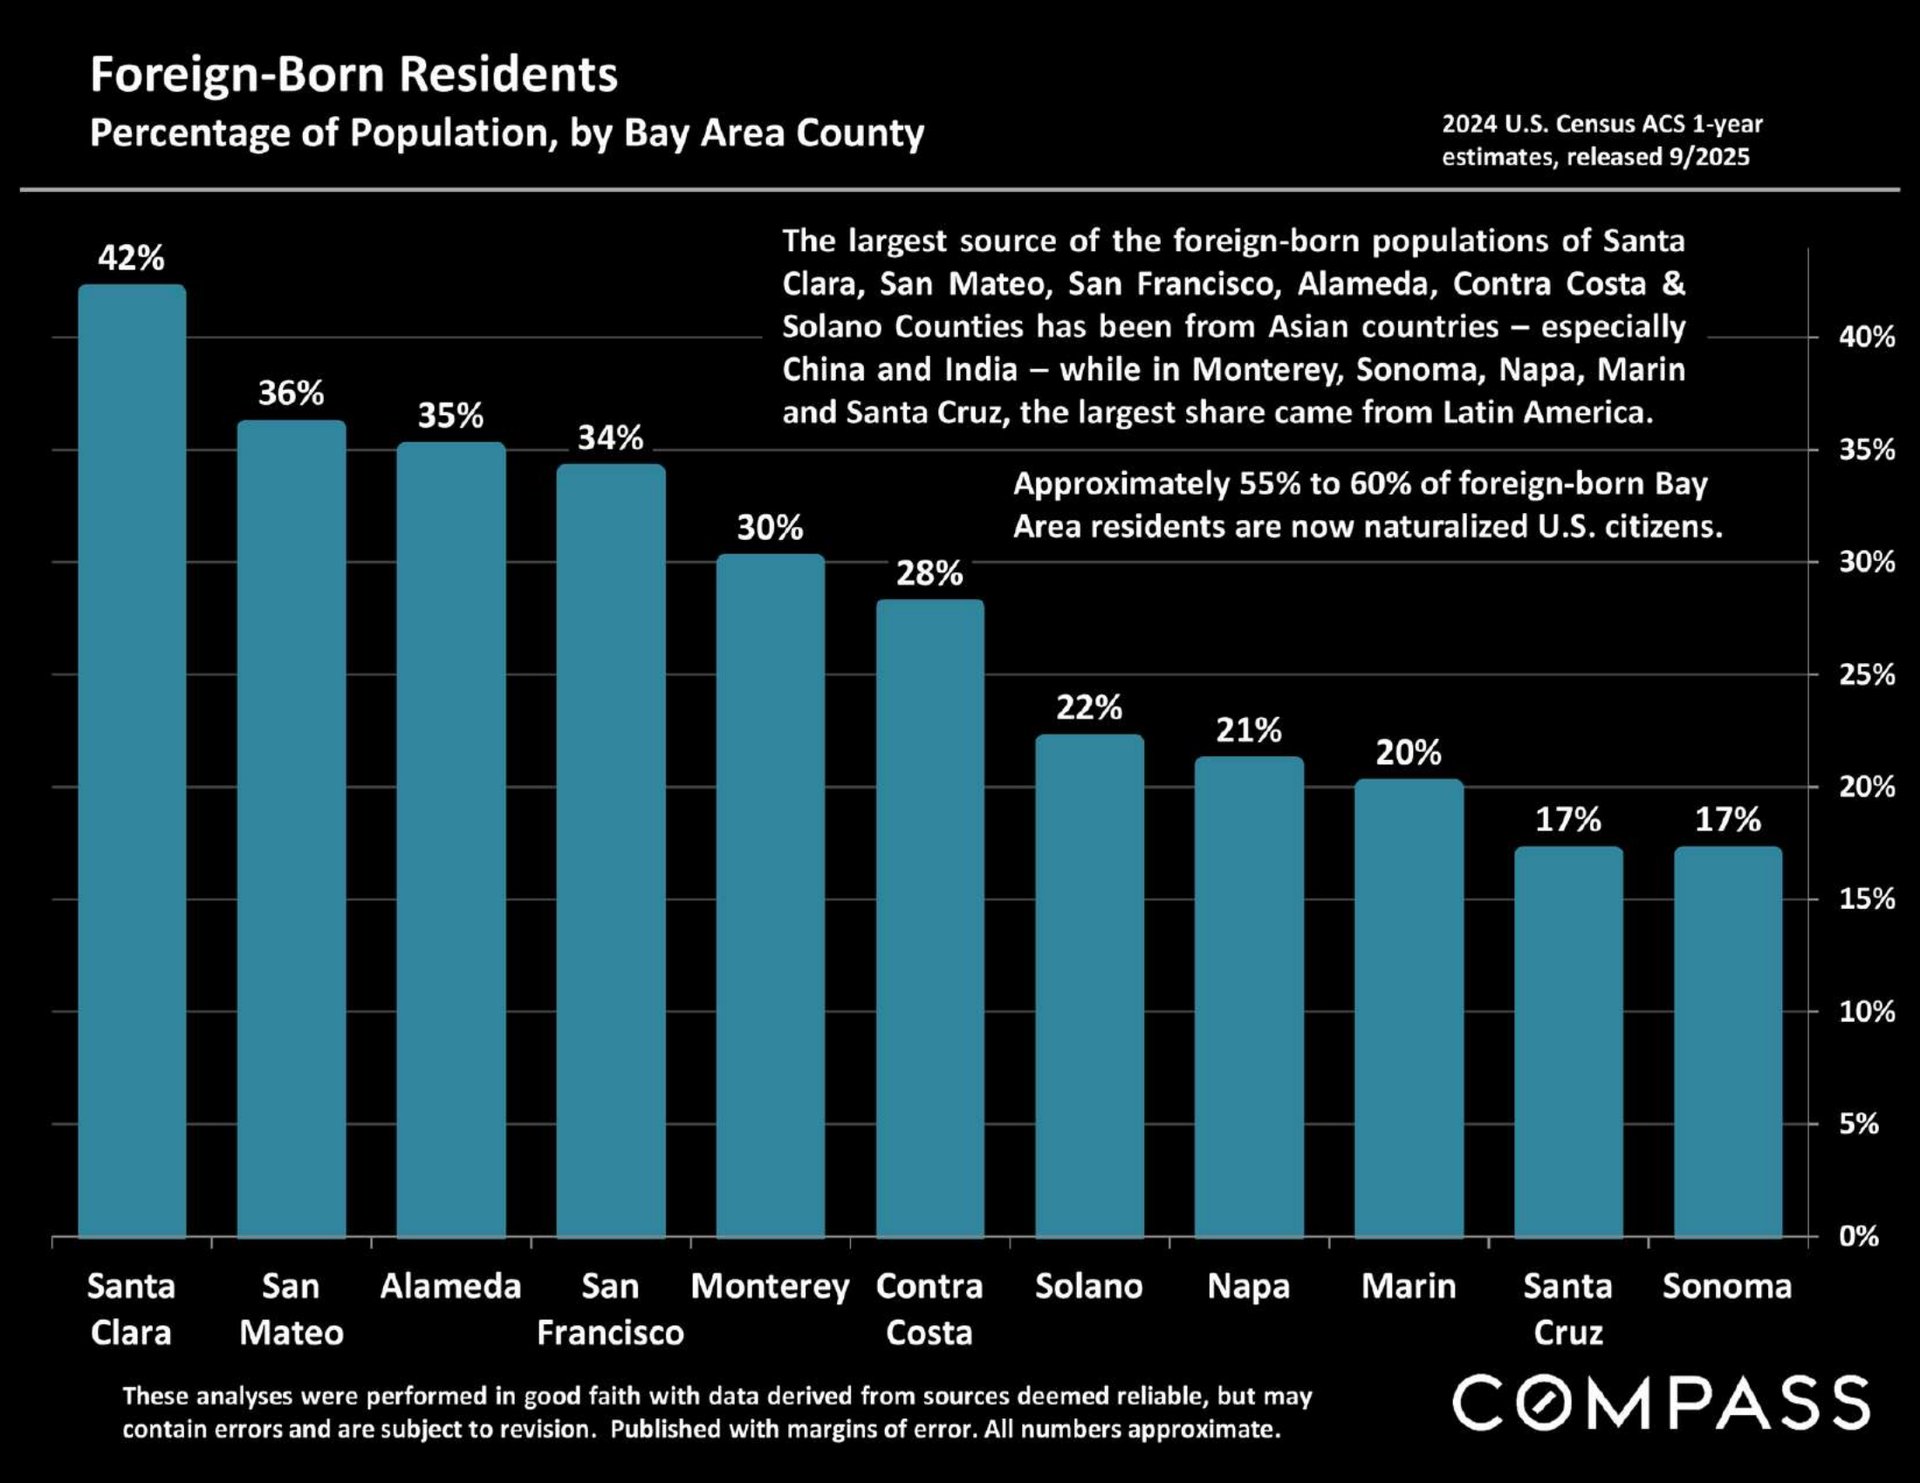
Bar chart compares foreign-born population shares across 11 Bay Area counties, led by Santa Clara at 42%.

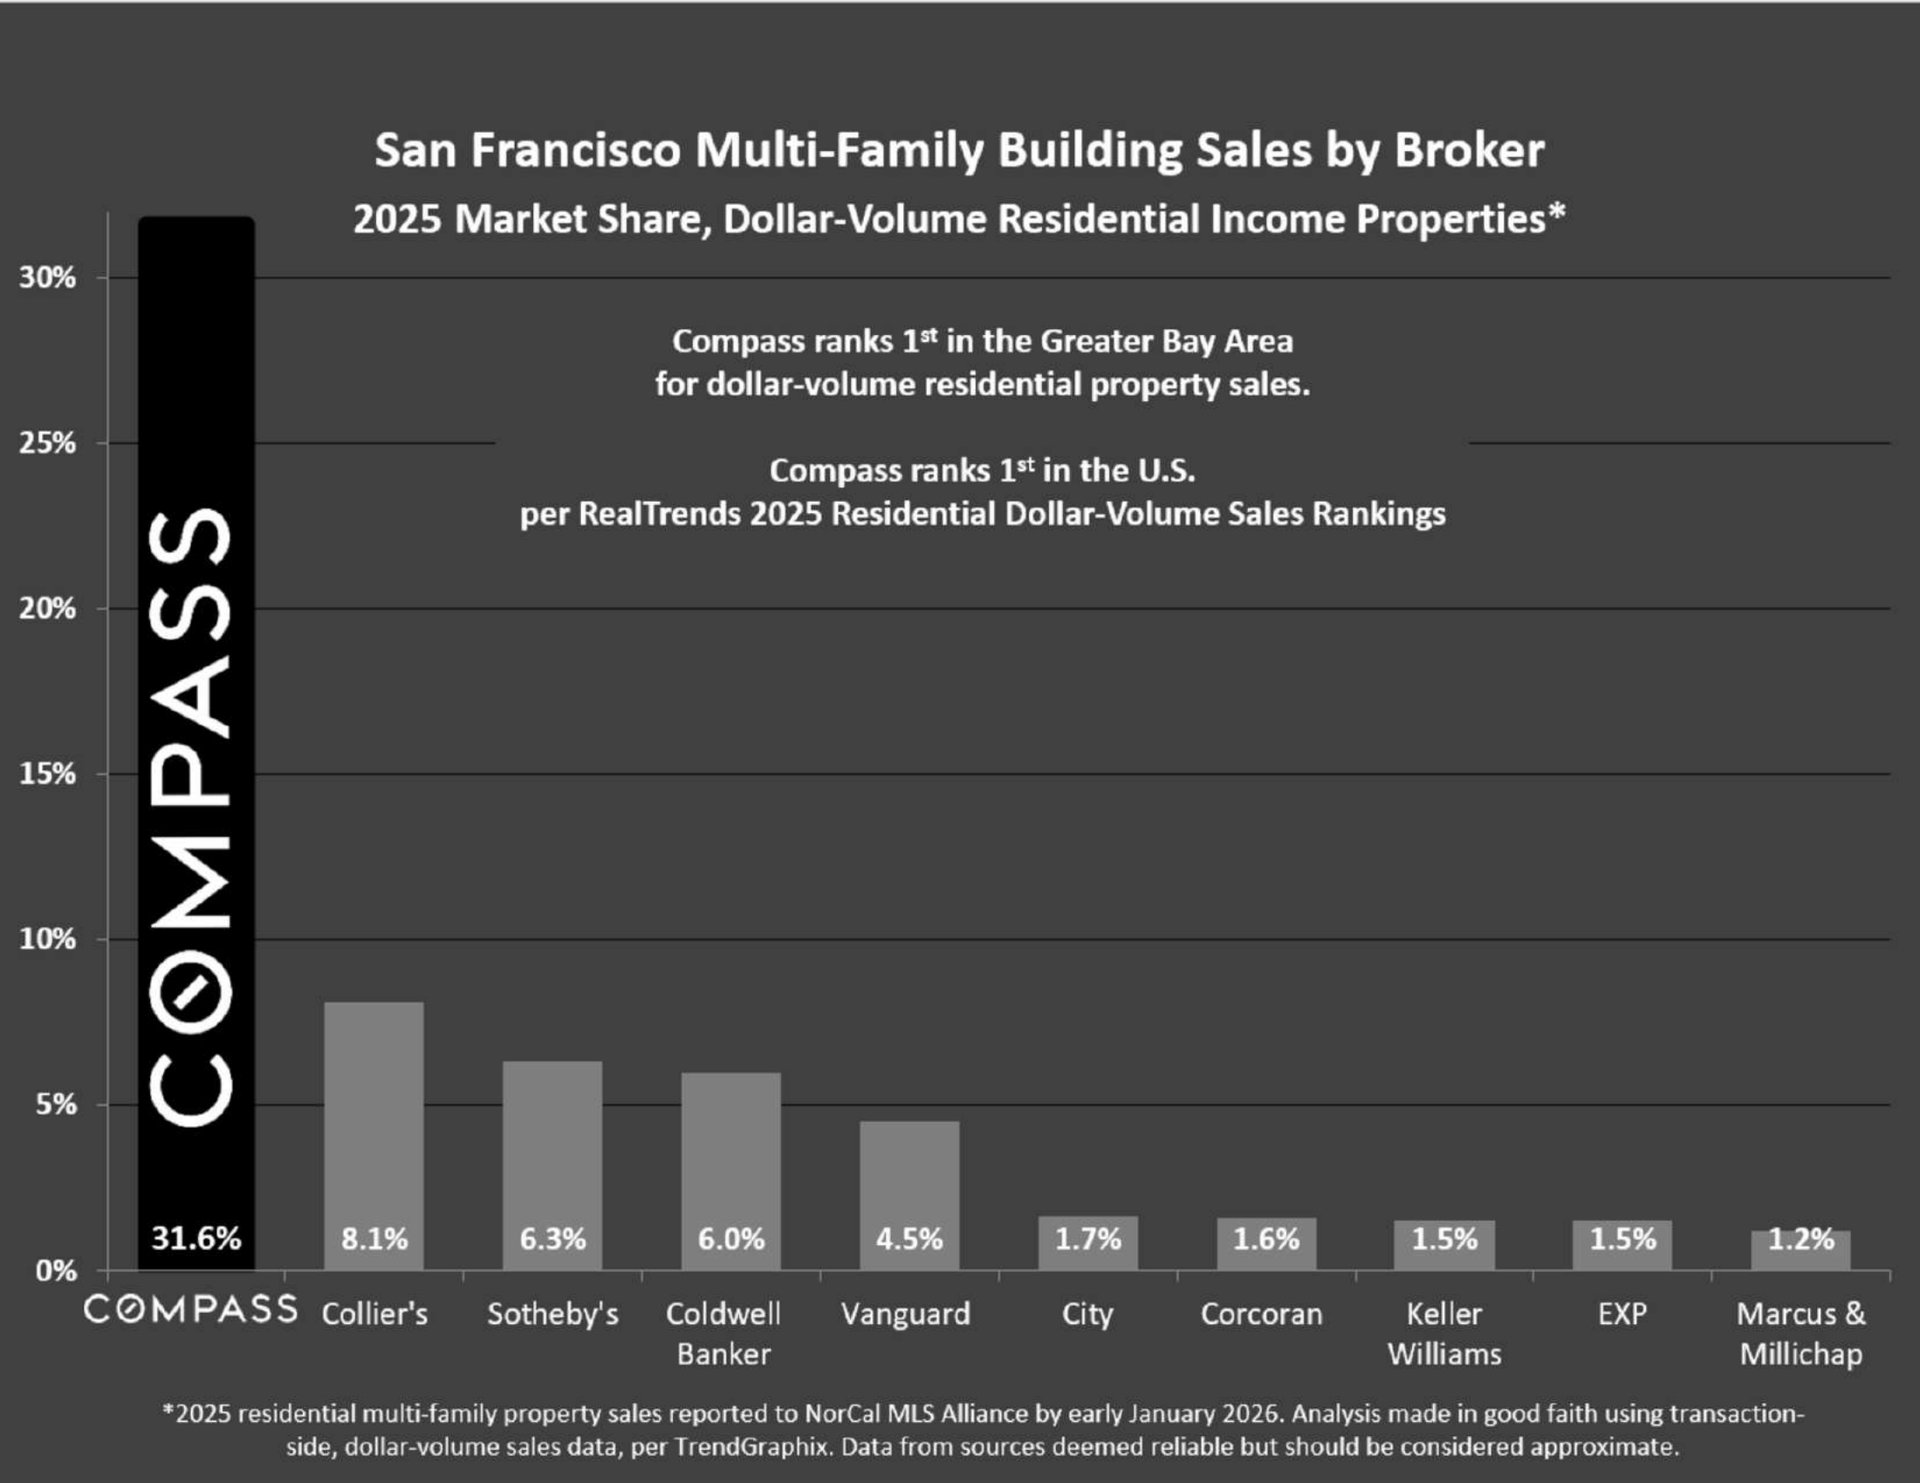
Chart of 2025 San Francisco multifamily sales by broker, with Compass leading at 31.6% market share.

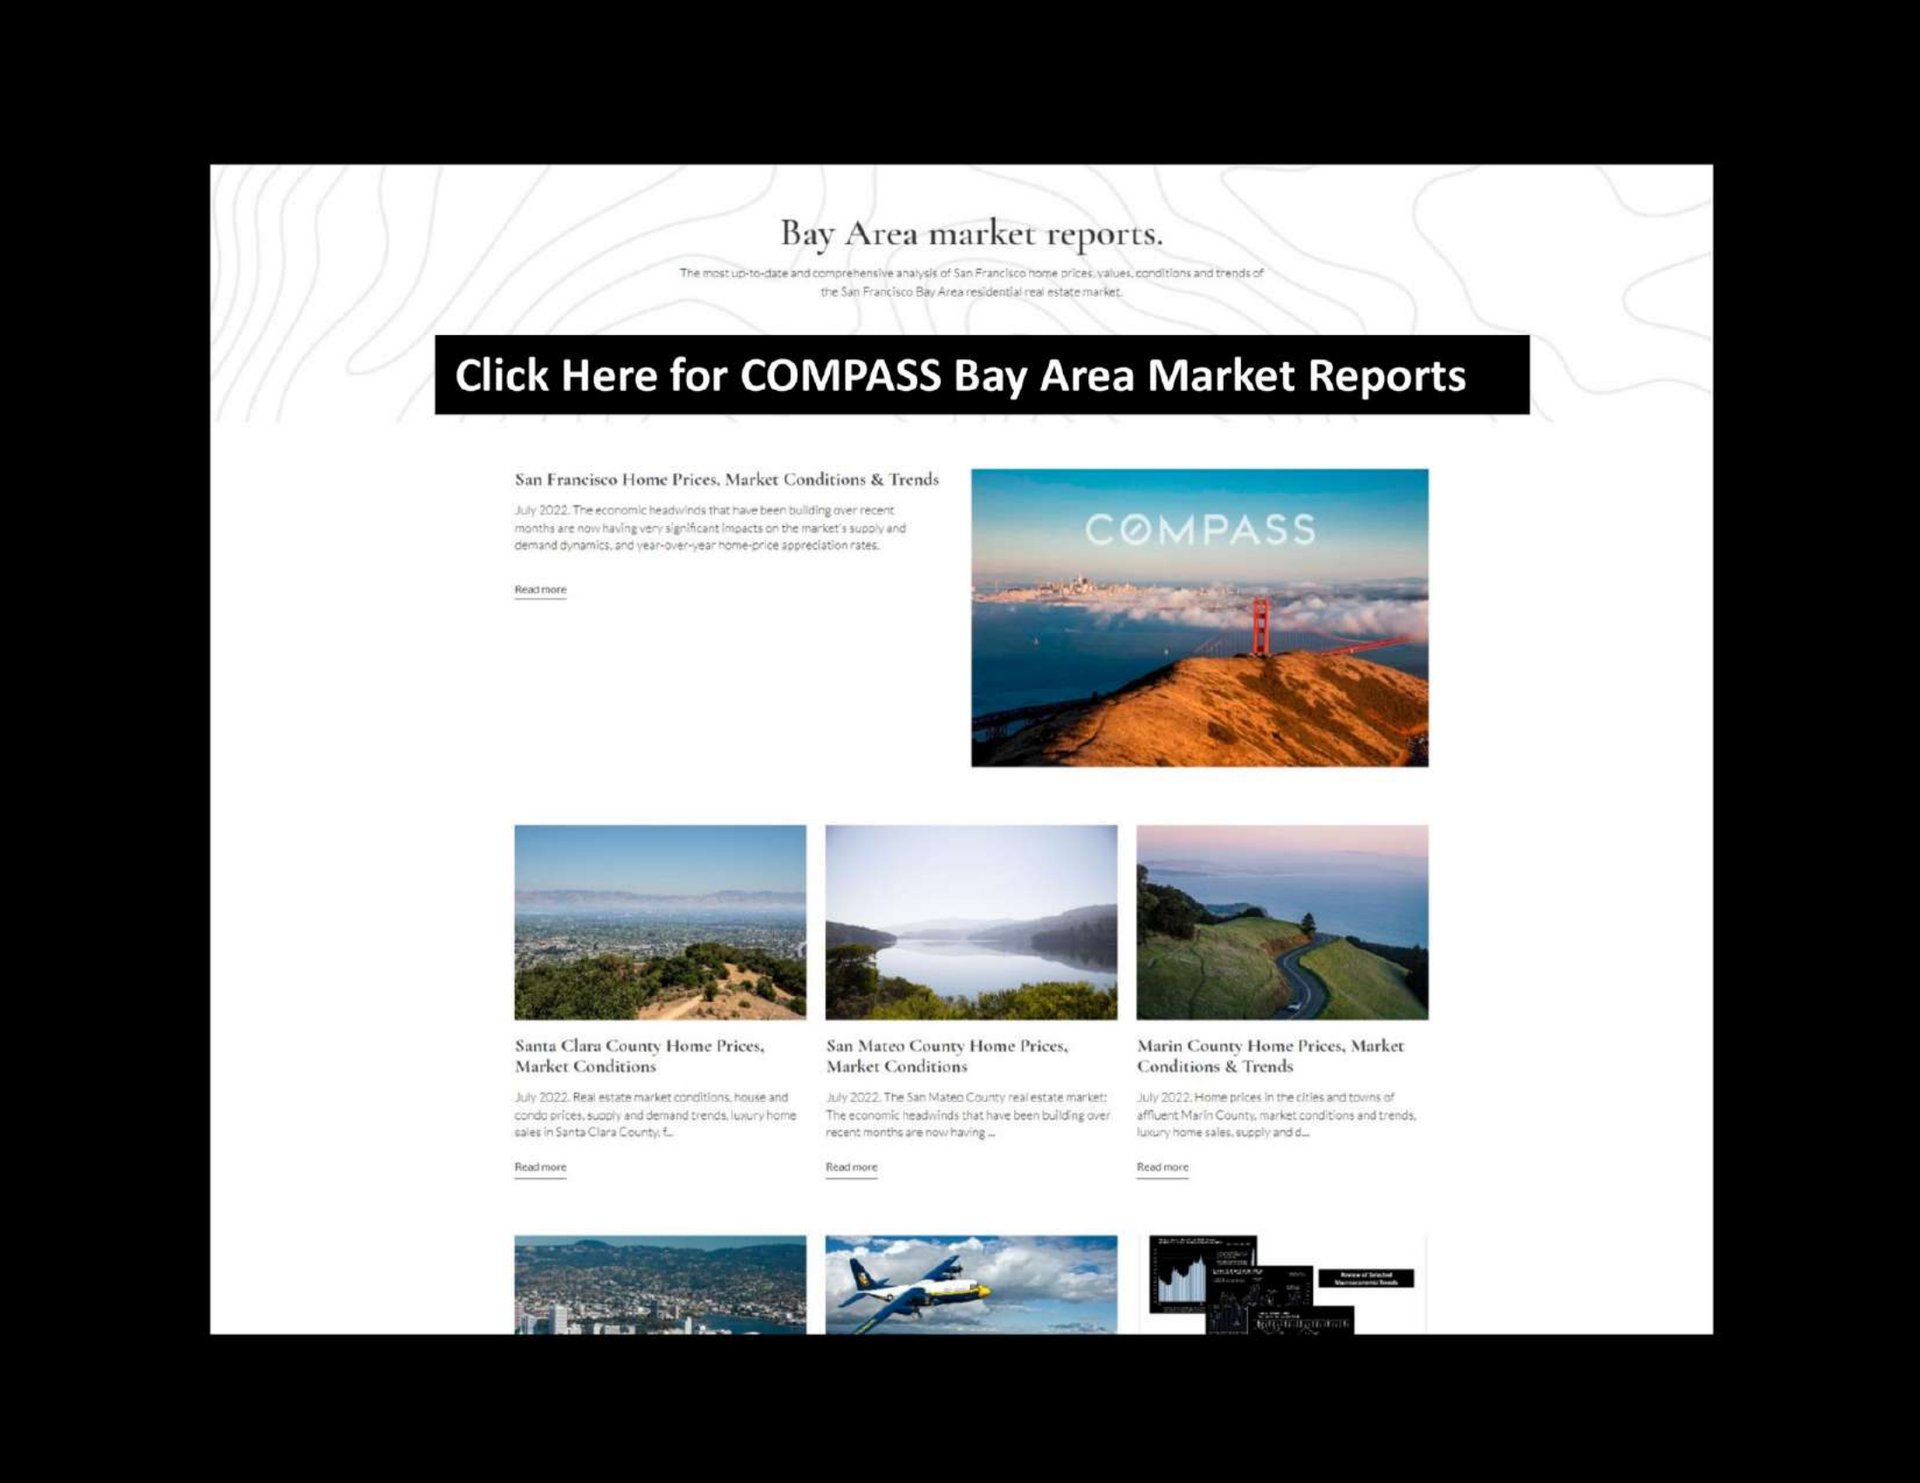
Bay Area market reports webpage with COMPASS banner and regional report listings.Compass market report disclaimer page with statistical caveats, legal disclosures, and Compass branding.


Work With Hanna John Azar

During his past experiences, Hanna John Azar has gained particularly strong knowledge and hands-on experience in maneuvering complex multi-faceted value-add investments.
Contact