Blog

SF 2–4 Unit Buildings | Quarterly Report

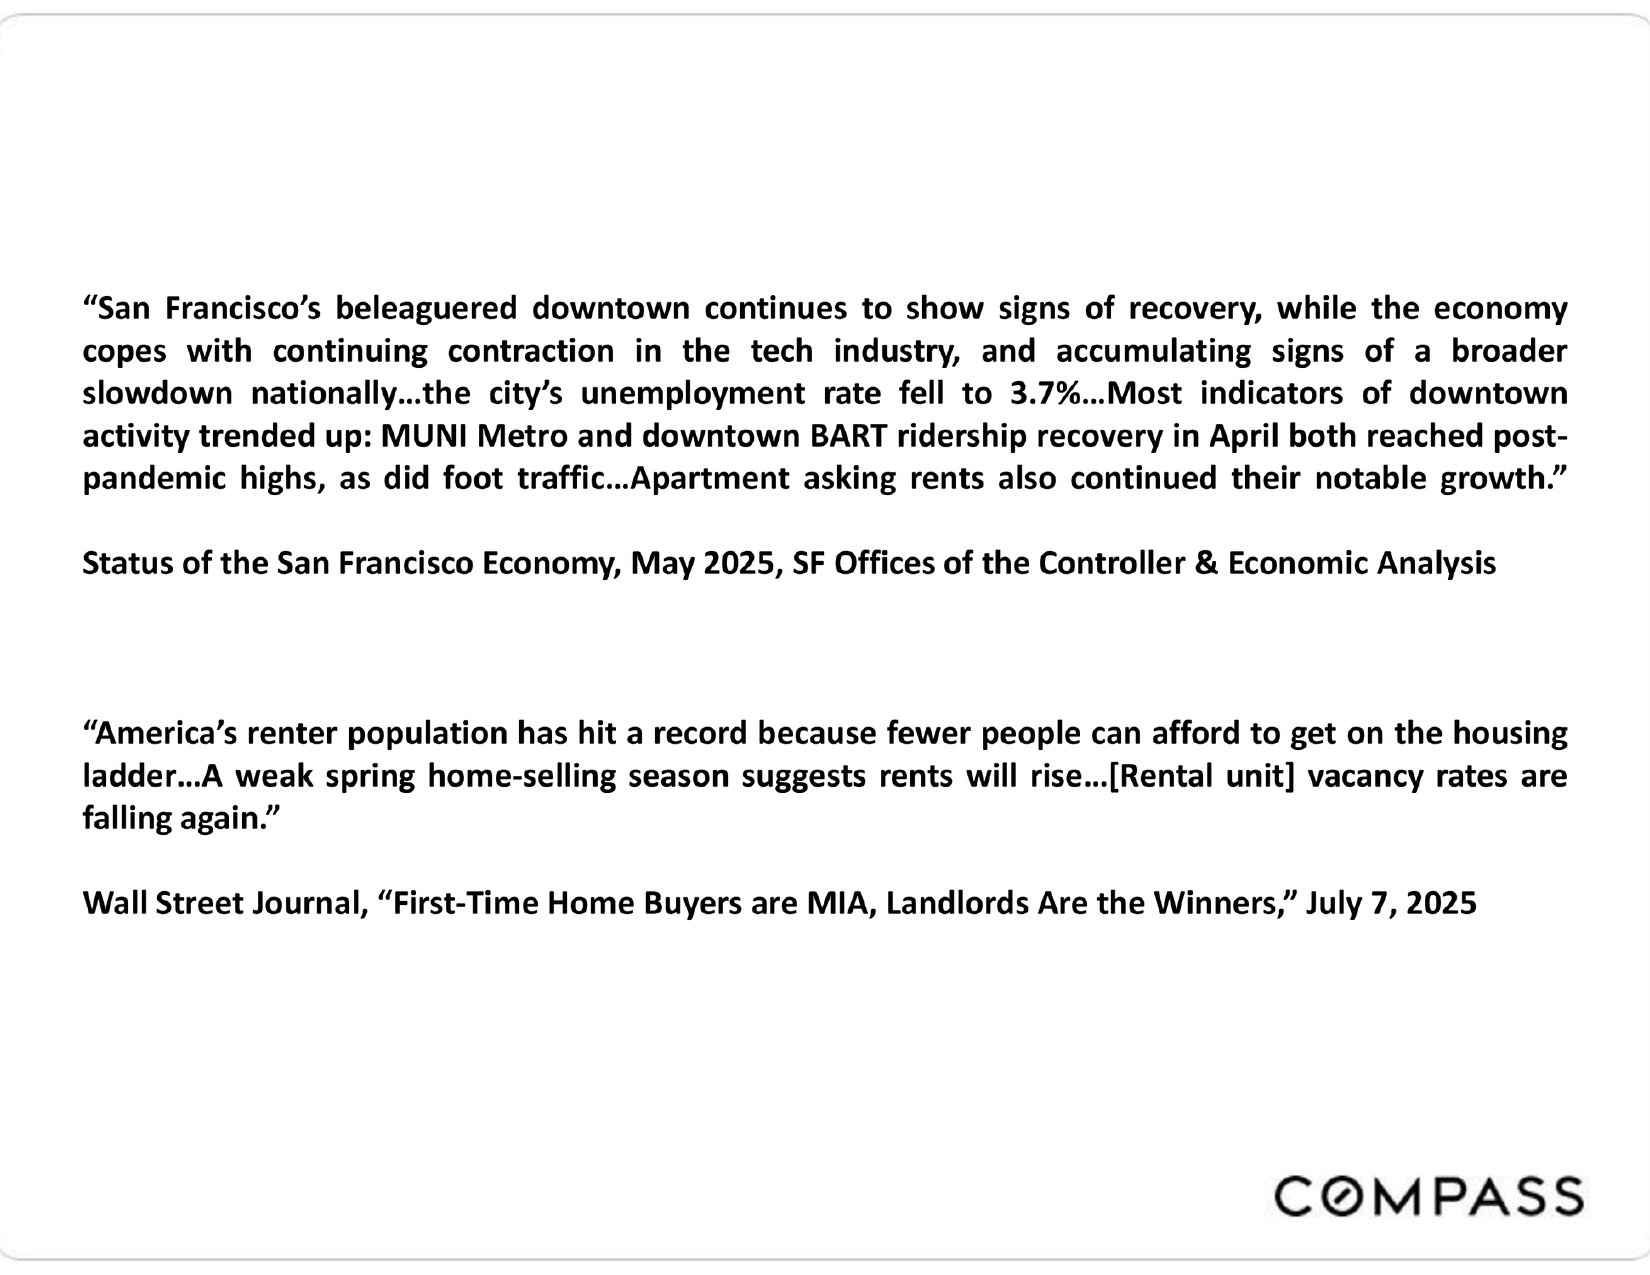
Market commentary on San Francisco’s economic recovery and rising rents, with citations to city data and the Wall Street Journal.

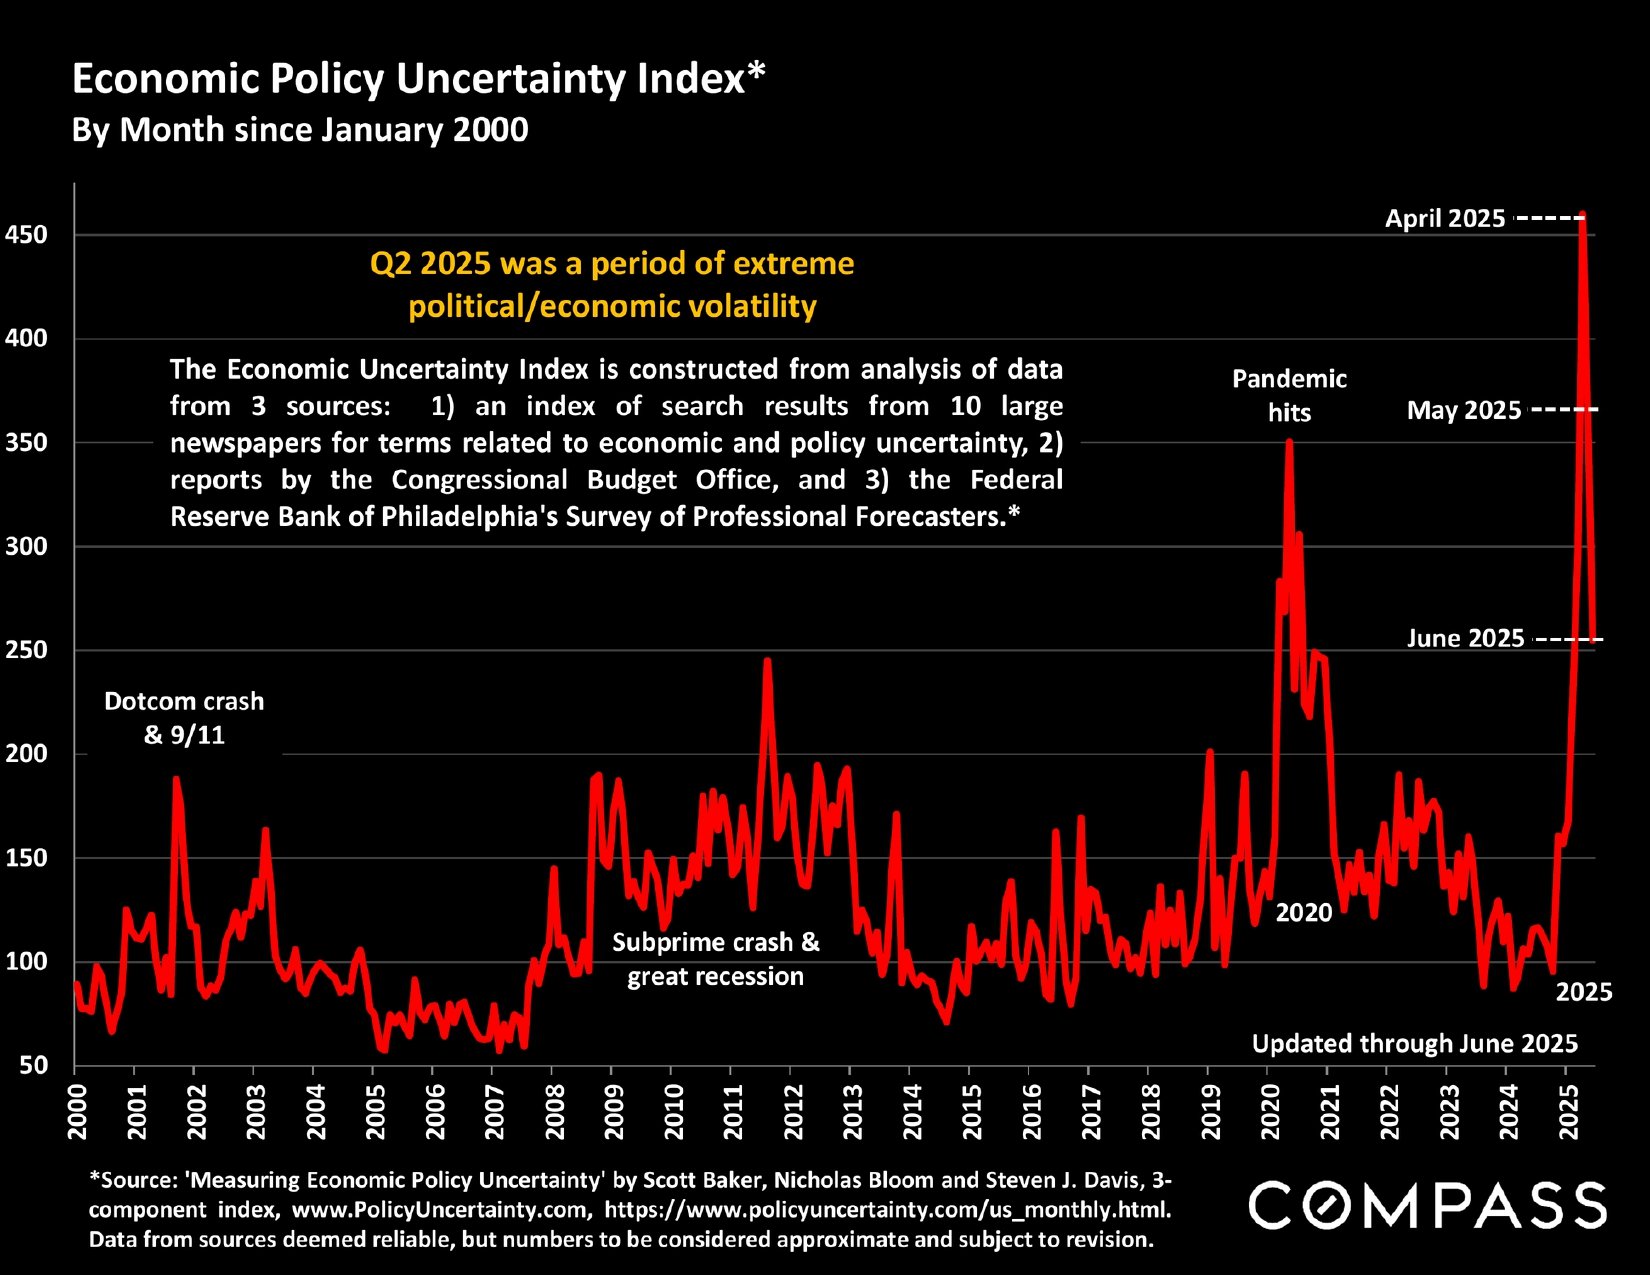
Economic policy uncertainty index chart, with a sharp spike in April 2025 and monthly data through June 2025.

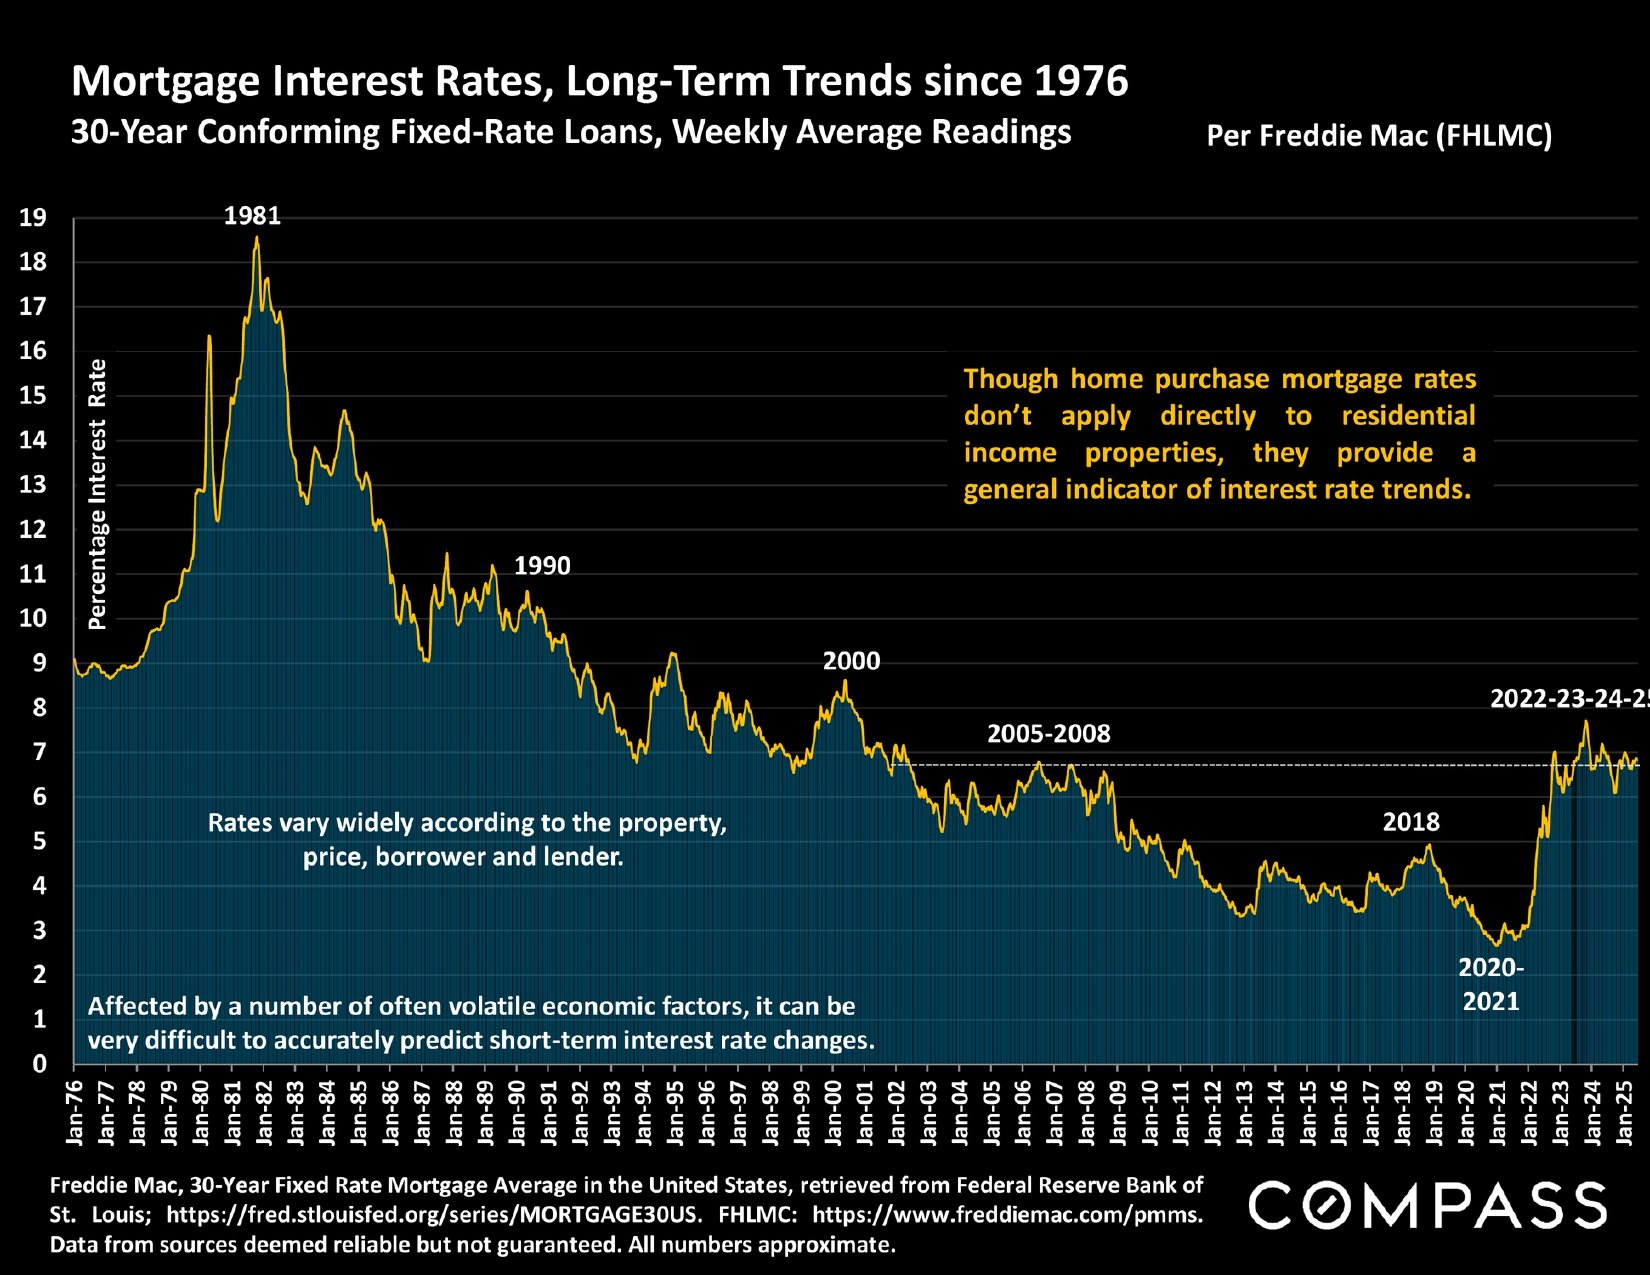
Chart of U.S. 30-year mortgage rates from 1976 to 2025, peaking in 1981 and rising sharply after 2021.

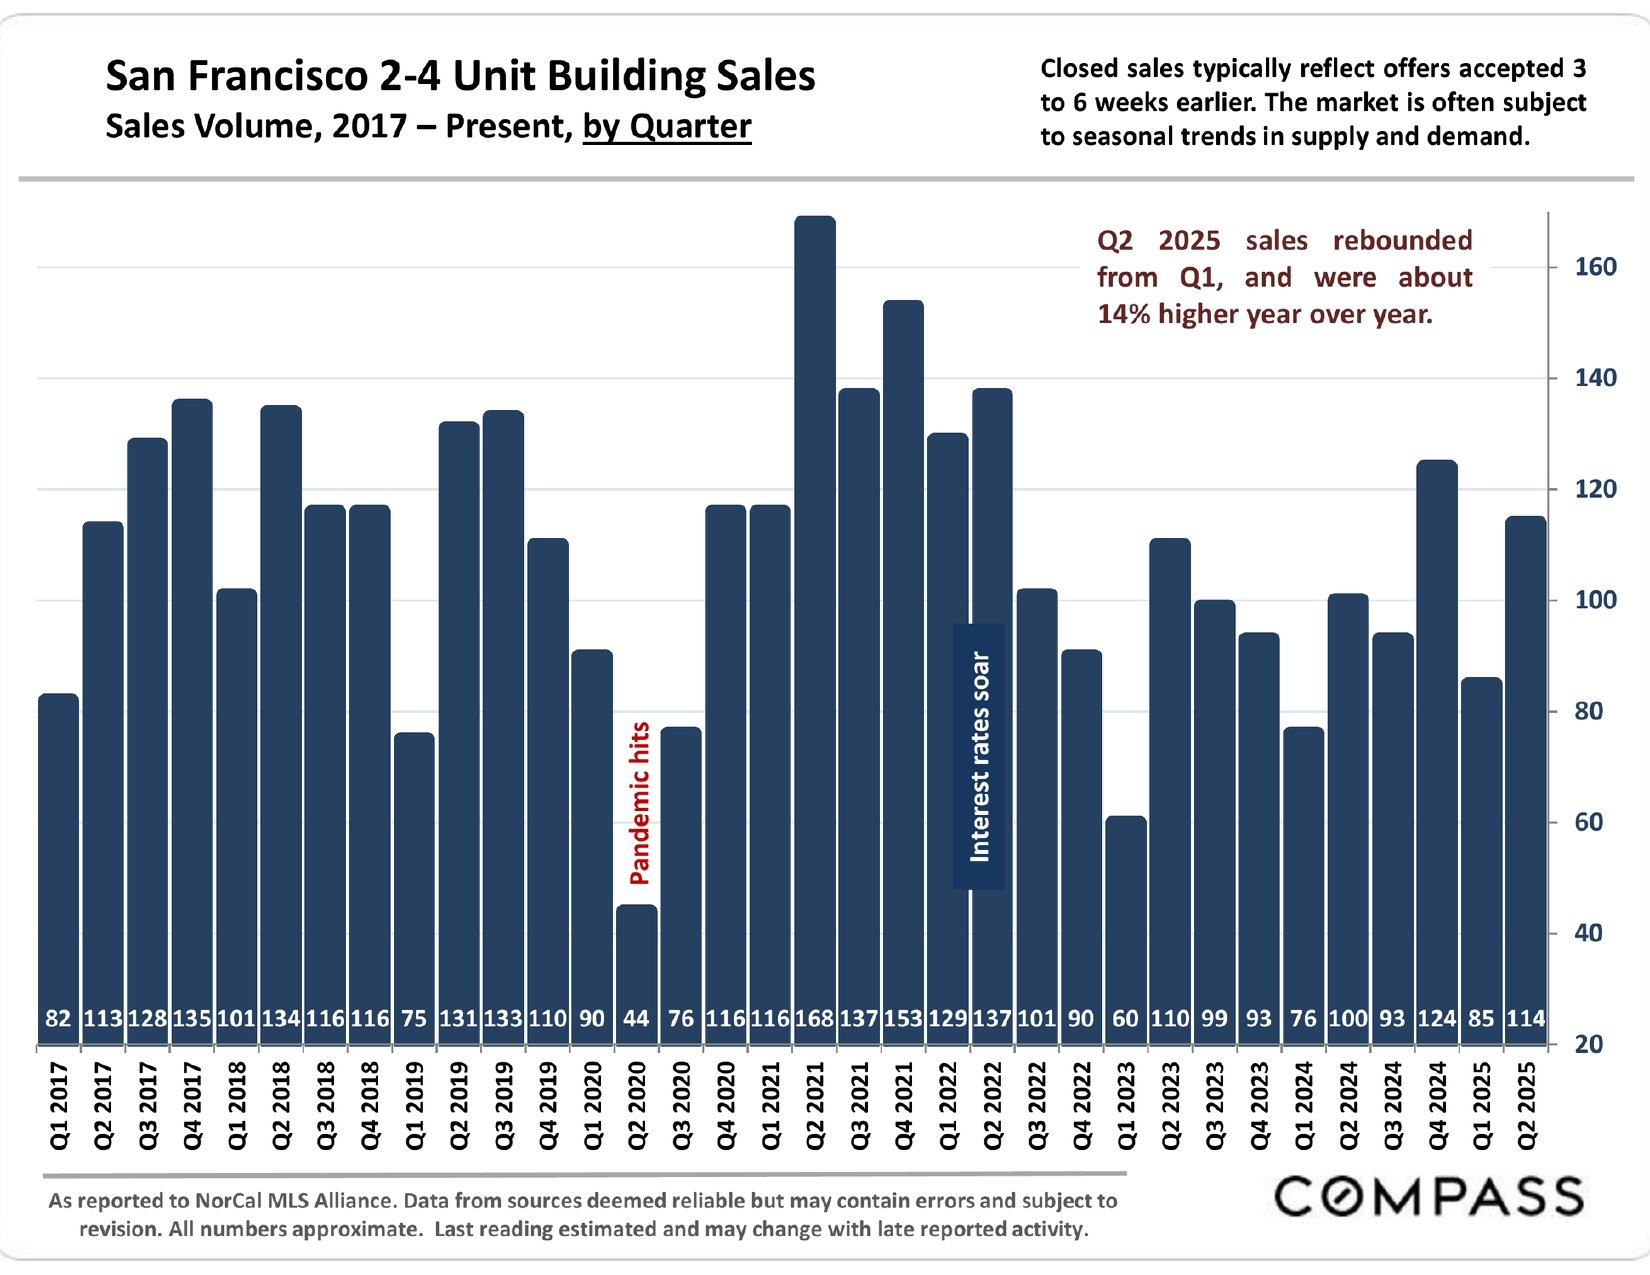
Quarterly San Francisco 2–4 unit building sales chart, 2017–Q2 2025, with pandemic and interest-rate annotations.

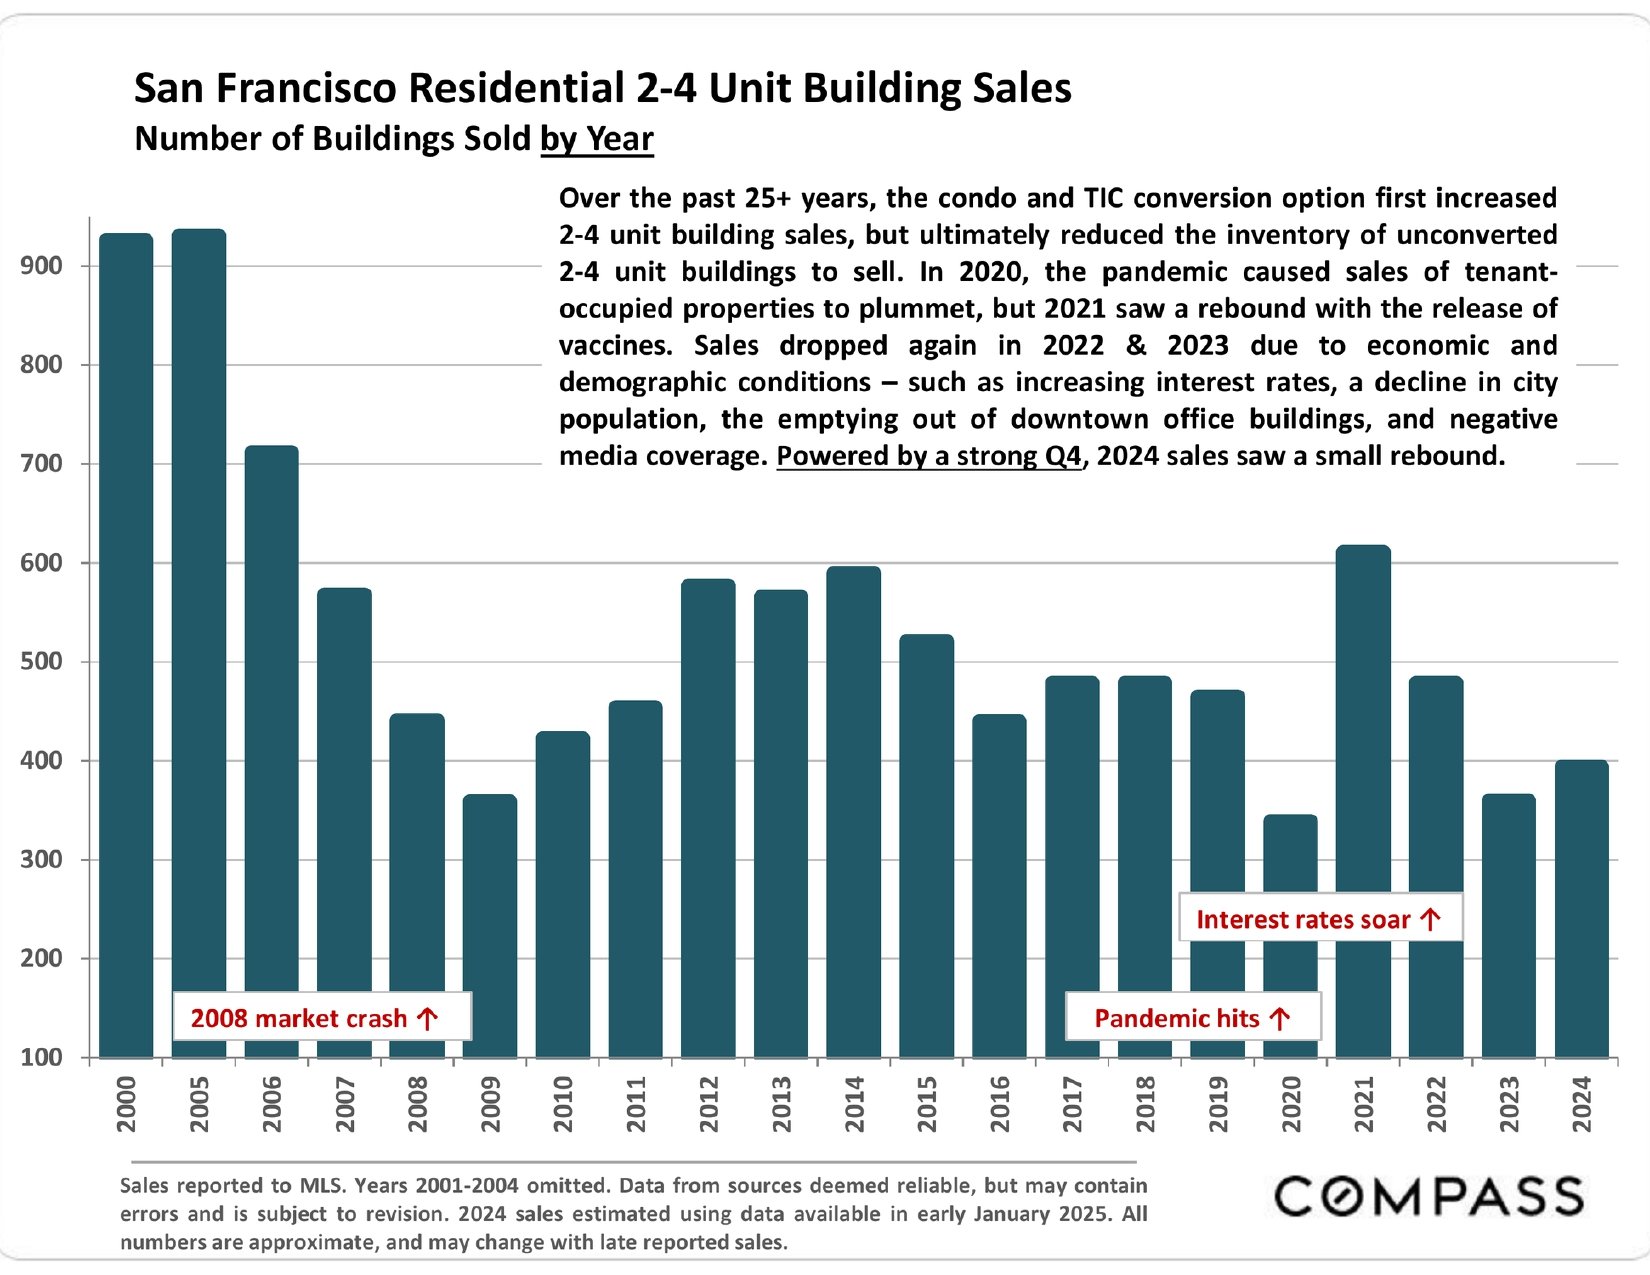
Bar chart of San Francisco 2–4 unit building sales from 2000 to 2024, with market-crash, pandemic, and interest-rate annotations.

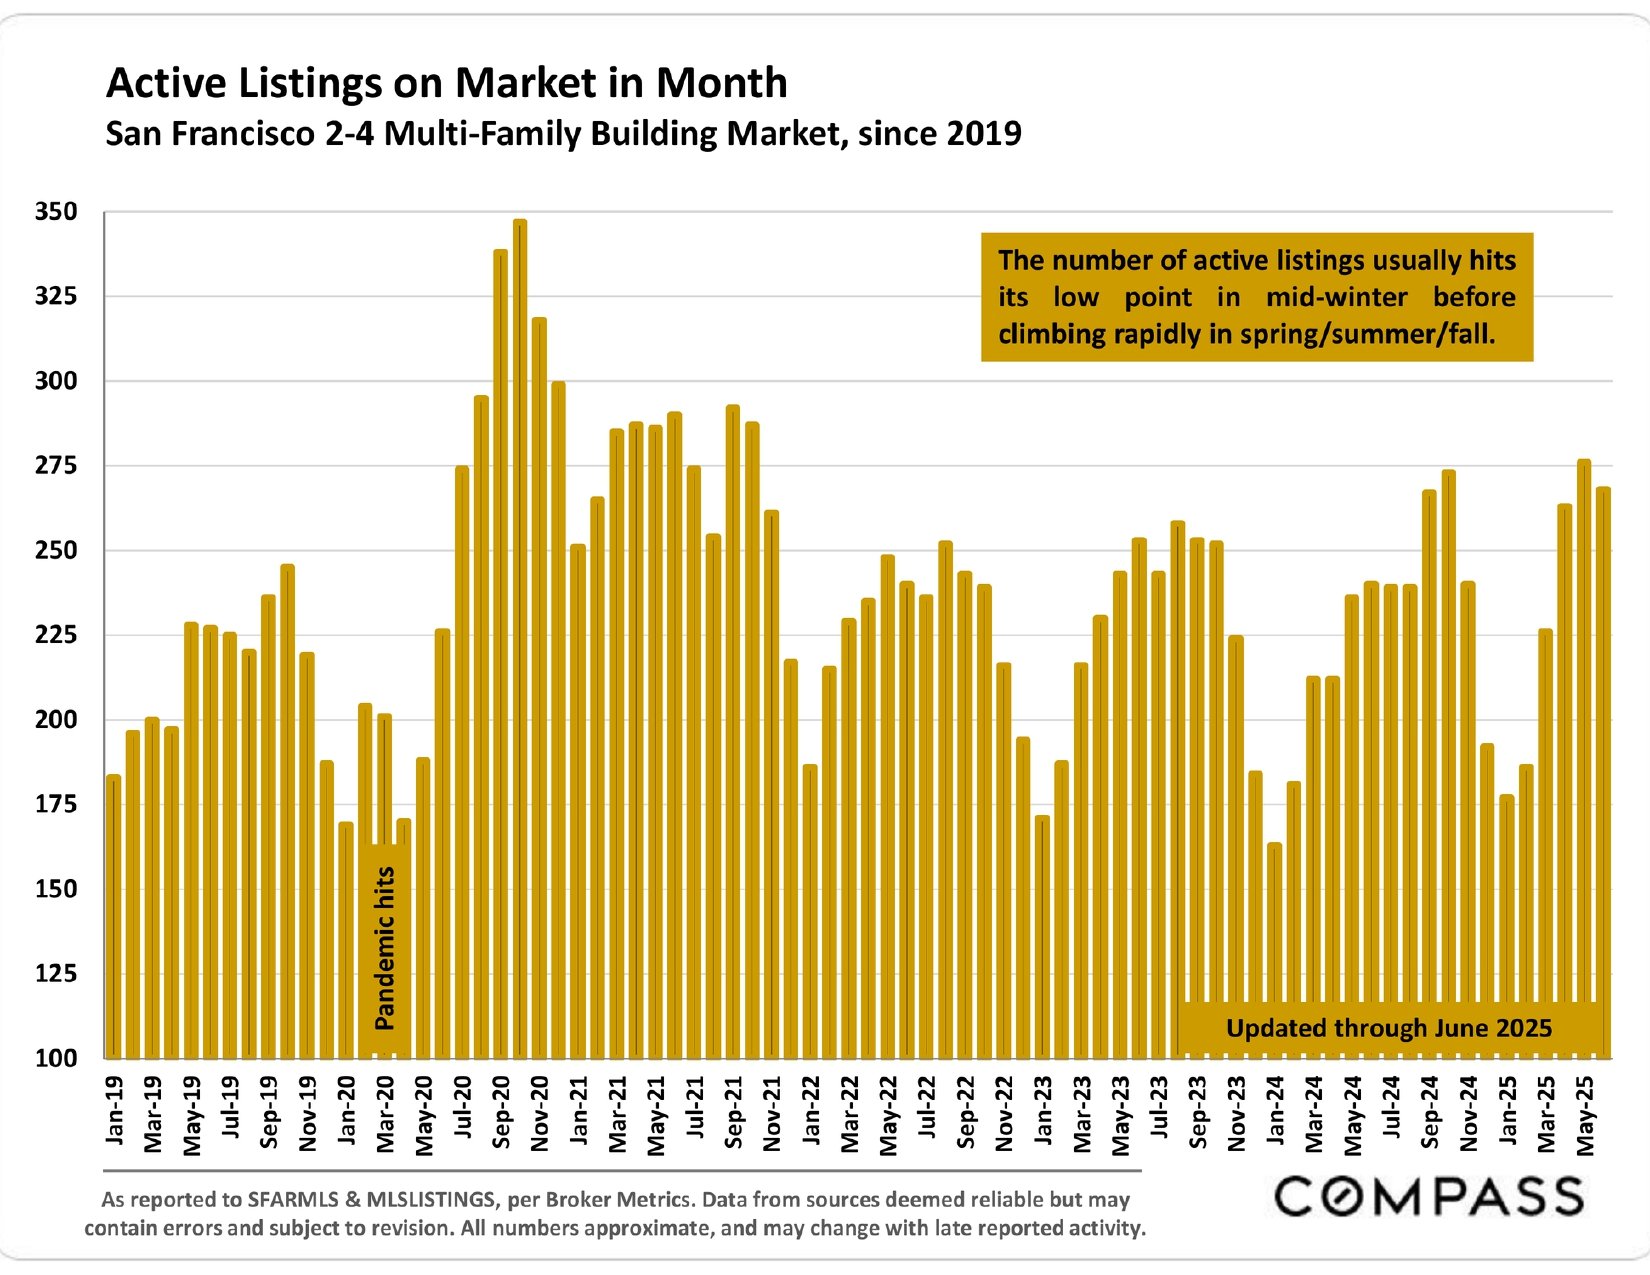
Chart of San Francisco 2–4 multi-family building listings since 2019, peaking near 350 in fall 2020 and updated through June 2025.

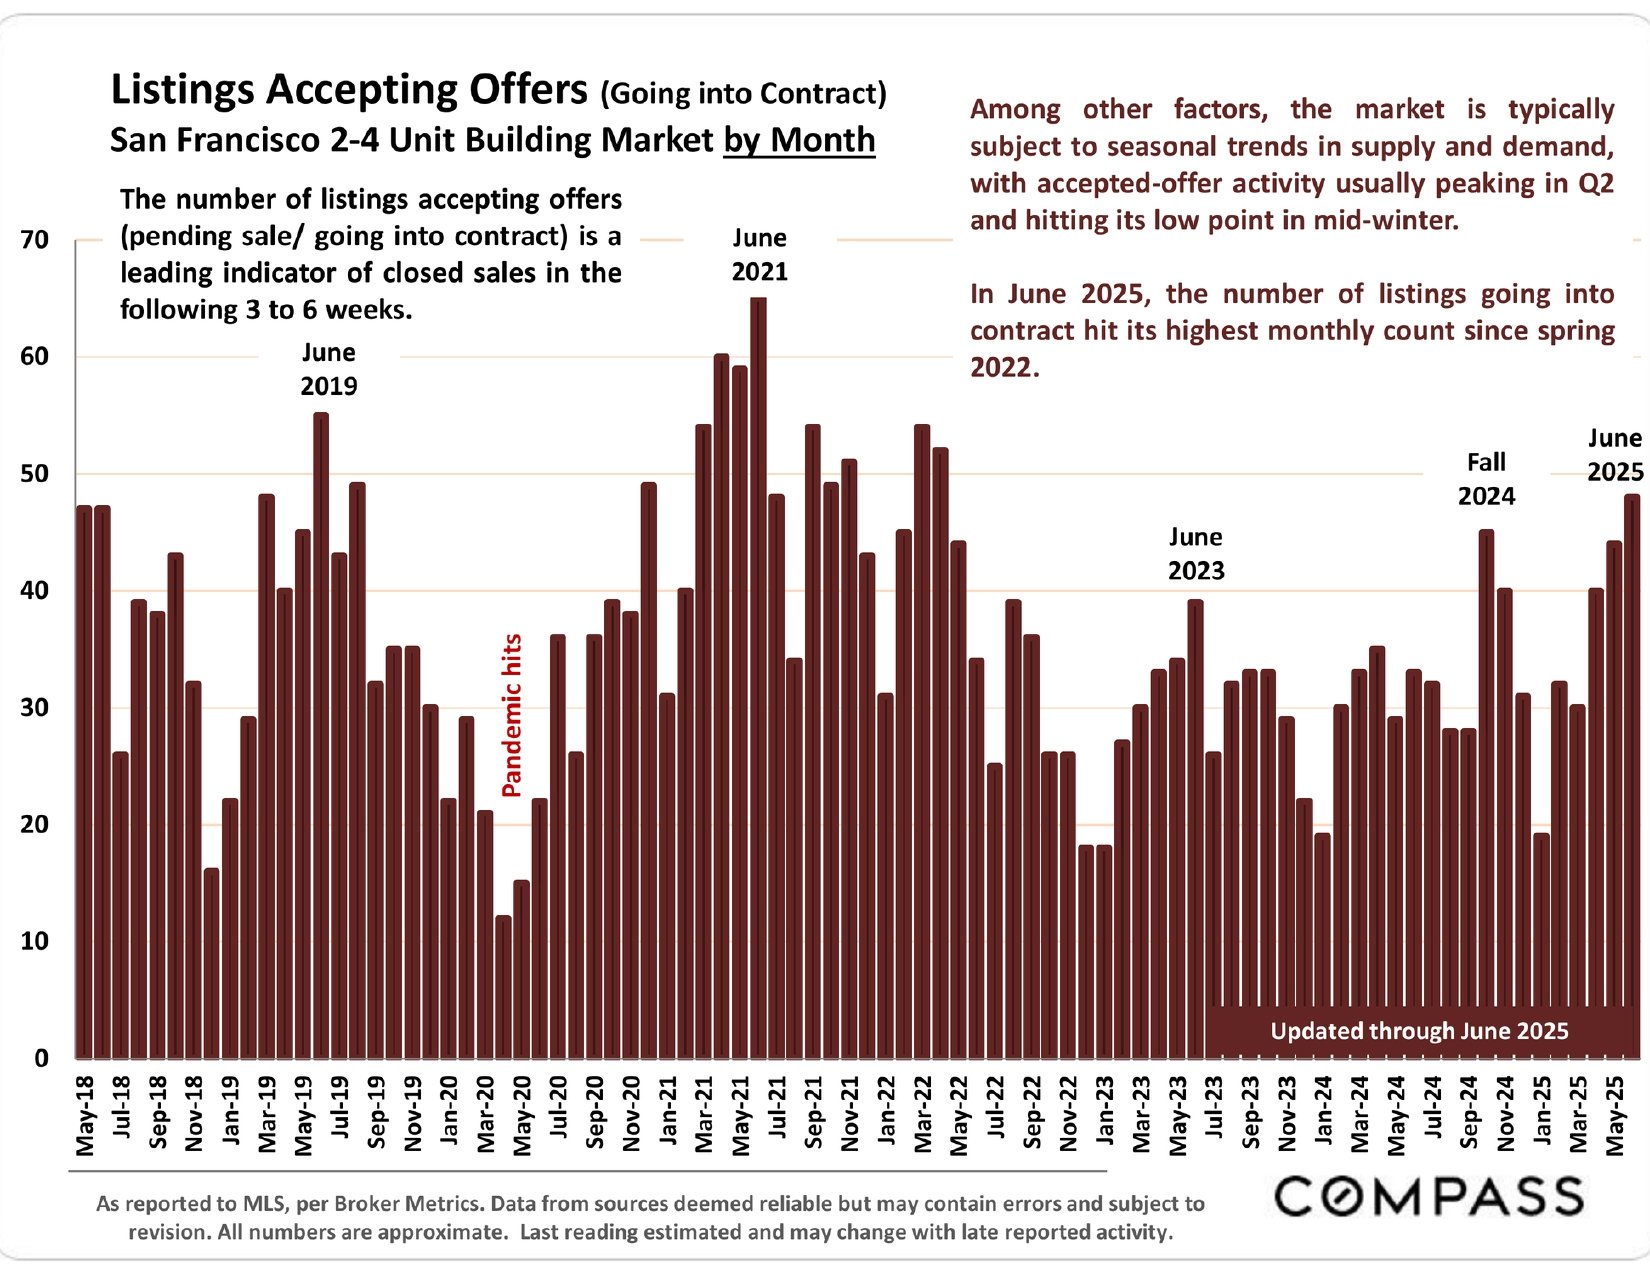
Bar chart of San Francisco 2–4 unit building listings accepting offers, showing a June 2025 high since spring 2022.

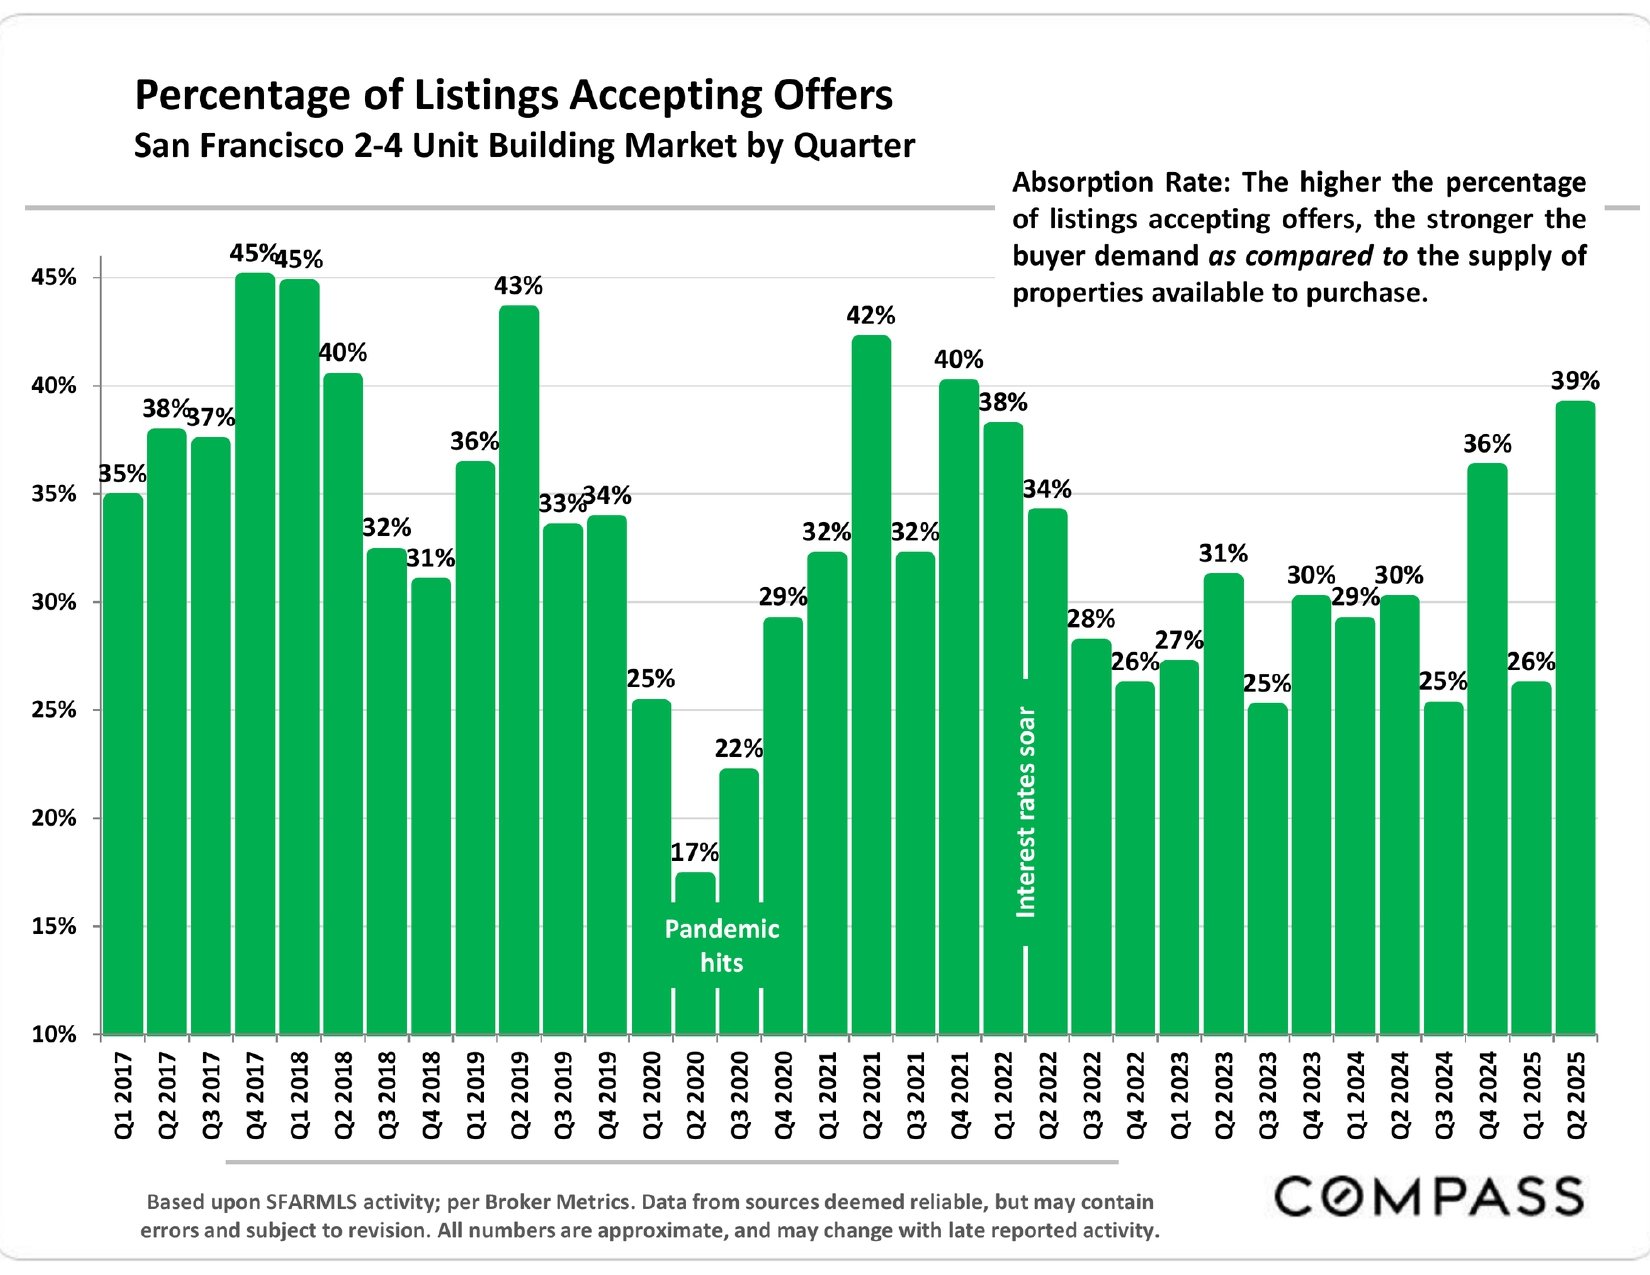
Chart of San Francisco 2–4 unit building offers accepted by quarter; the rate was 39% in Q2 2025.

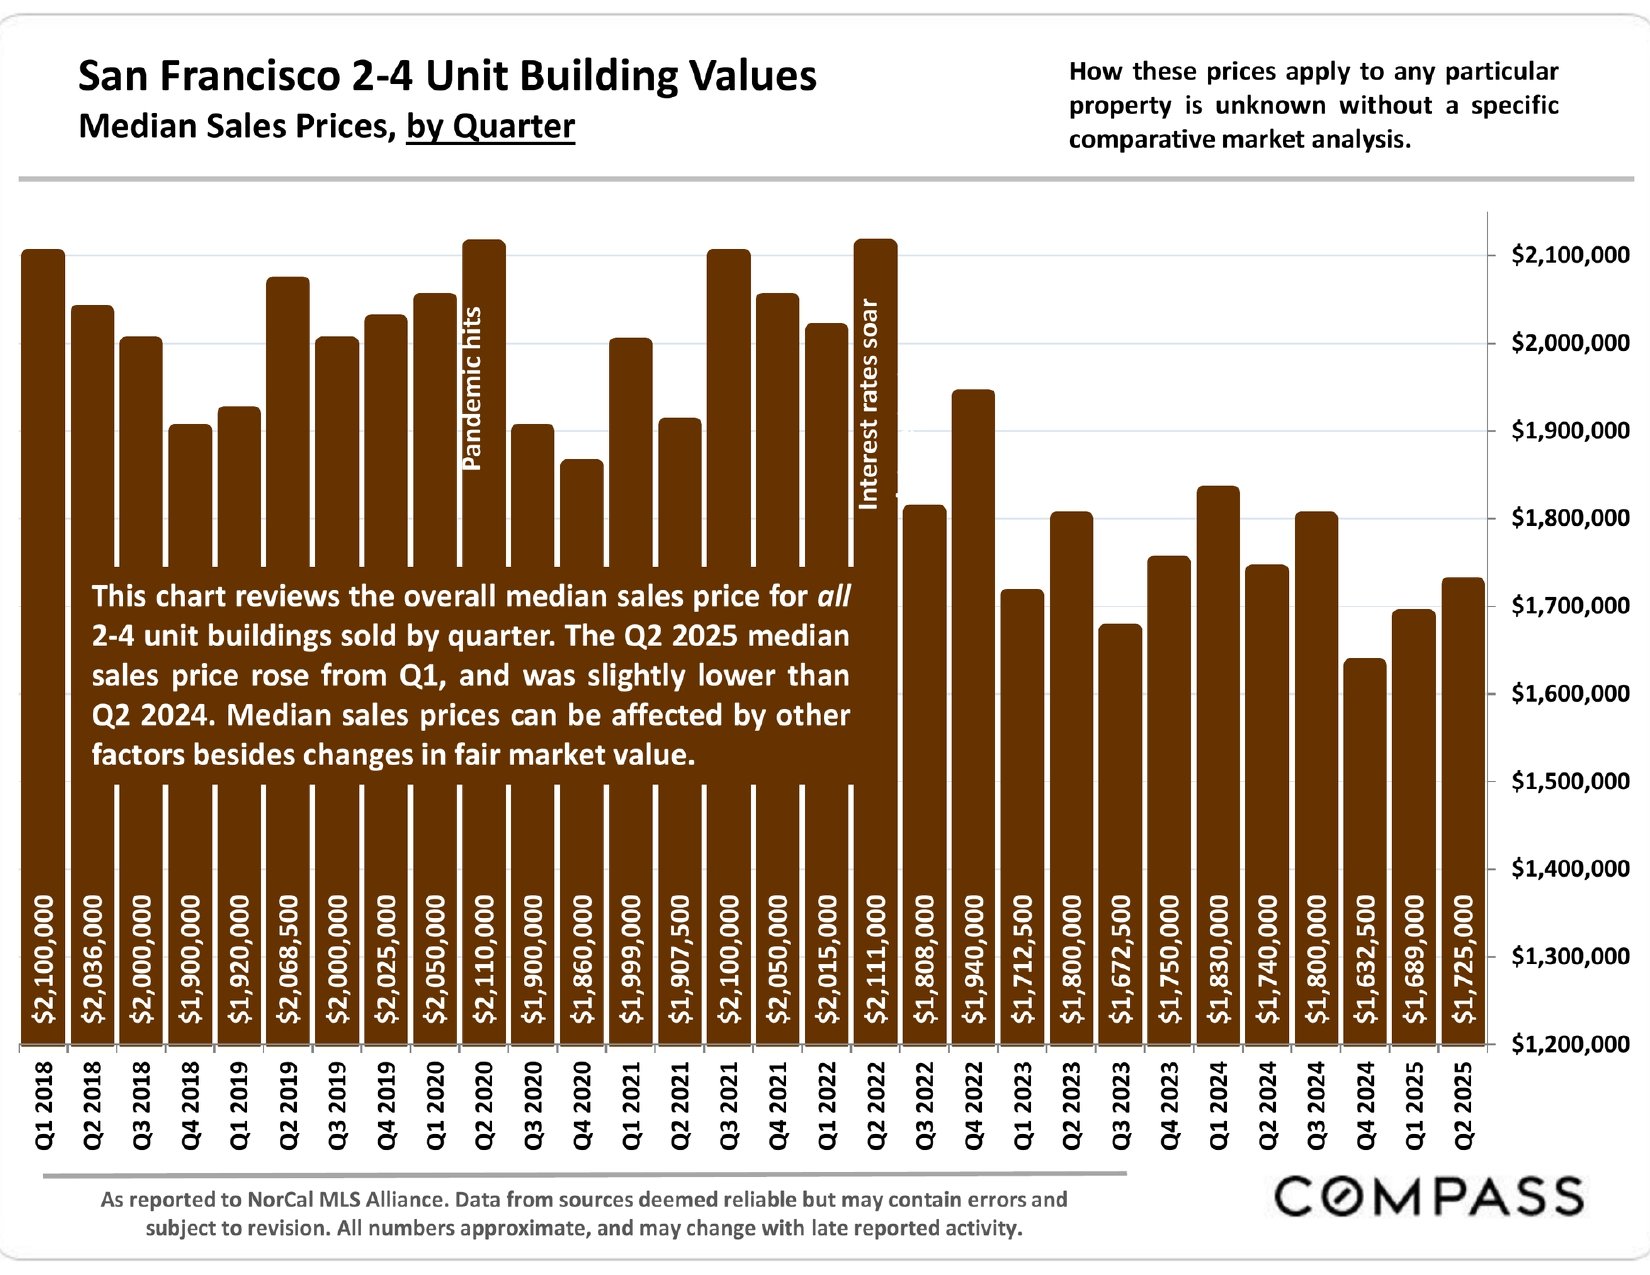
Bar chart of San Francisco 2–4 unit building median sale prices by quarter; Q2 2025 is $1,725,000.

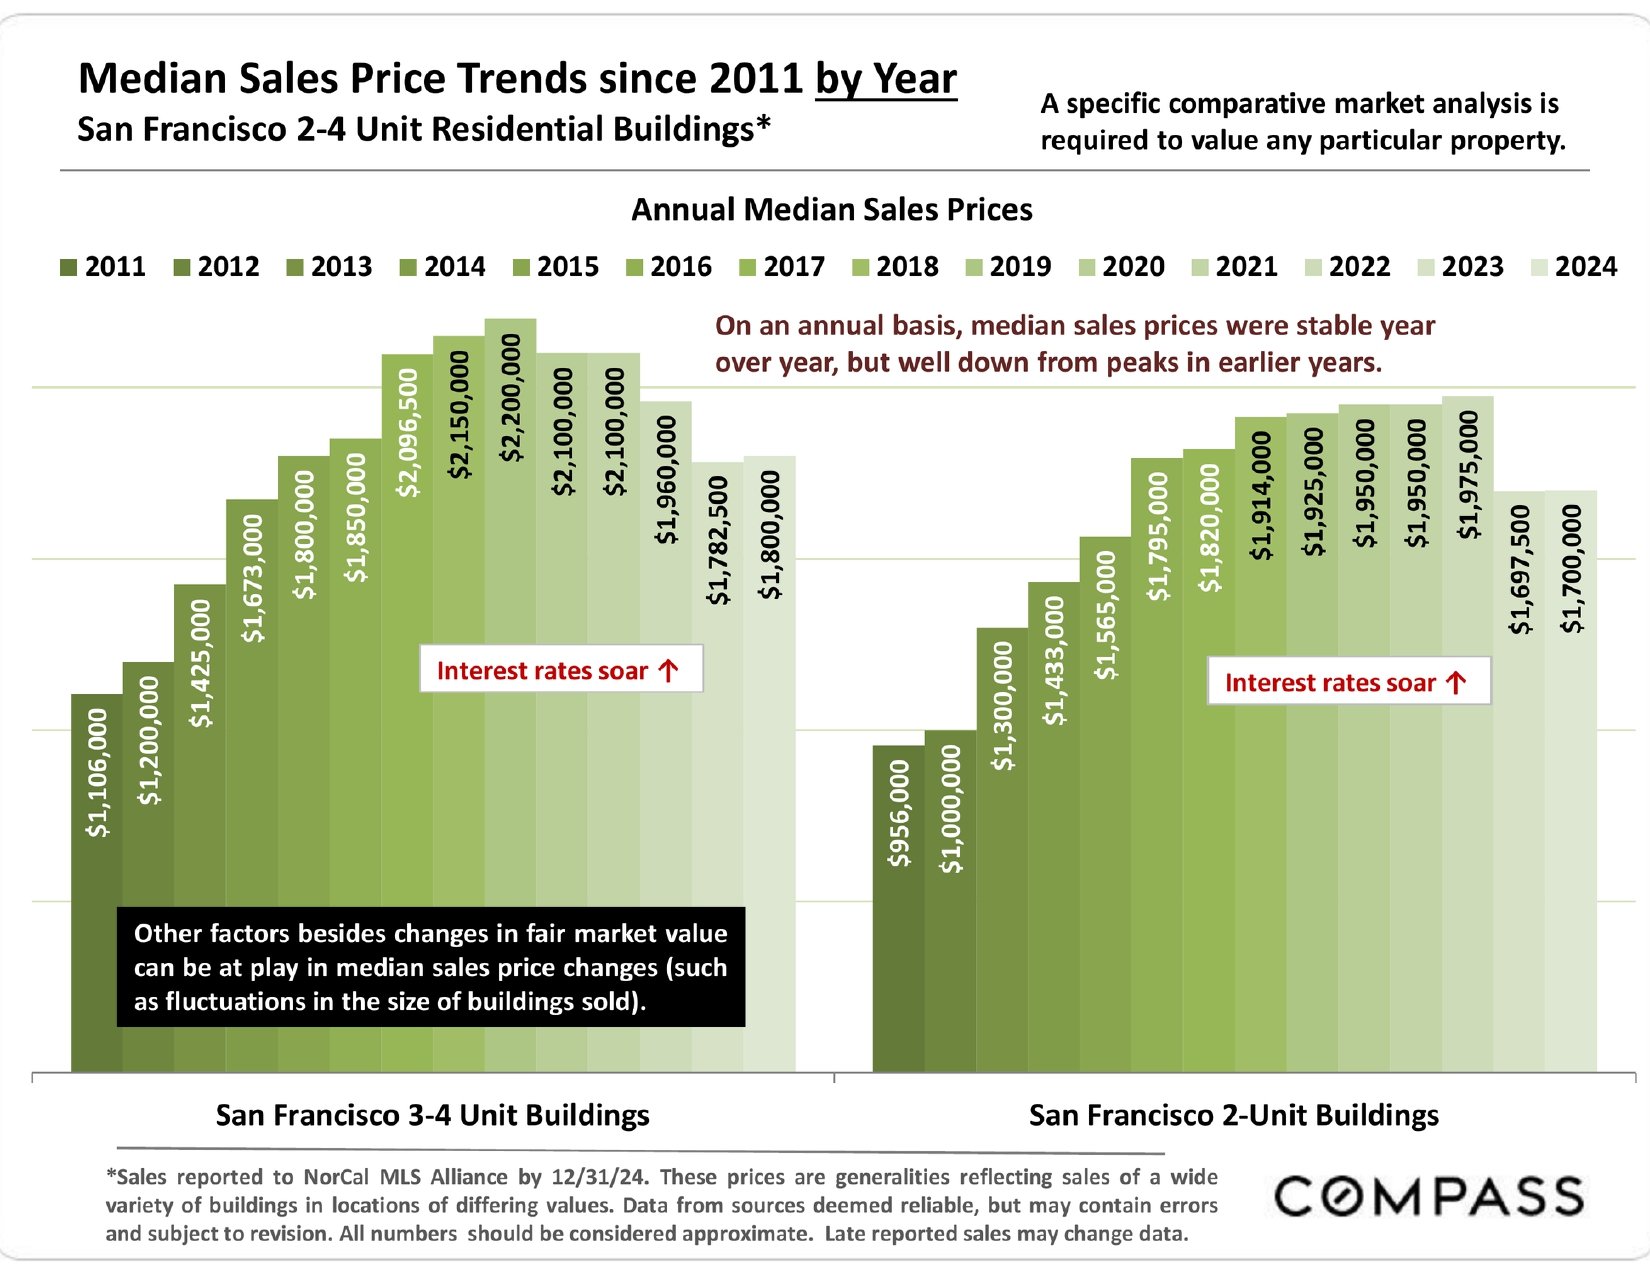
Bar chart of San Francisco 2–4 unit building median sale prices from 2011 to 2024, with separate groups by unit count.

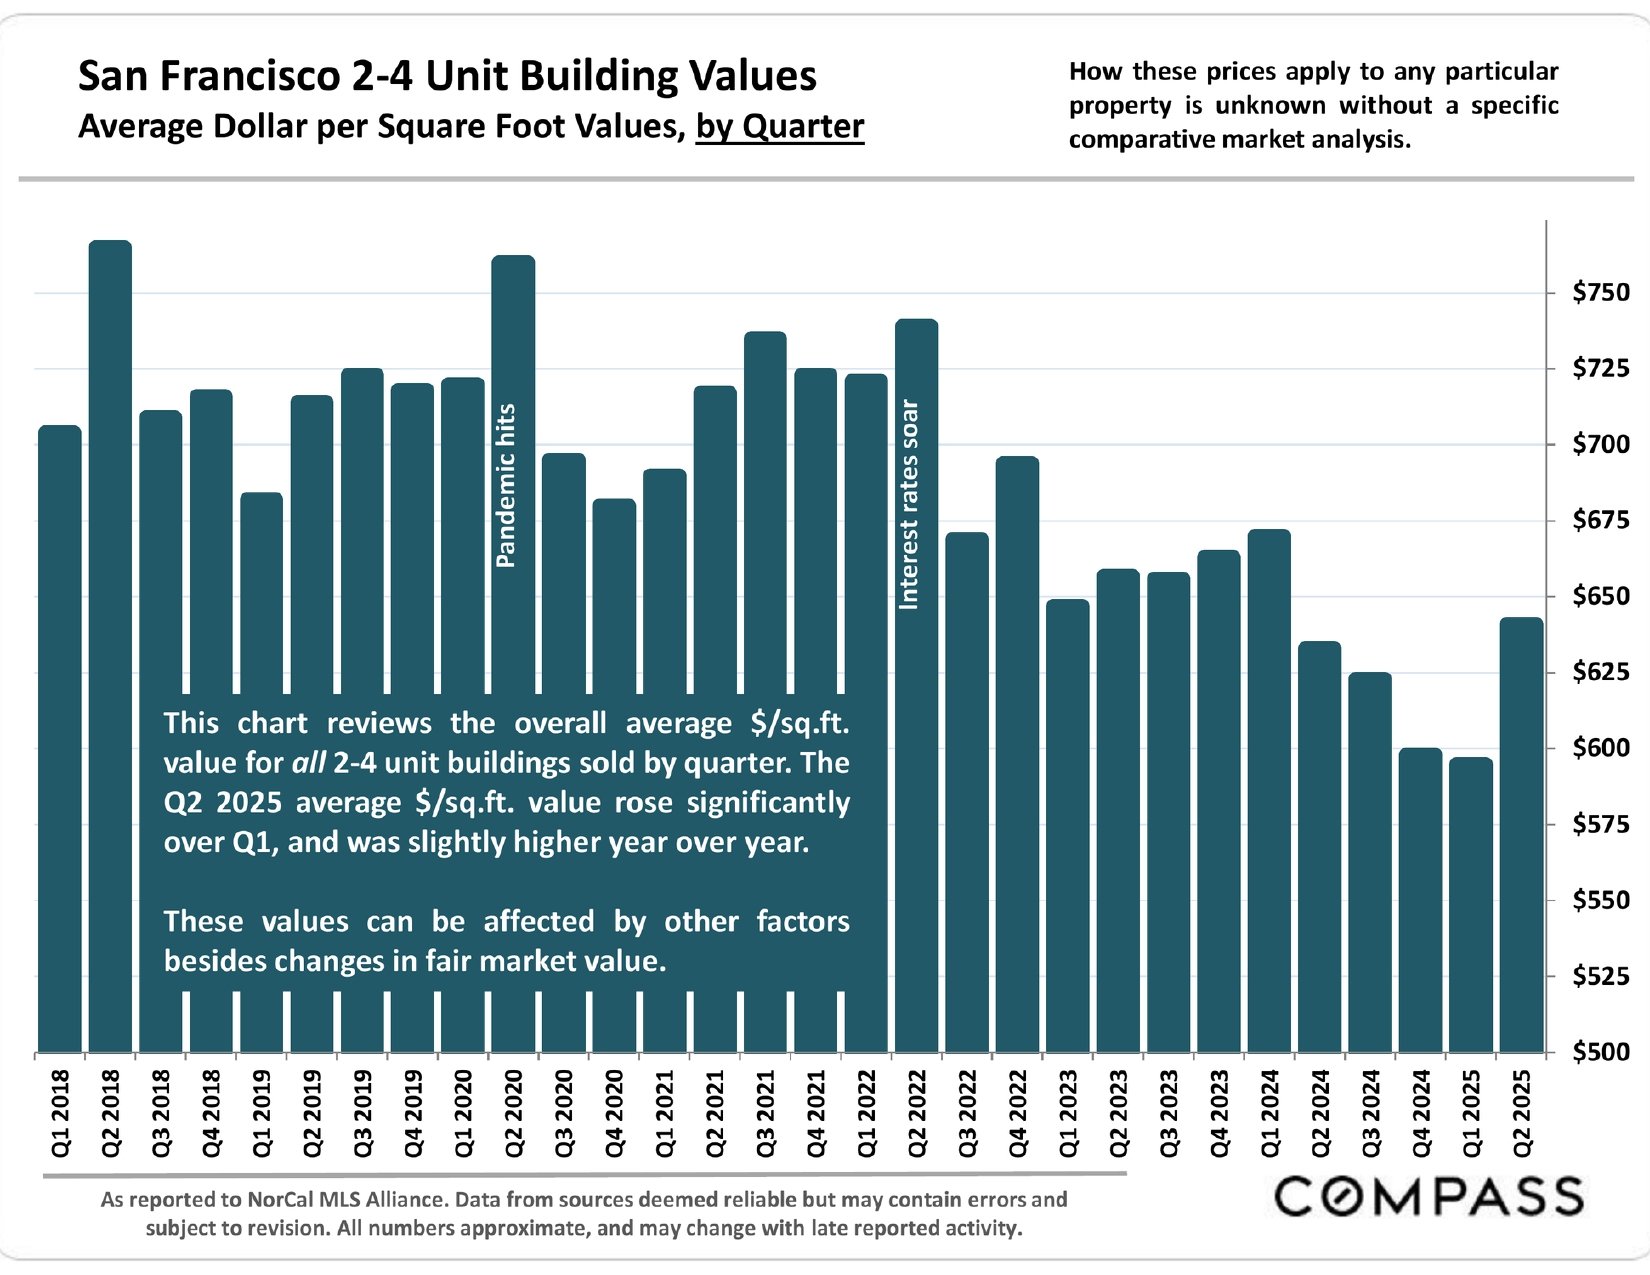
Chart of San Francisco 2–4 unit building values per square foot by quarter, Q1 2018–Q2 2025.

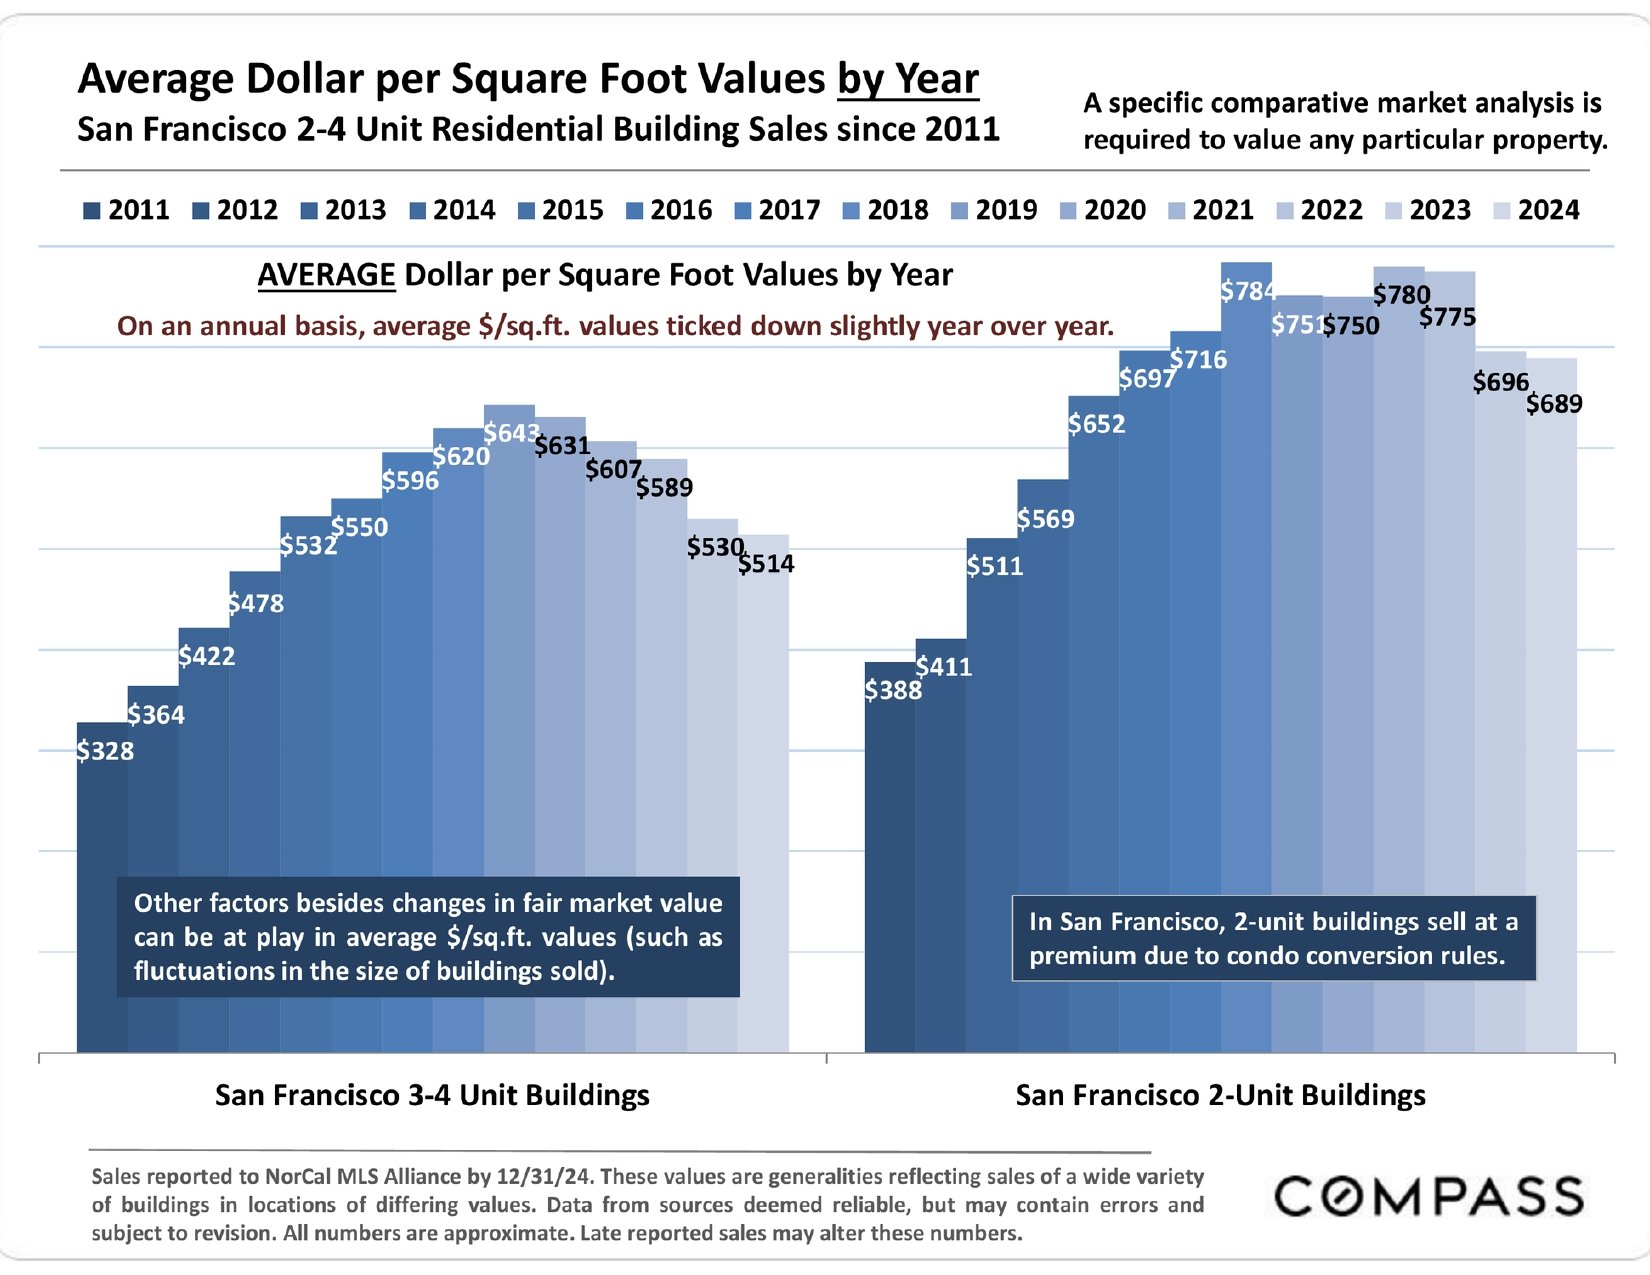
Chart of San Francisco building values per square foot from 2011 to 2024, split into 2-unit and 3–4-unit buildings.

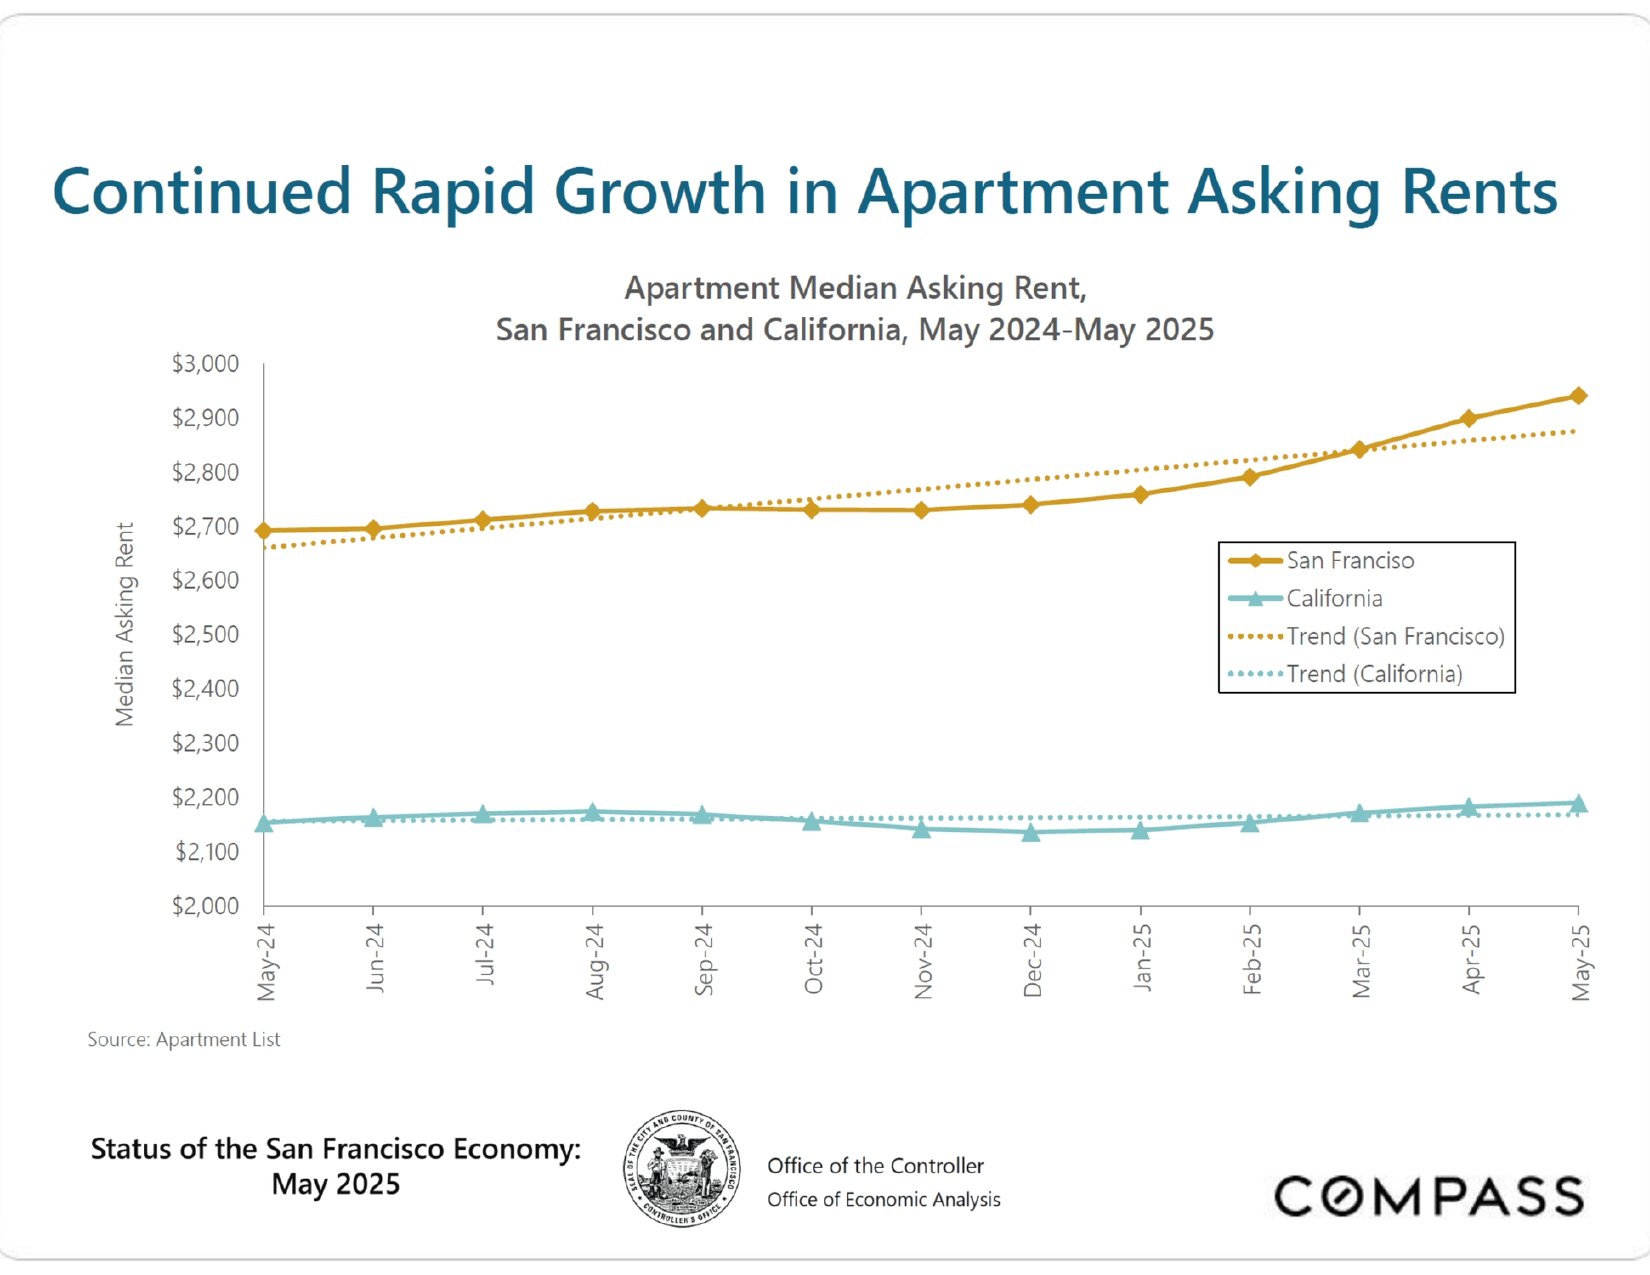
Line chart compares San Francisco and California apartment asking rents from May 2024 to May 2025; San Francisco rises markedly.

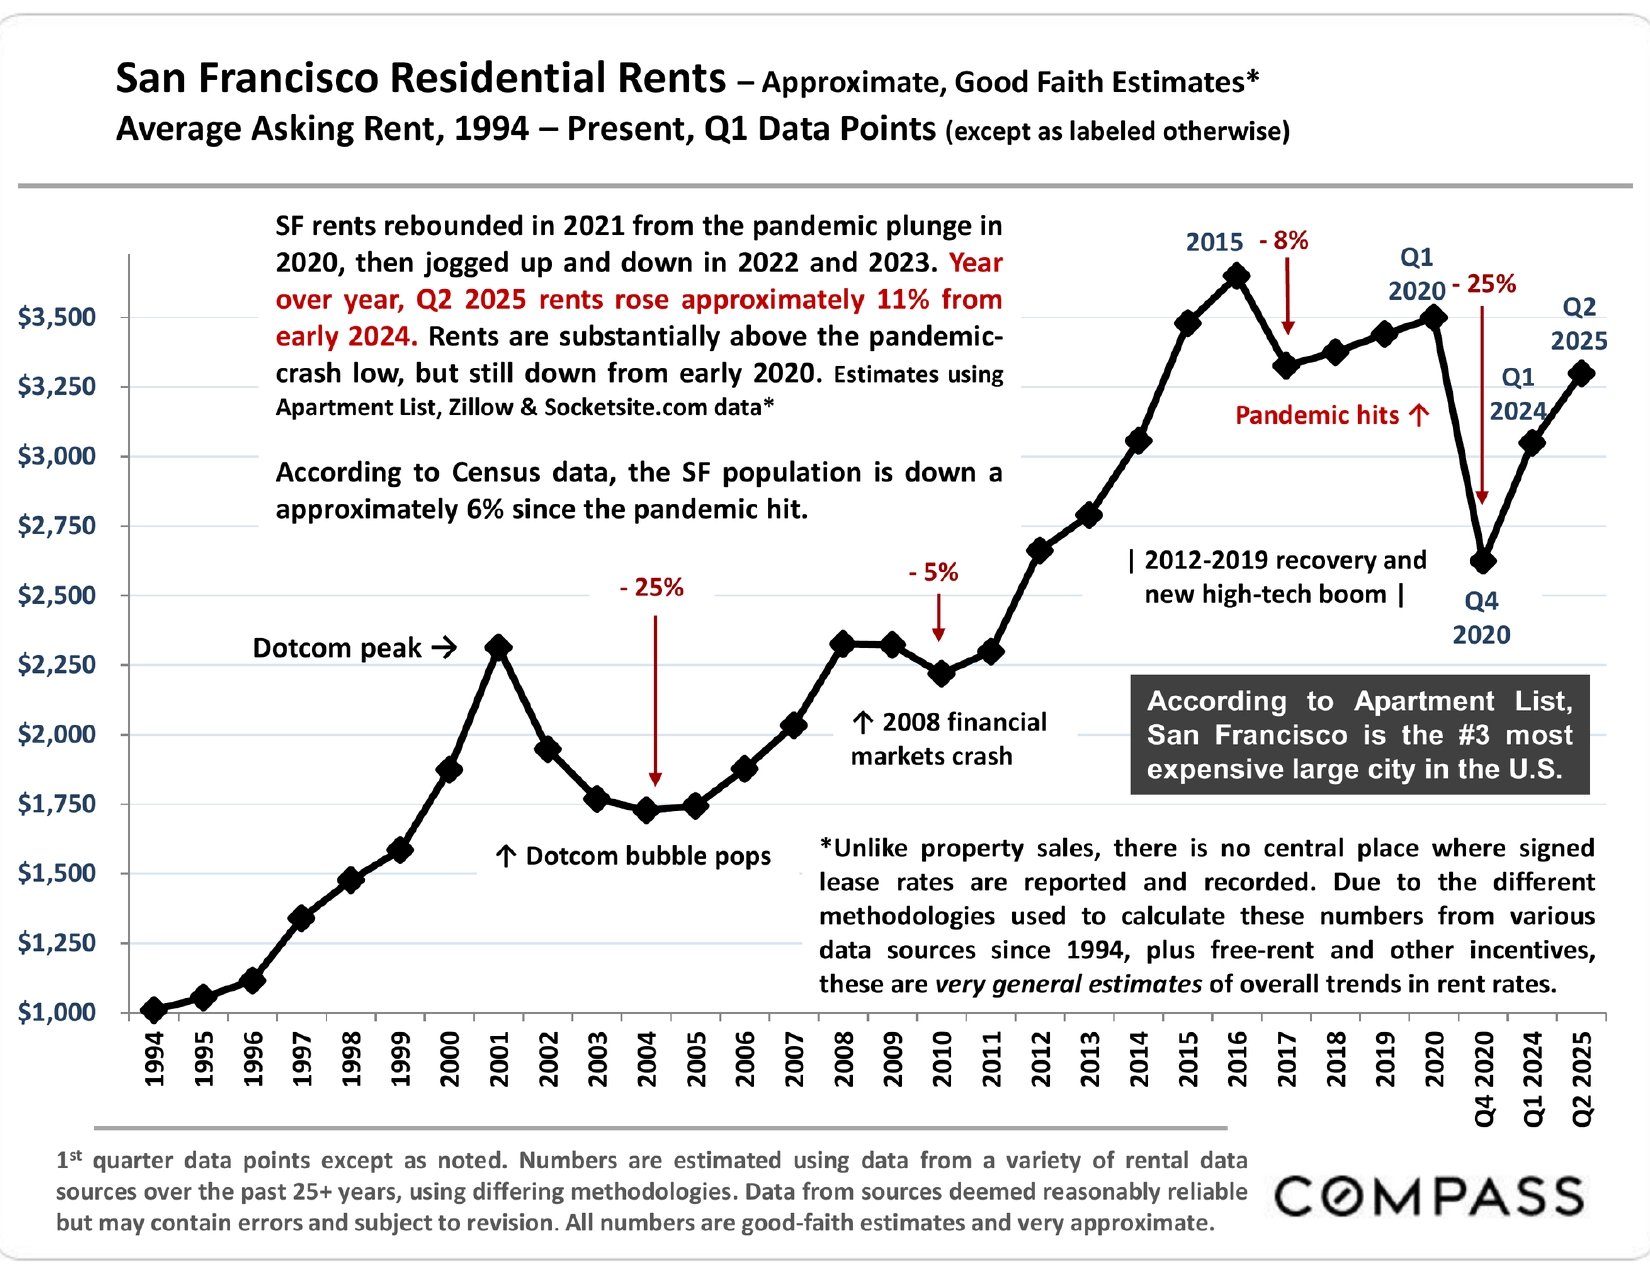
Chart of estimated San Francisco rents from 1994 to Q2 2025, with historical peaks, downturns, and a recent rebound.

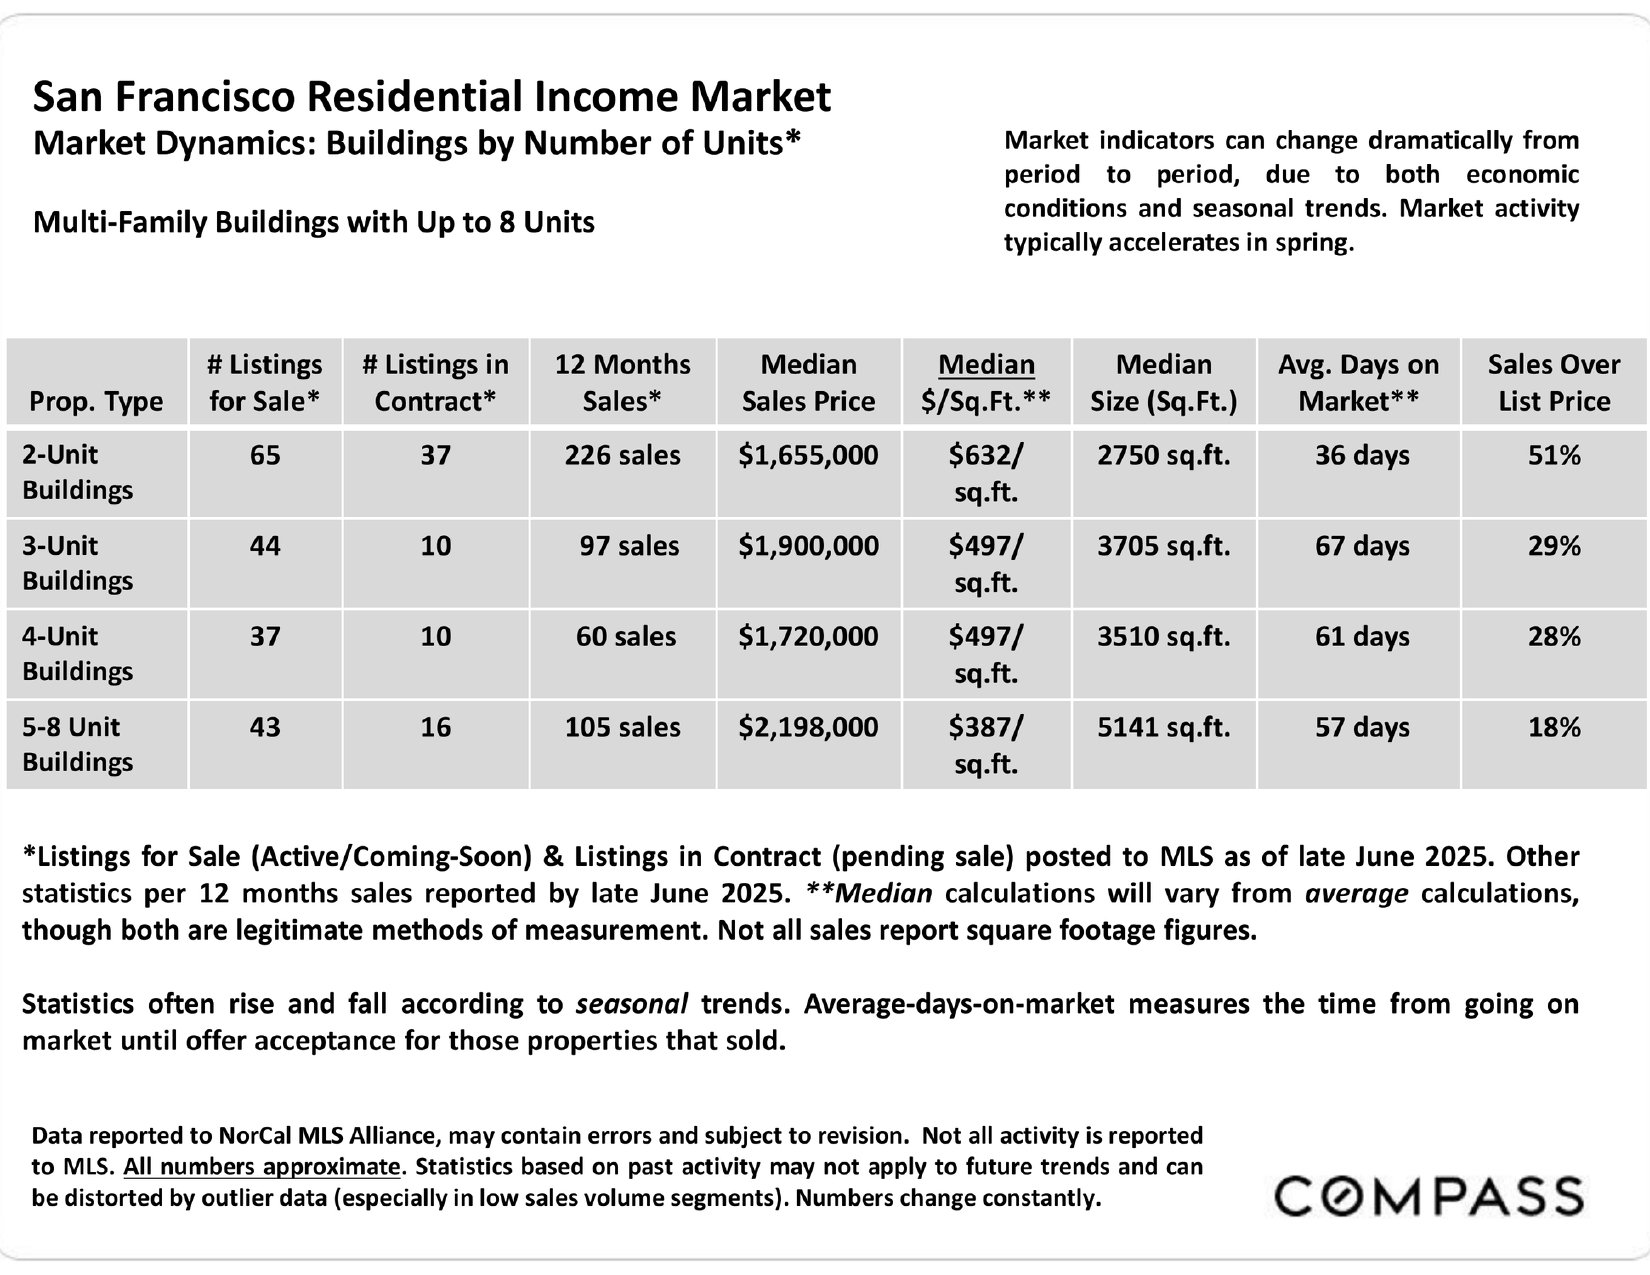
San Francisco multifamily market table comparing listings and sales metrics for buildings with 2 to 8 units.

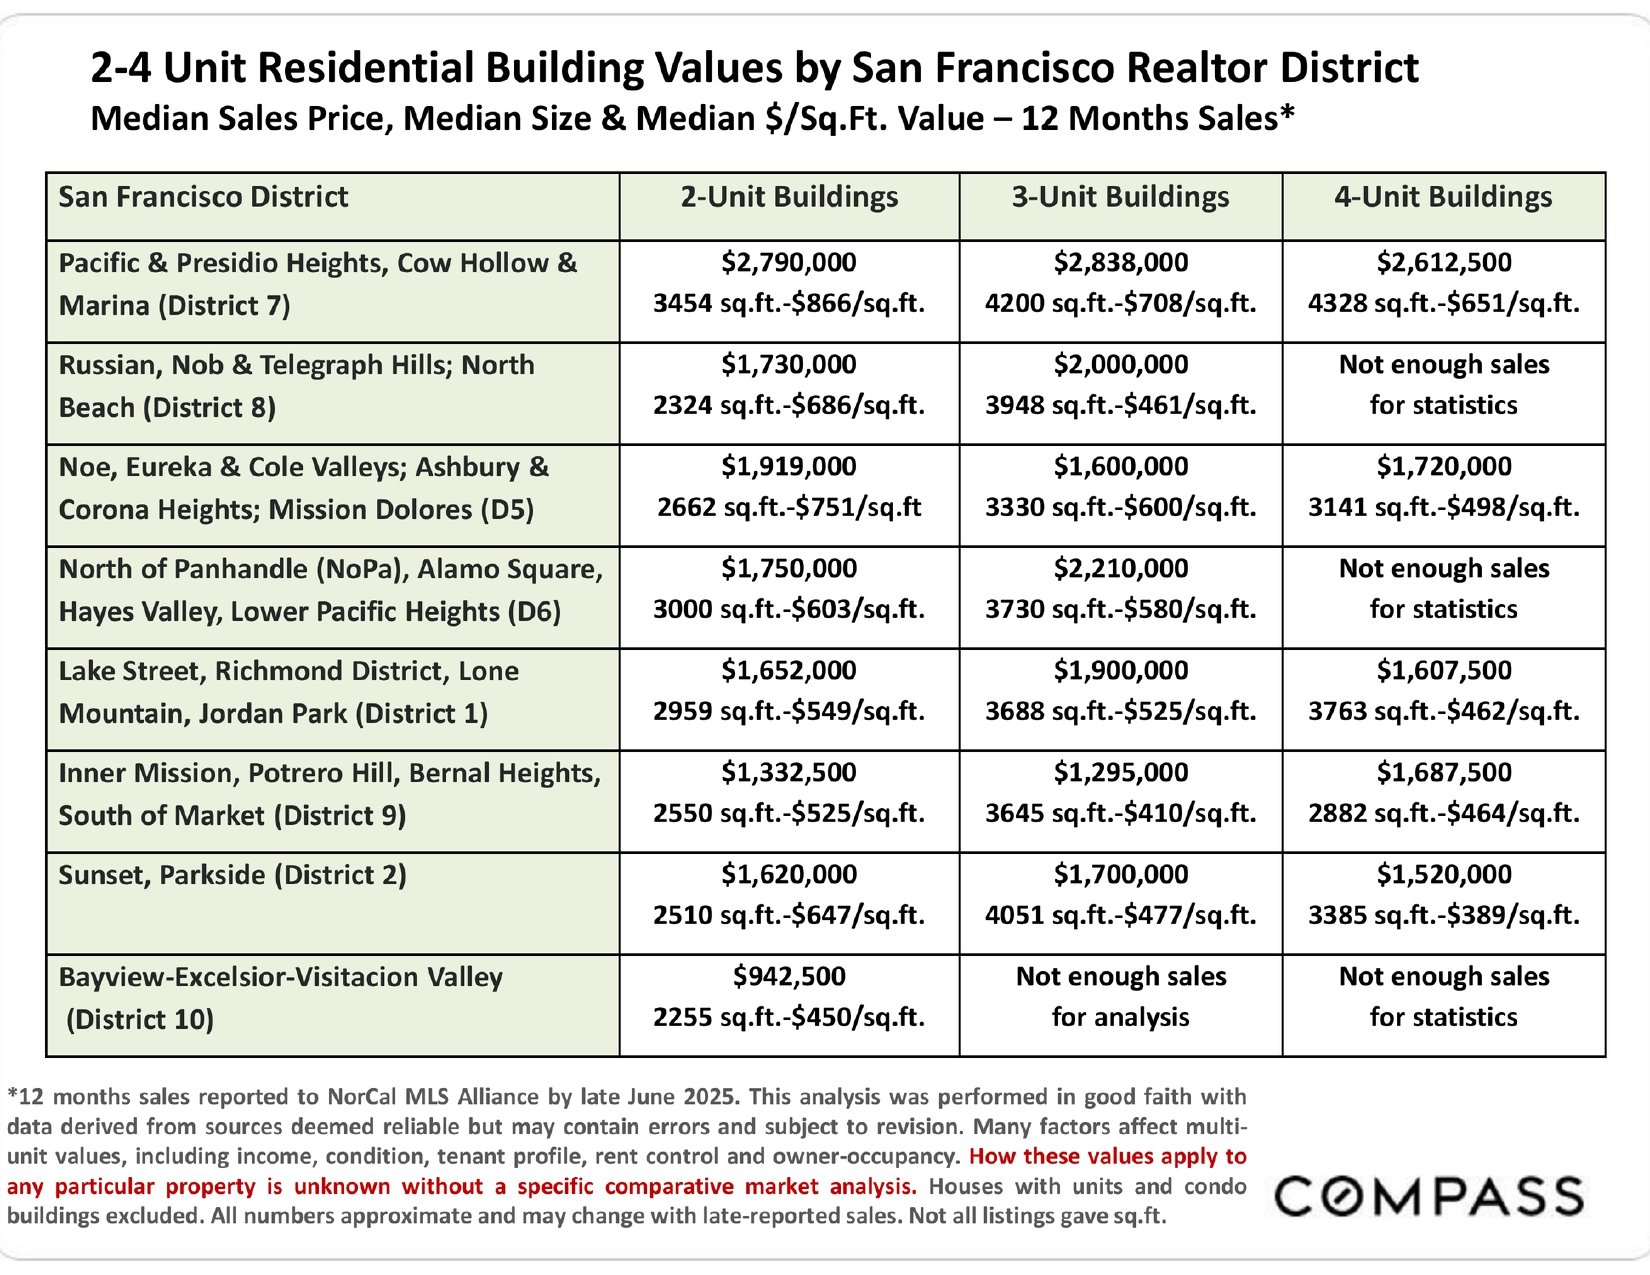
Table comparing median prices, building sizes, and prices per square foot for San Francisco 2–4 unit buildings by district.

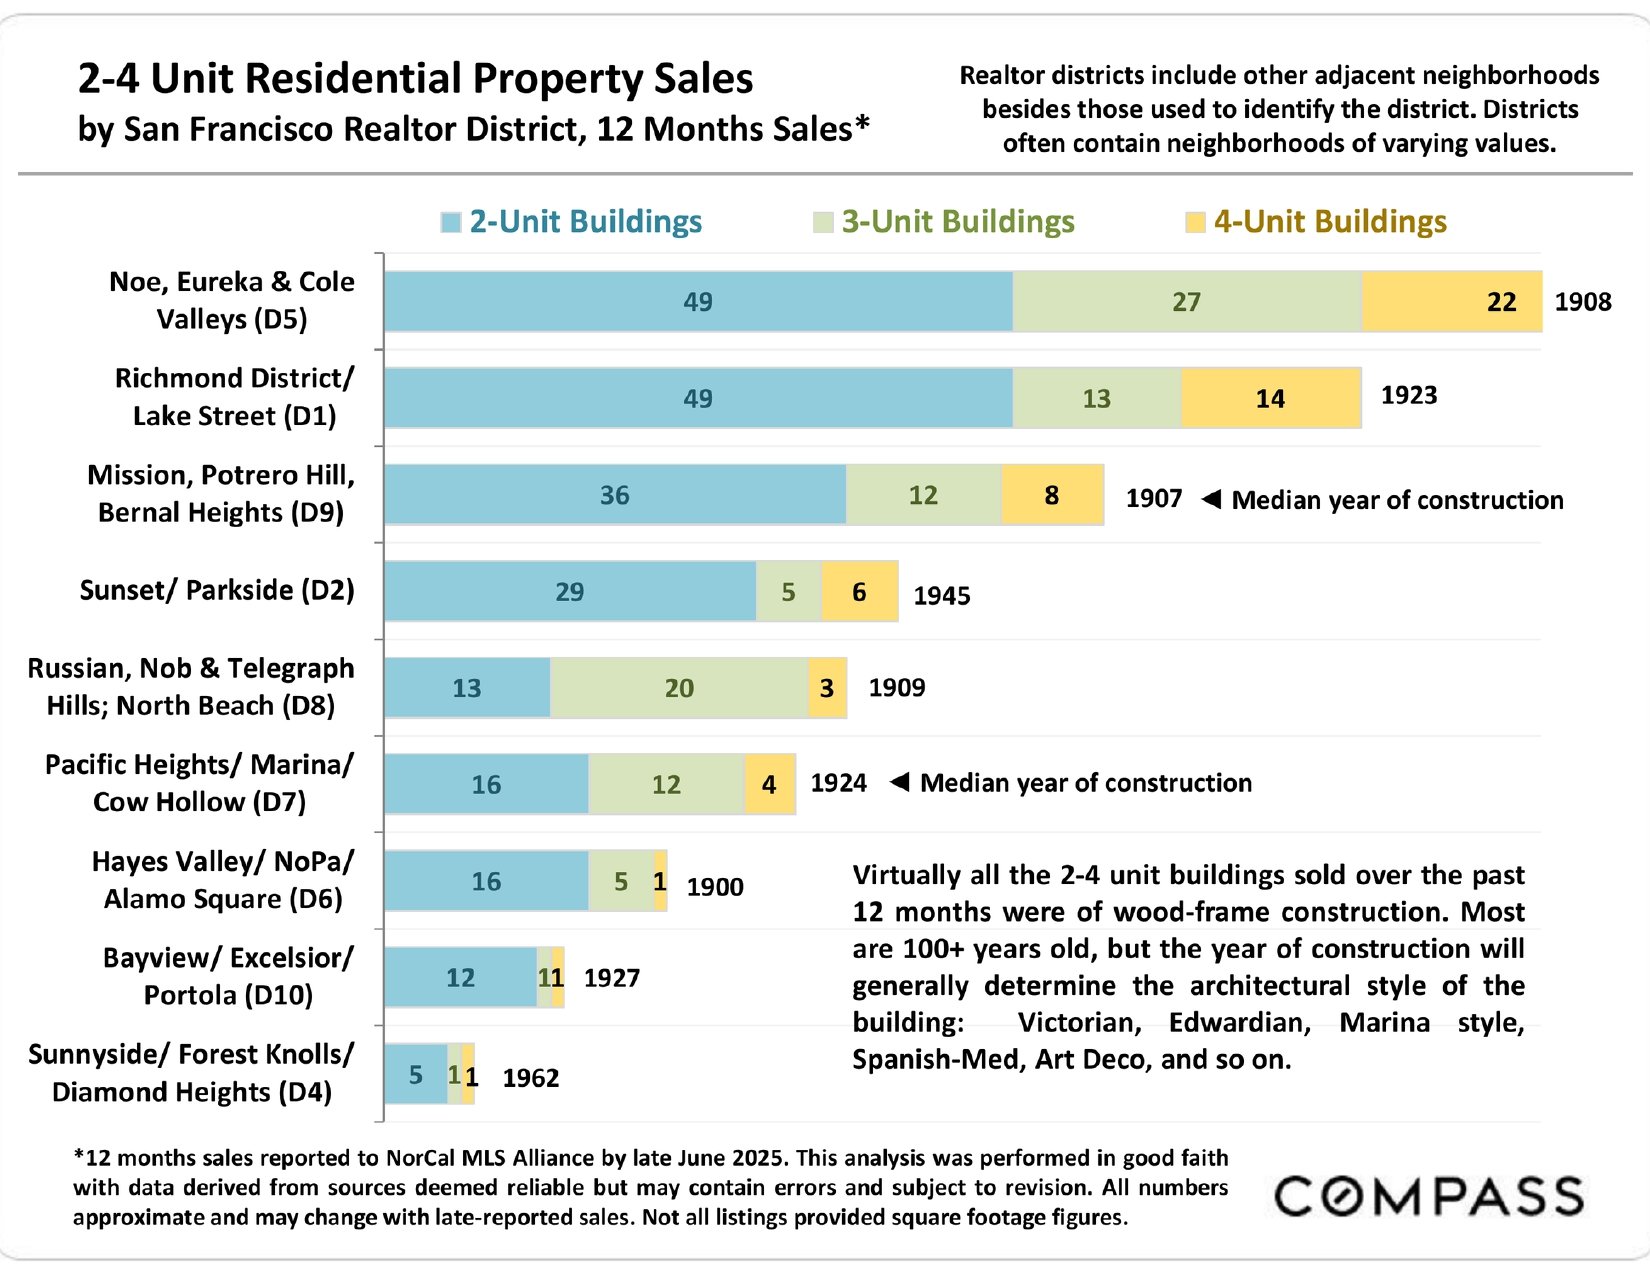
Infographic comparing 2-, 3-, and 4-unit building sales across nine San Francisco Realtor districts.

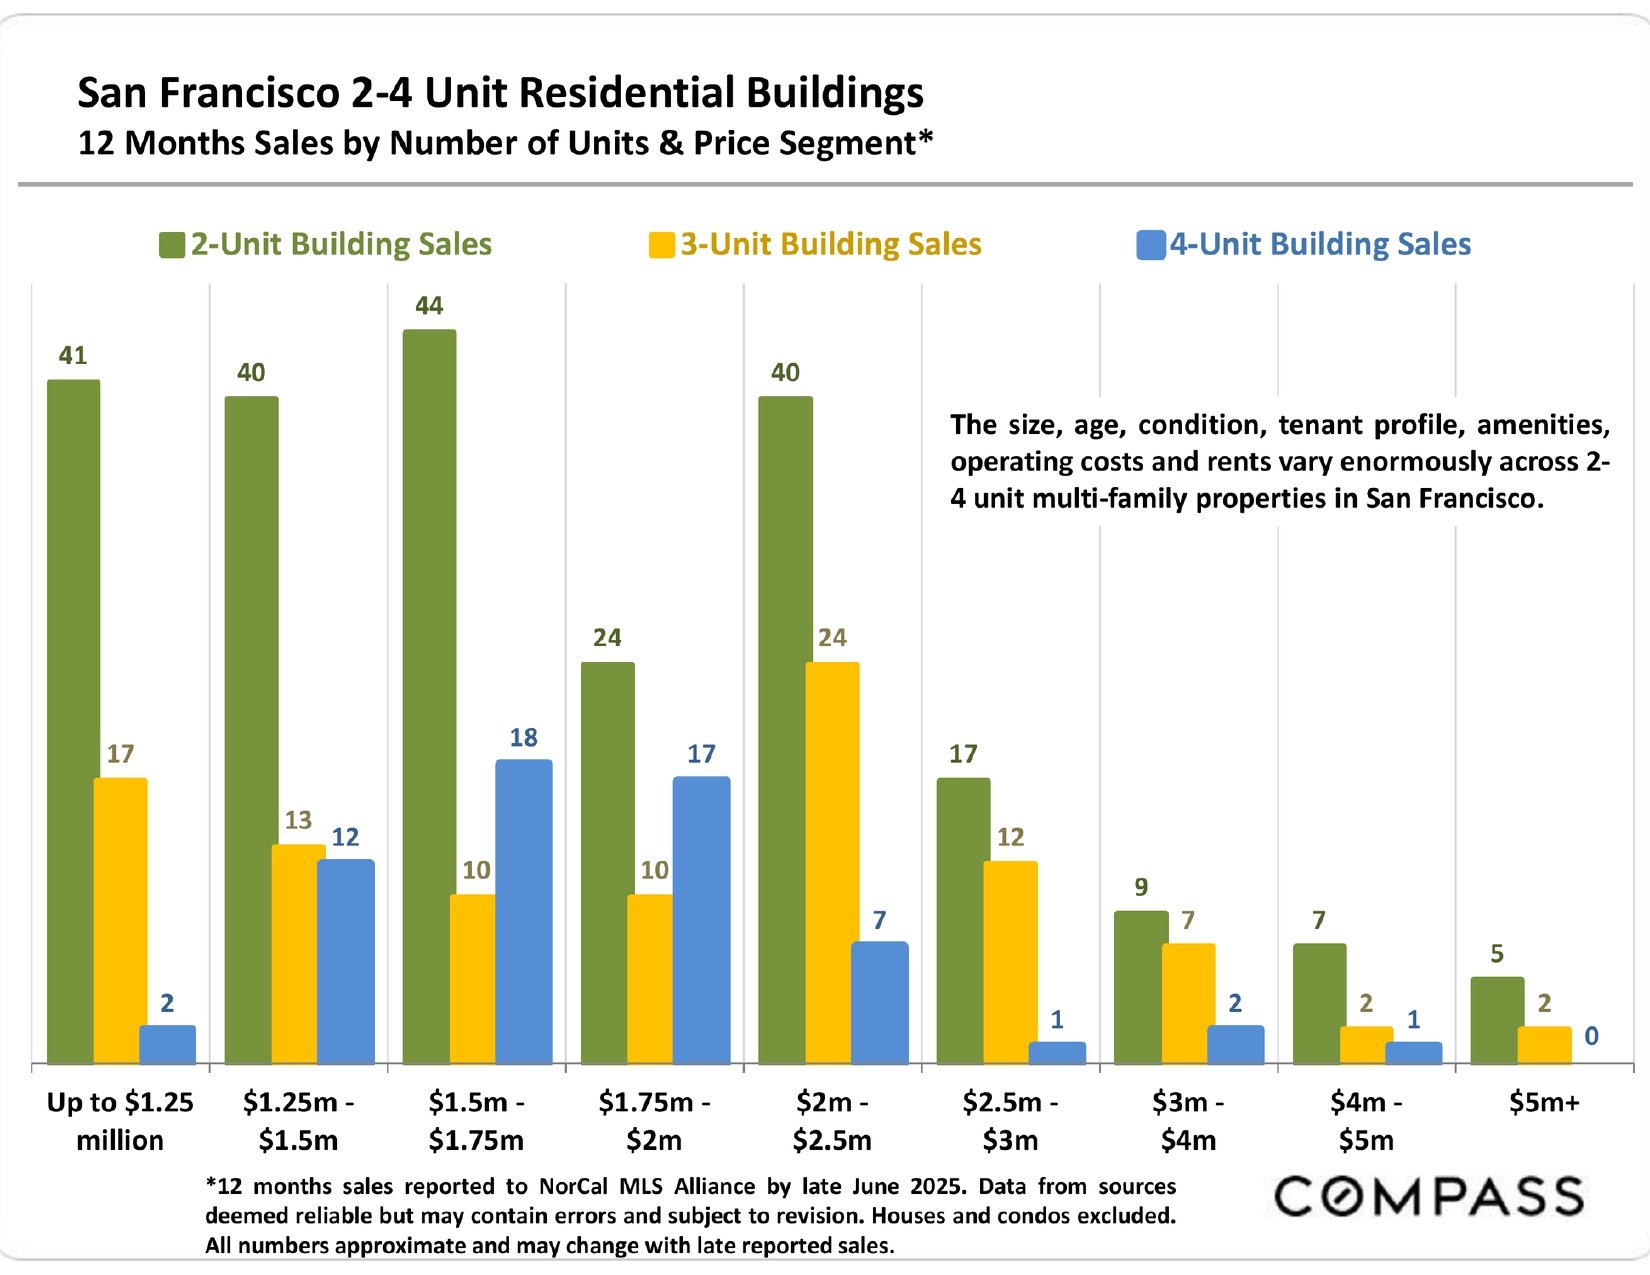
Bar chart of San Francisco 2–4 unit building sales by price range, with 2-unit, 3-unit, and 4-unit counts.

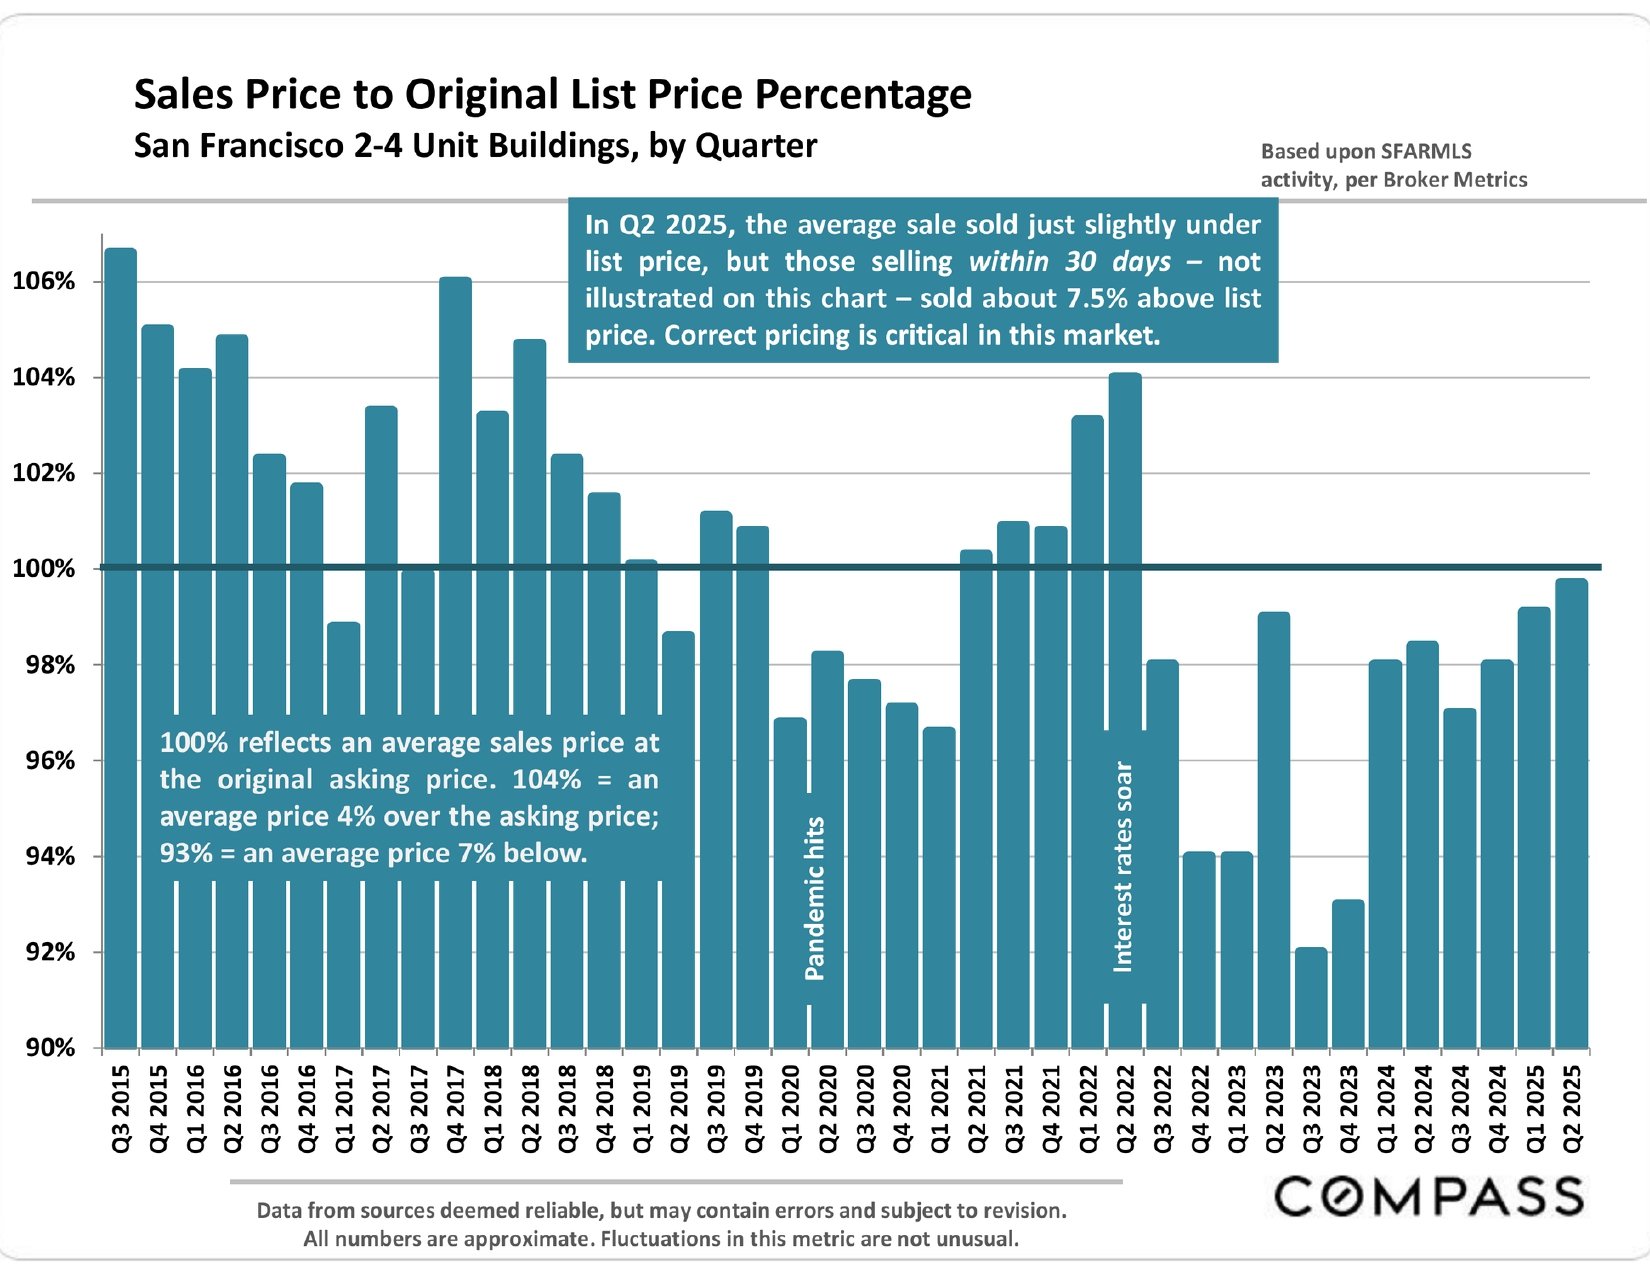
Chart of San Francisco 2–4 unit building sale prices as a percentage of original list price, Q3 2015–Q2 2025.

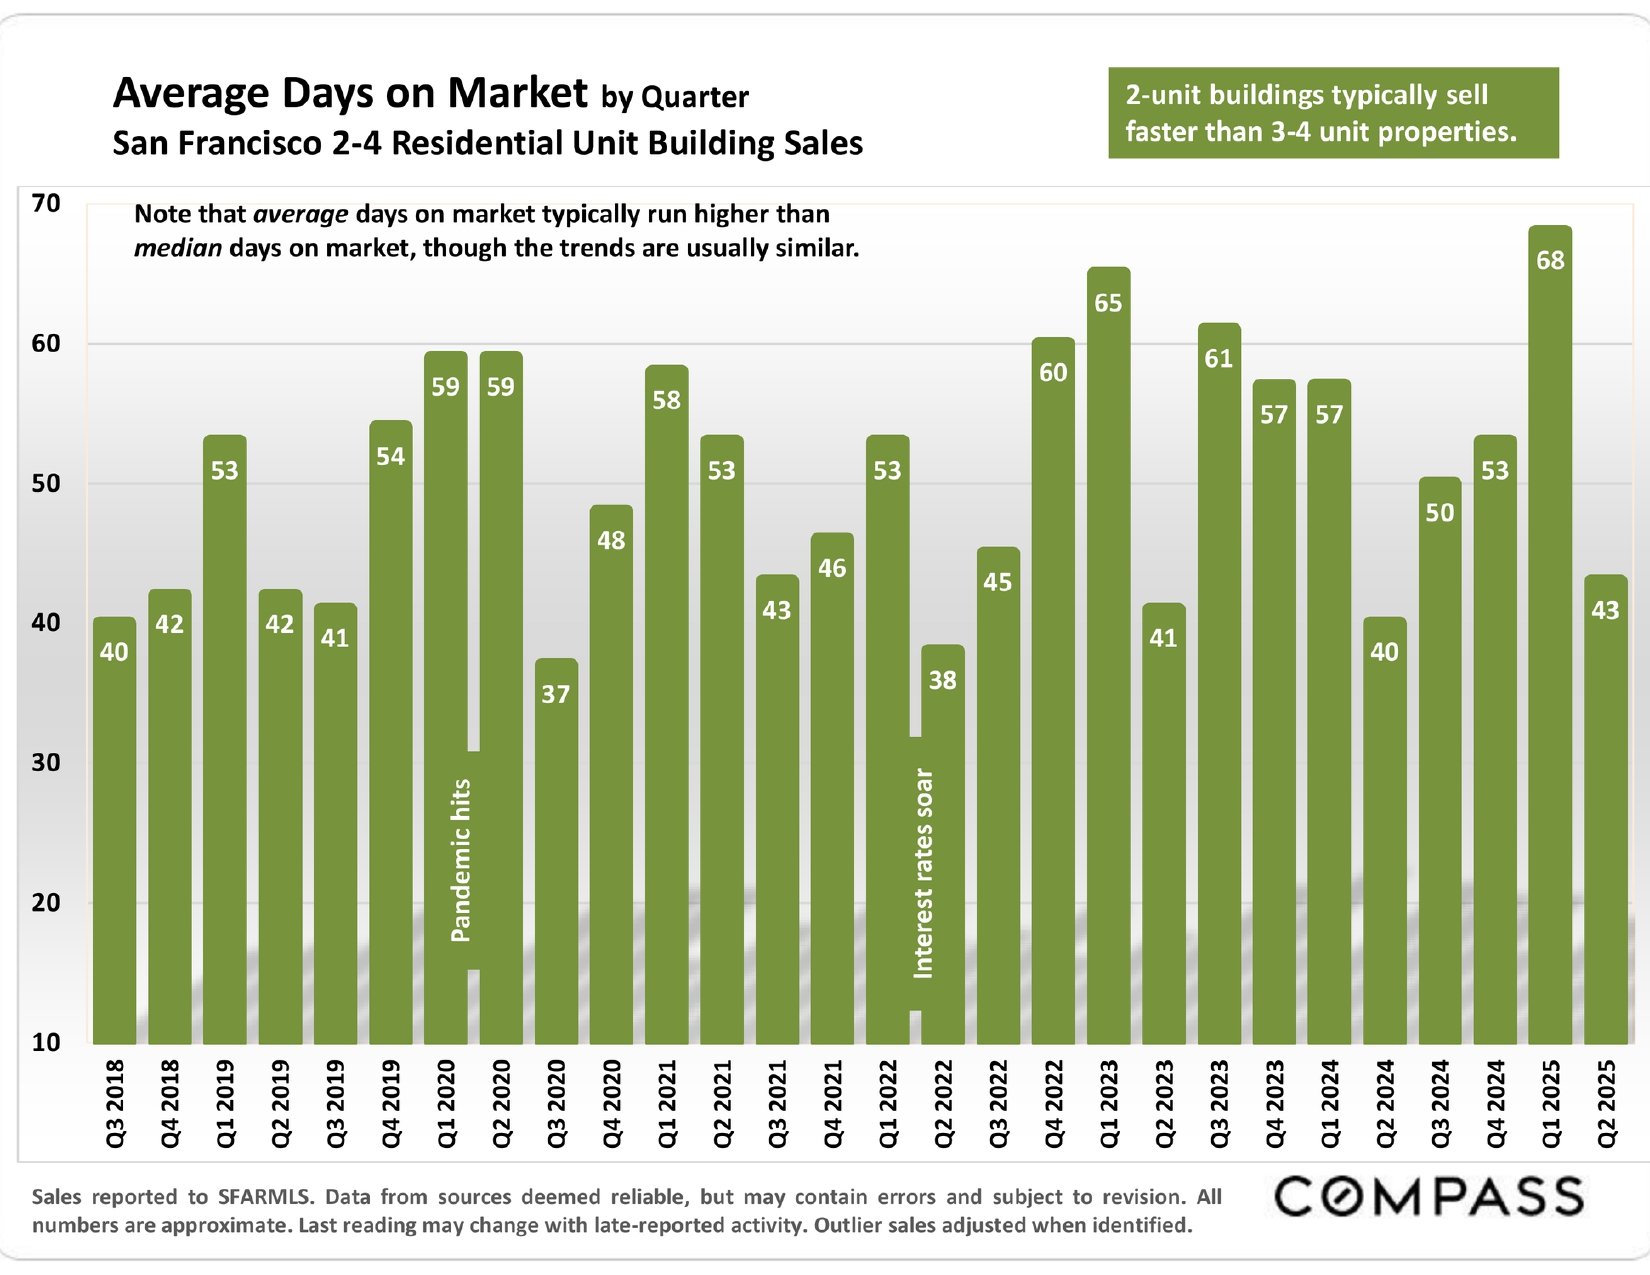
Chart of average days on market for San Francisco 2–4 unit building sales, Q3 2018–Q2 2025.

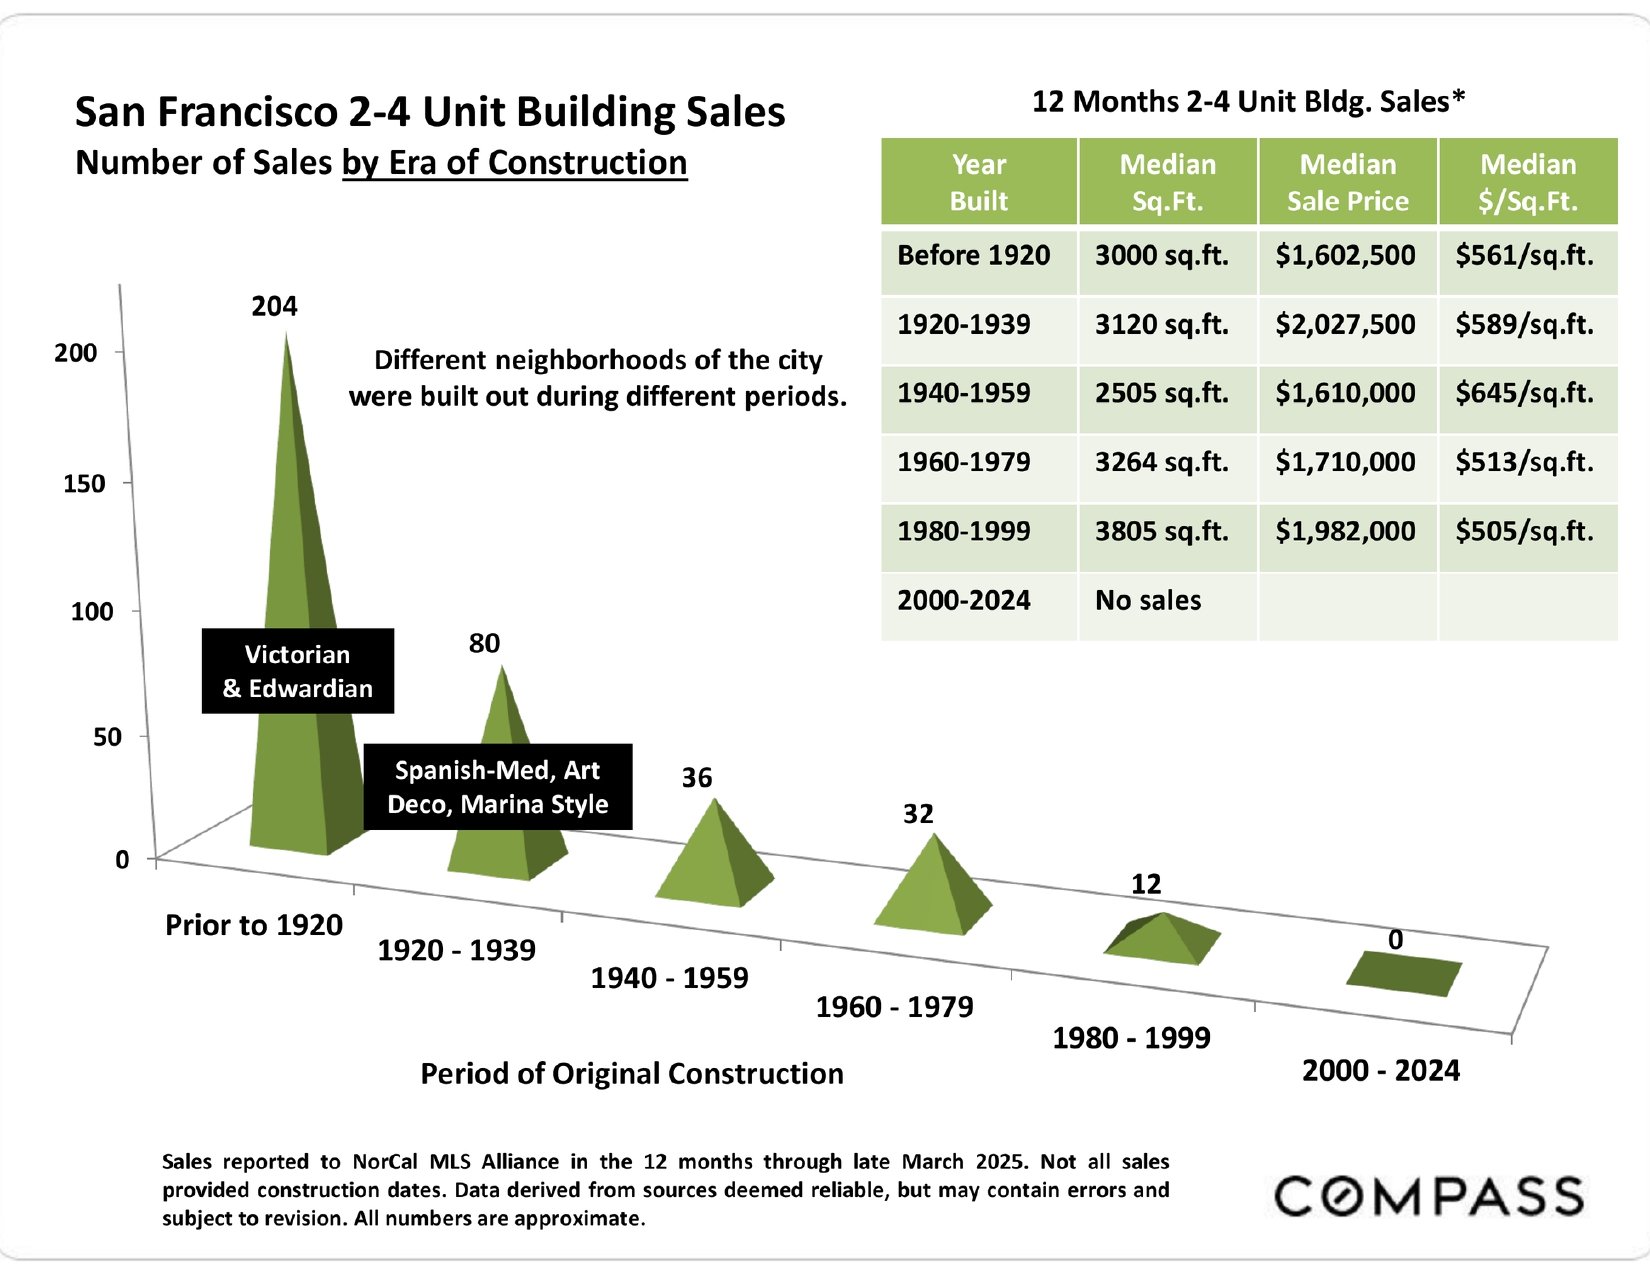
San Francisco 2–4 unit building sales by construction era, with sales counts and median prices through March 2025.

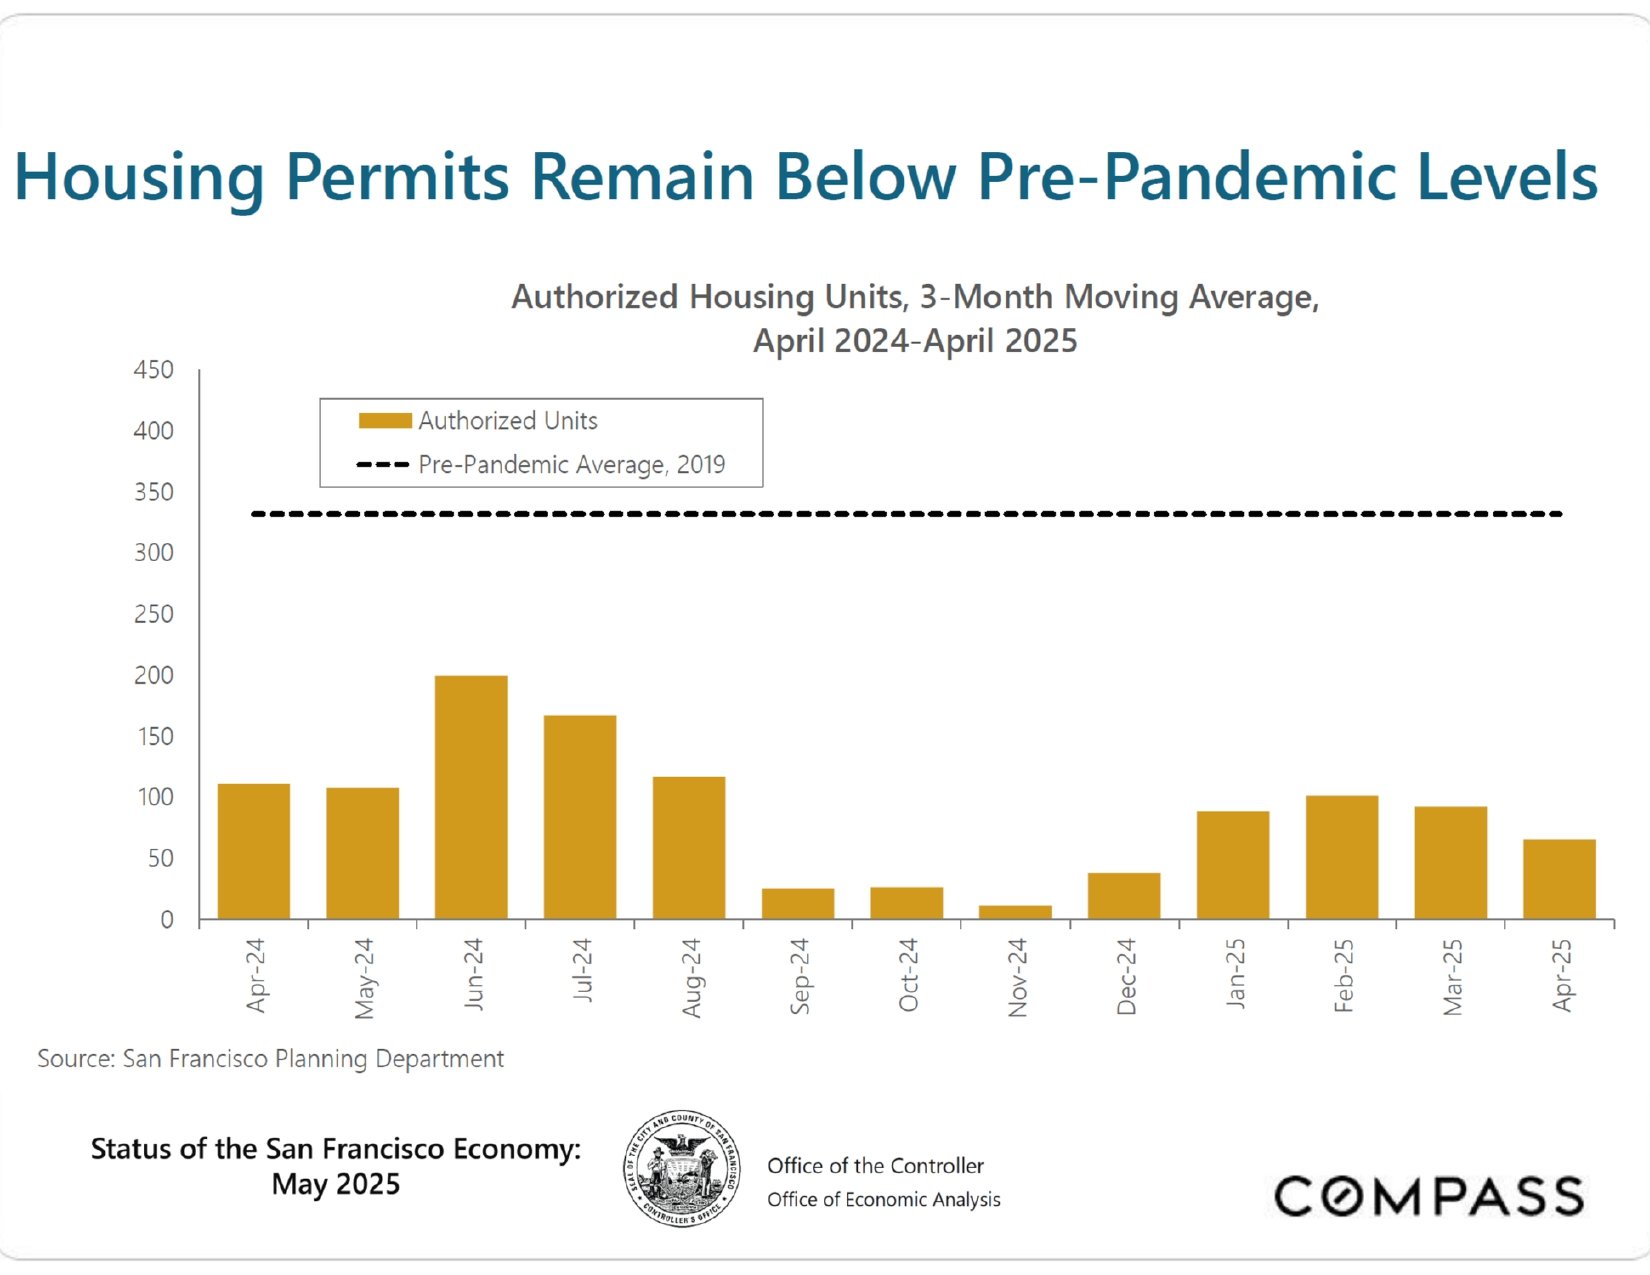
Chart of San Francisco housing permits from April 2024 to April 2025, all below the 2019 average.

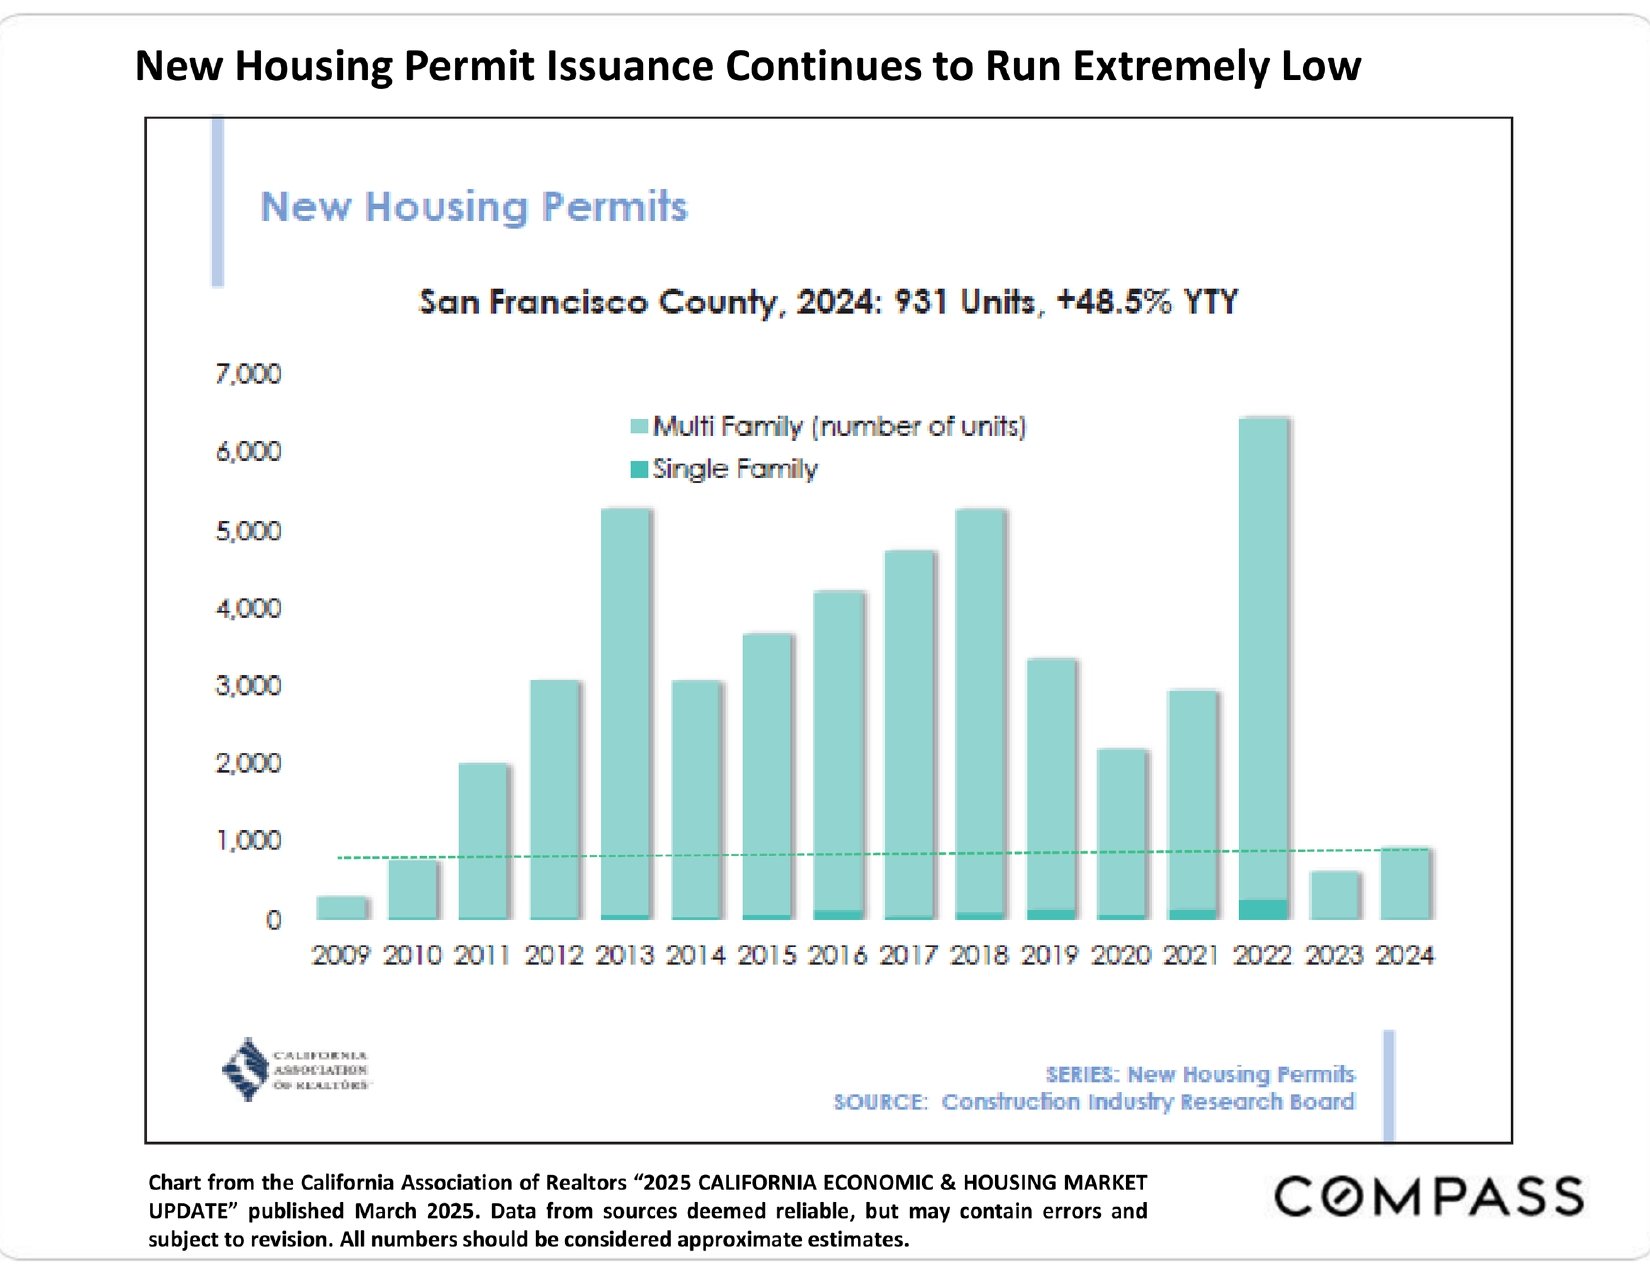
Chart of housing permits, 2009–2024; San Francisco County recorded 931 units in 2024, up 48.5% year over year.

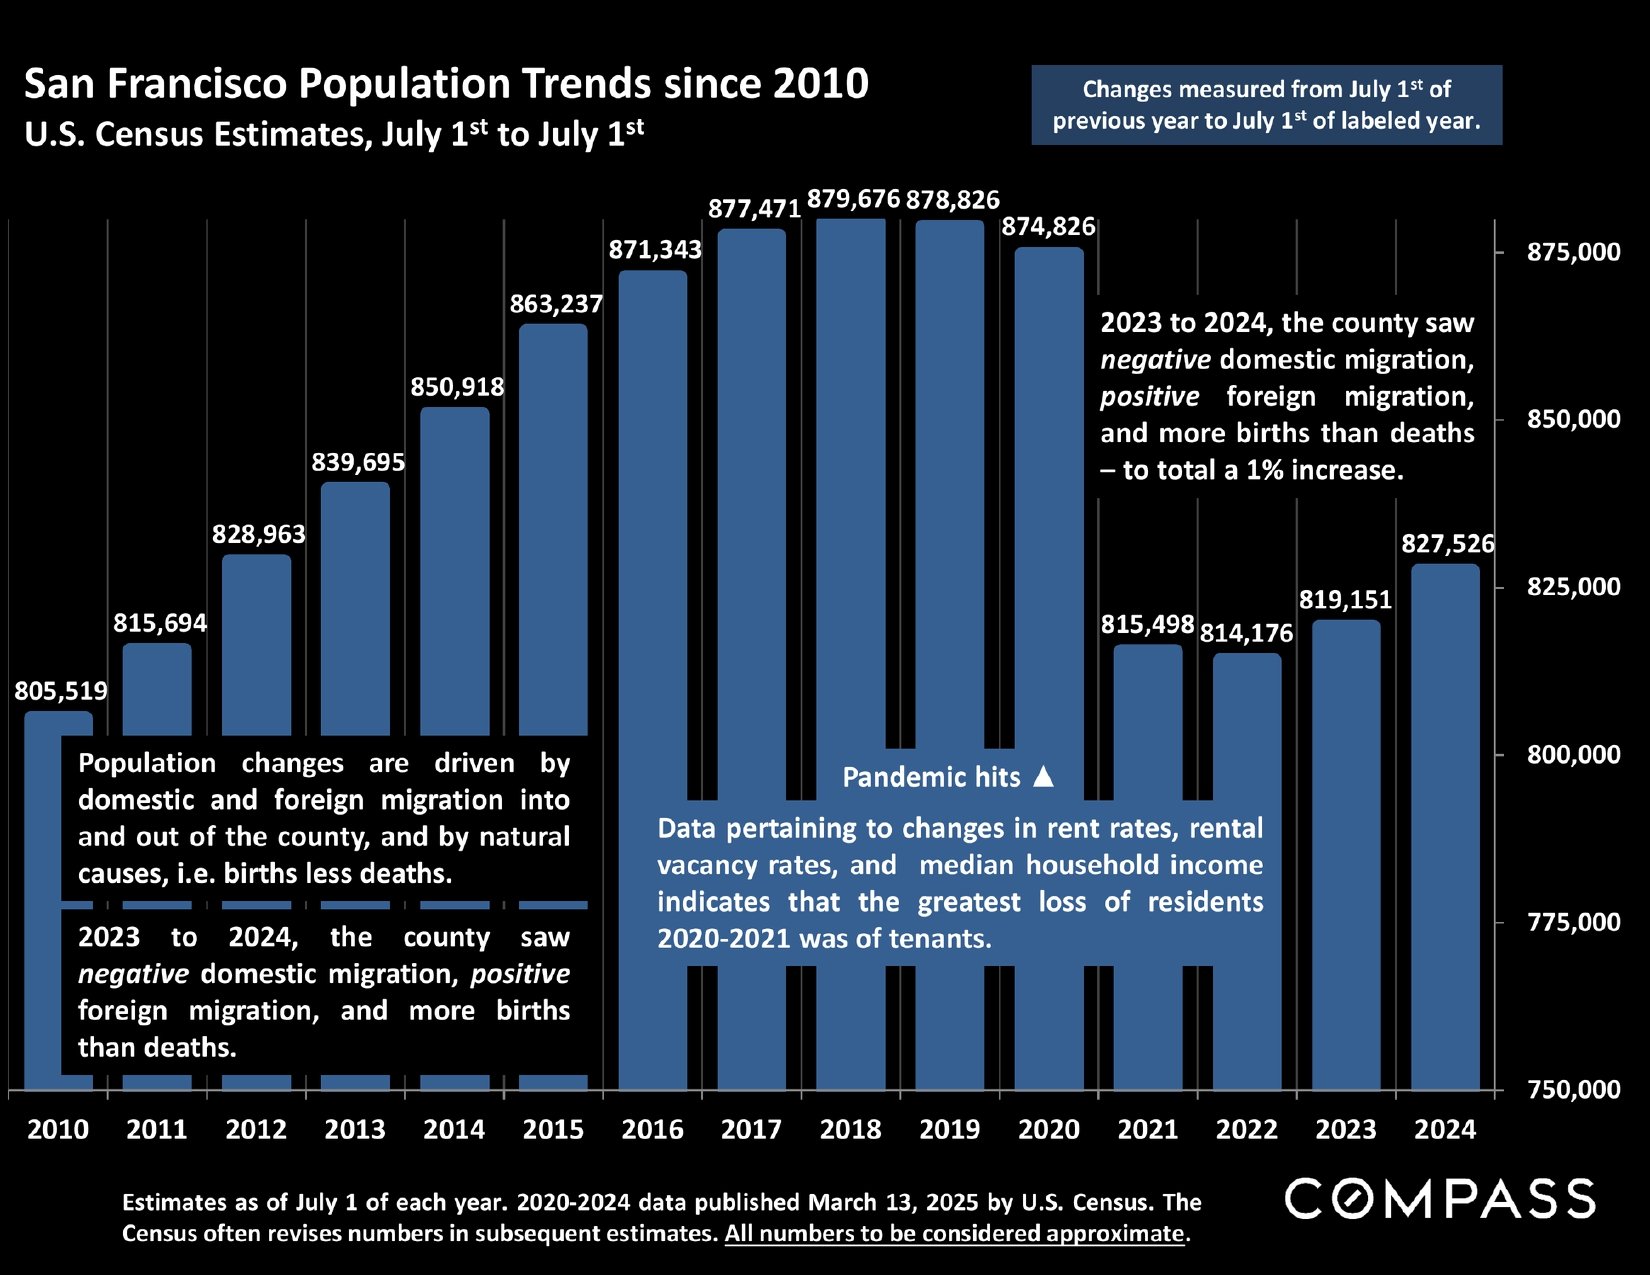
Chart of San Francisco population estimates, 2010–2024, showing a 2018 peak and decline followed by modest growth.

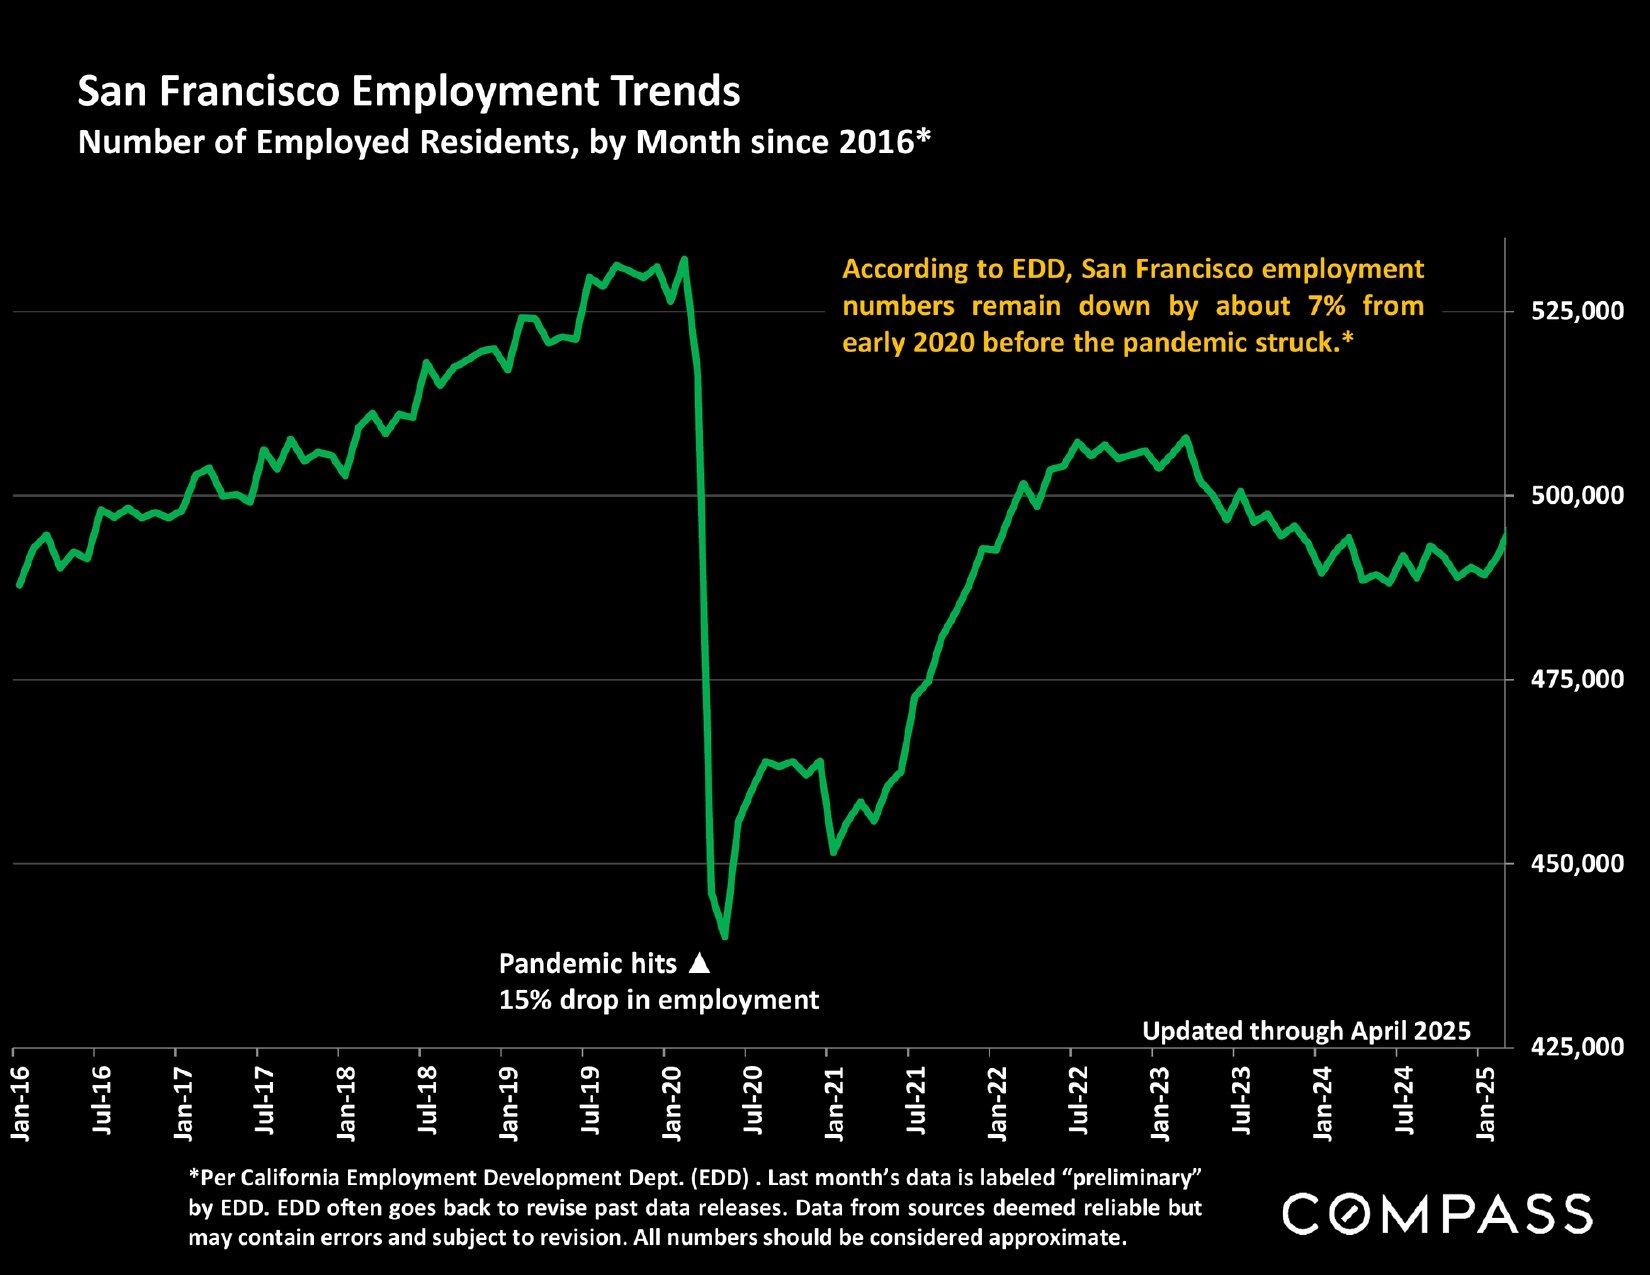
Chart of San Francisco employment from 2016 to April 2025, showing a 15% pandemic drop and partial recovery.

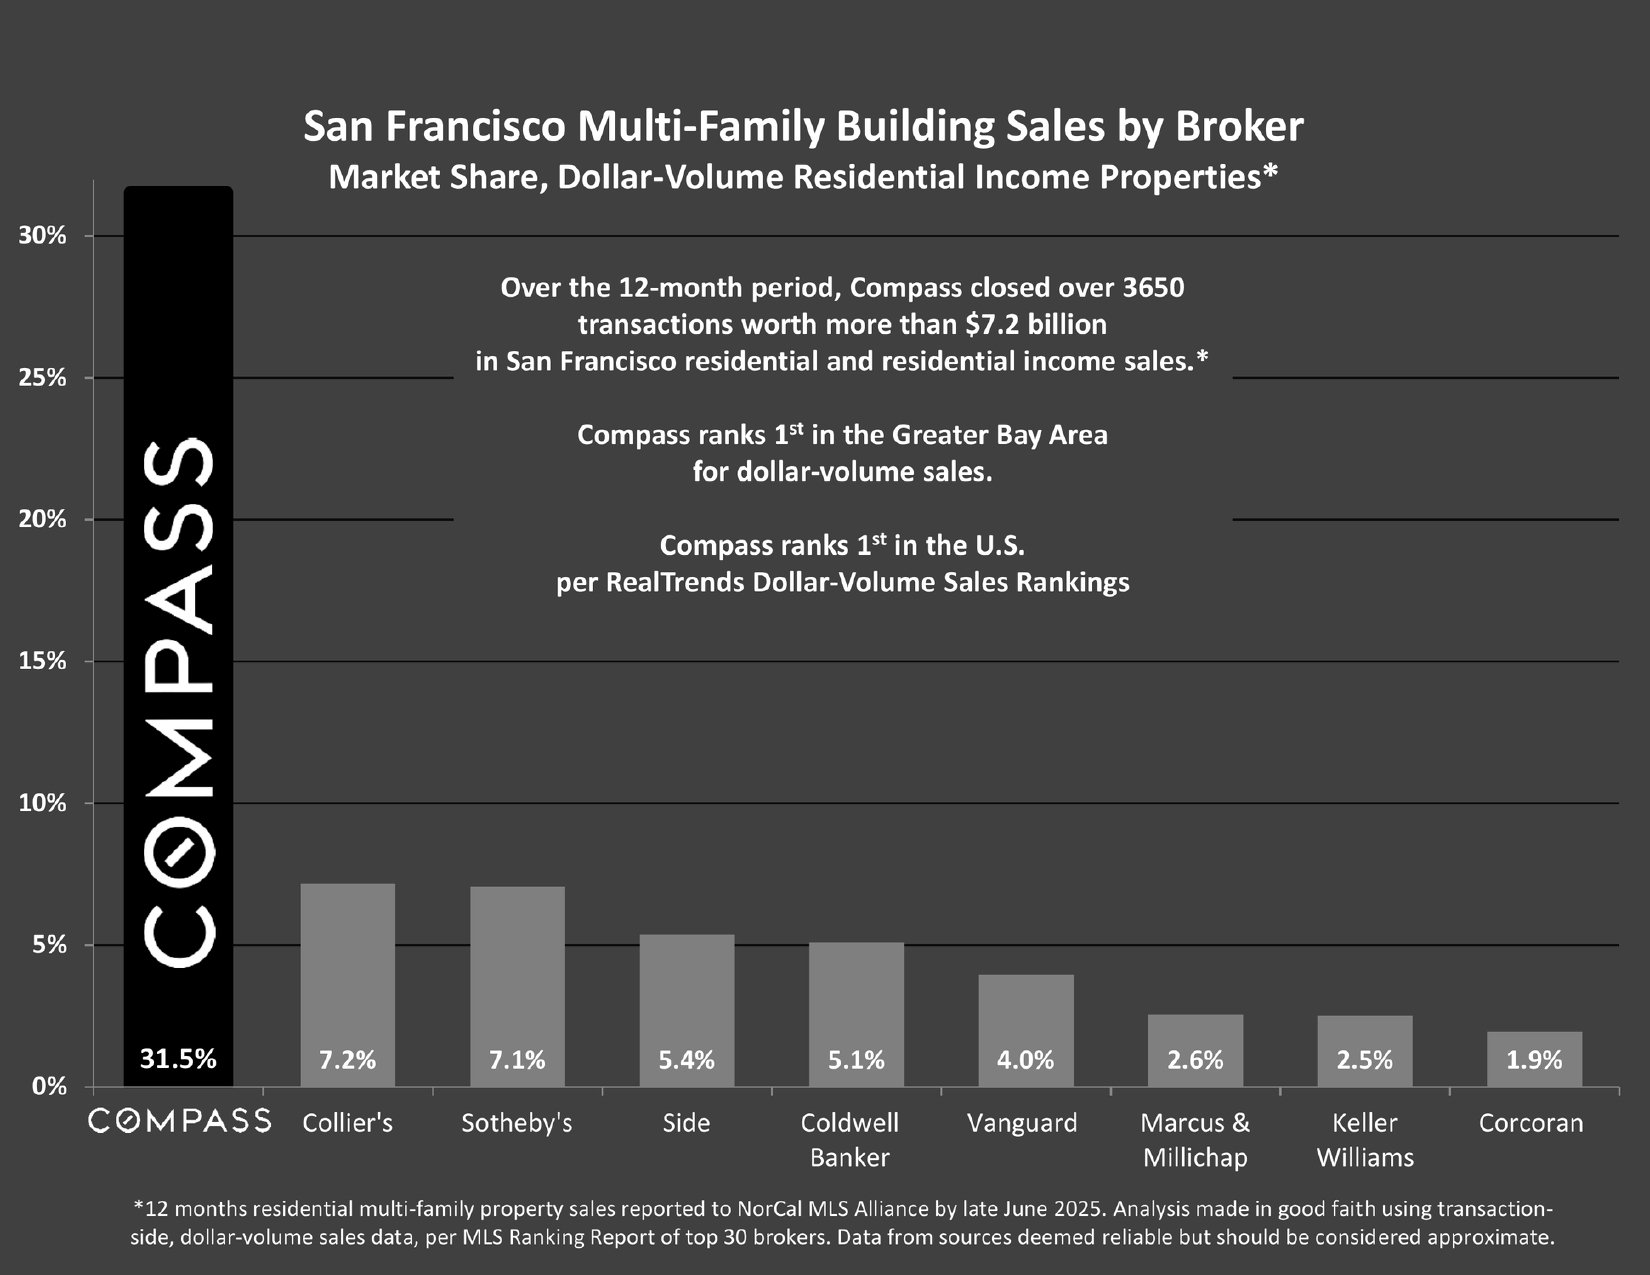
Bar chart comparing San Francisco multifamily building sales market share by broker.

Bay Area market reports page featuring a COMPASS link and county report tiles.

Compass report disclaimer detailing market data limitations, legal terms, and the 2025 copyright.


Work With Hanna John Azar

During his past experiences, Hanna John Azar has gained particularly strong knowledge and hands-on experience in maneuvering complex multi-faceted value-add investments.
Contact